The State of France Private Equity


Executive Summary
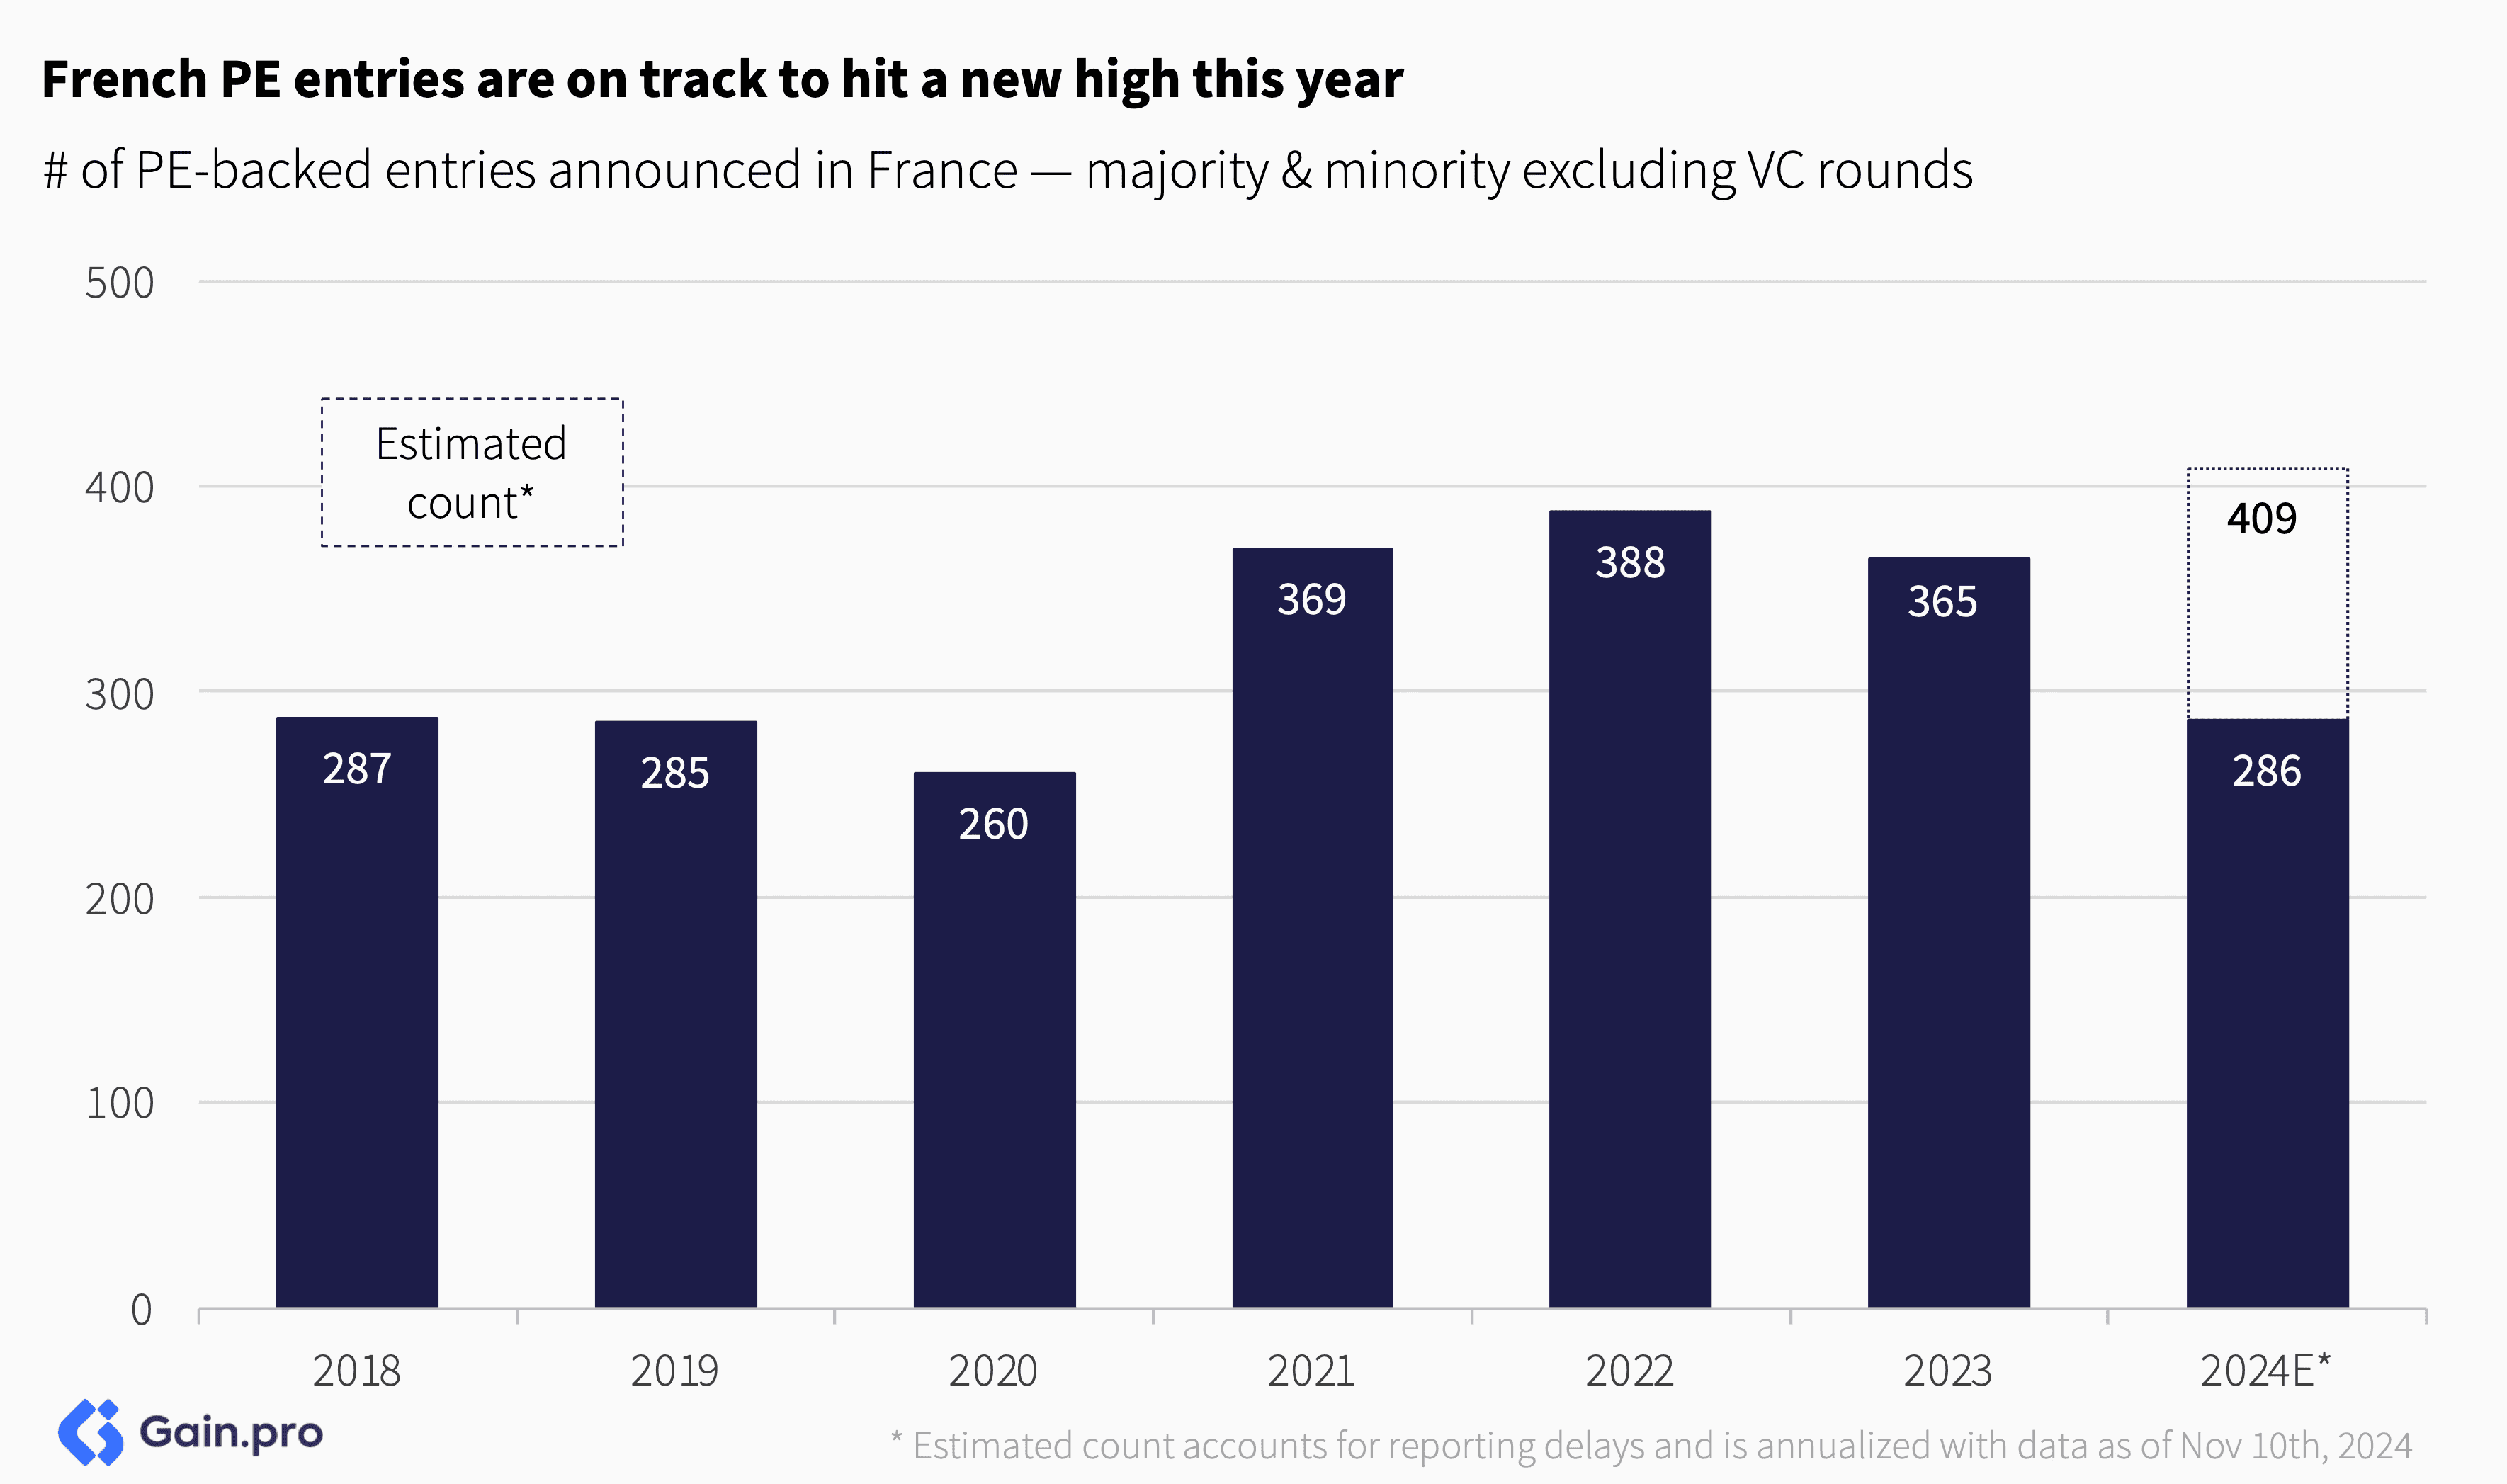
Entries — PE-backed entries in France are on track to hit a new high this year, propelled by a surge in activity across the Services, Industrials and TMT sectors. Even after the recent surge in deal activity, France notably remains underweight TMT (-5%) compared to the Rest of Europe.
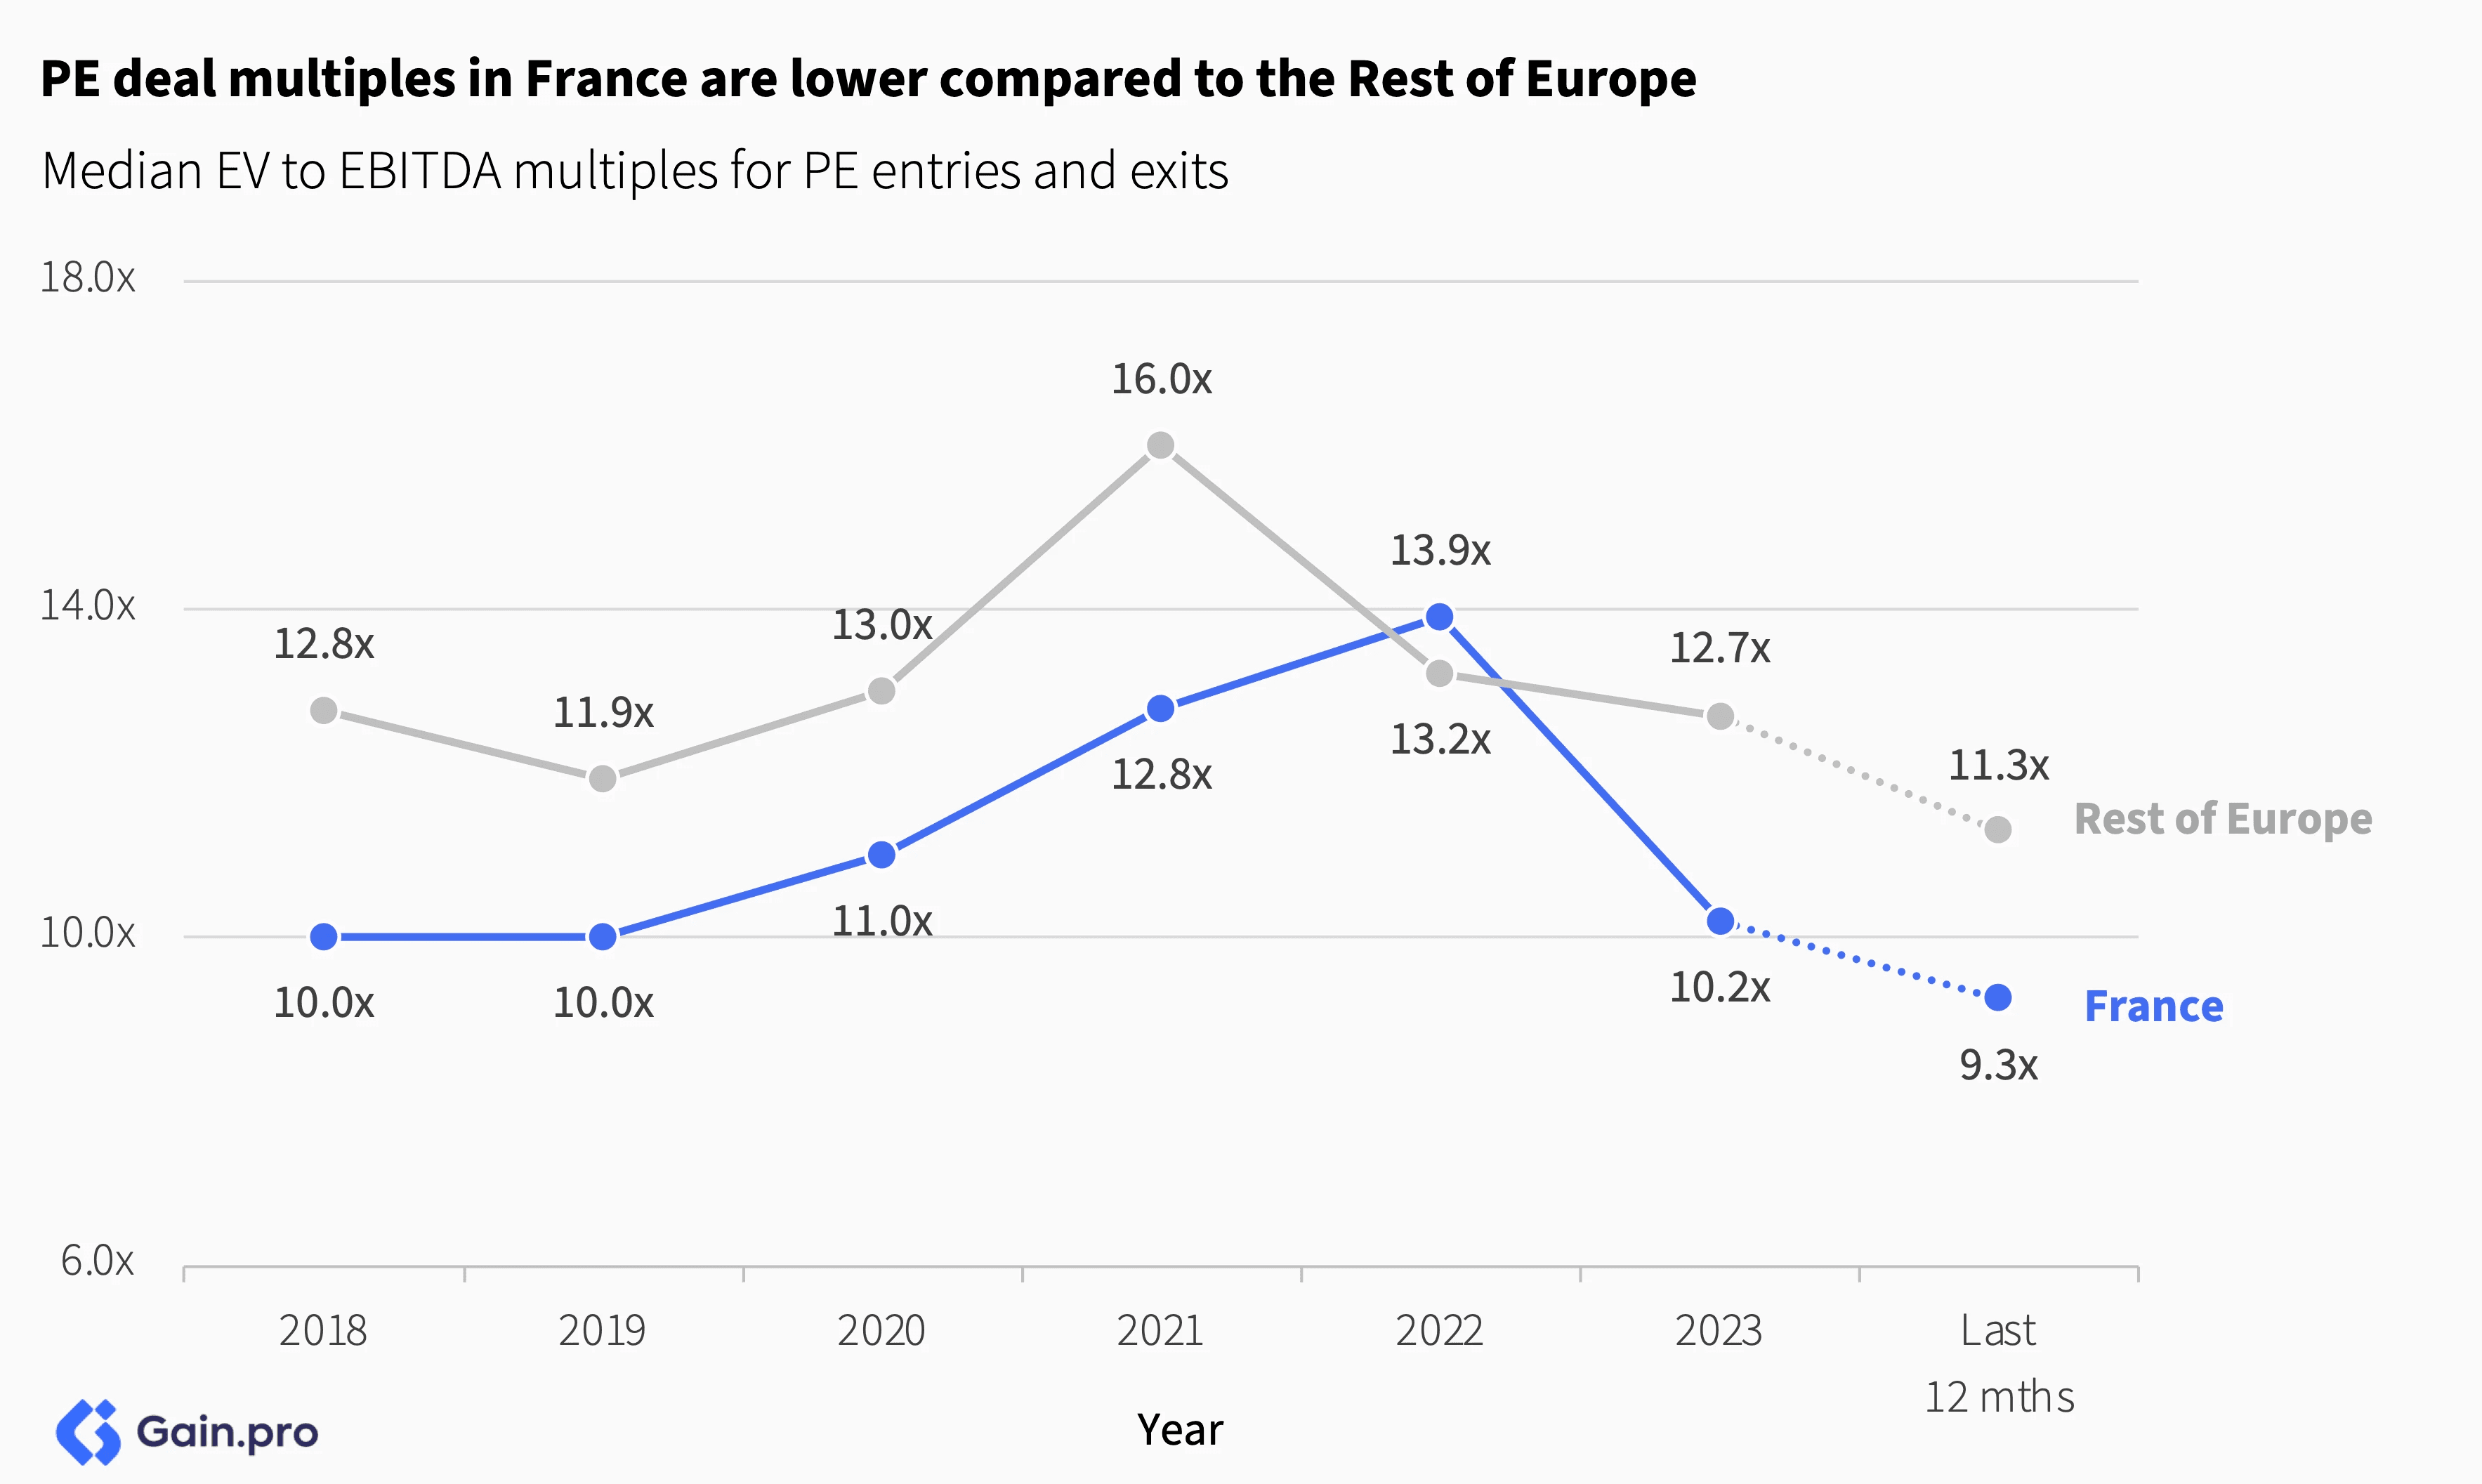
Exits — PE exits are up, driven by a particularly strong Sponsor-to-Sponsor exit market. But multiples are down (currently standing at 9.3x) and holding periods are up (from 5.6 to 6.1 years)
Largest global investors investing in France — Ardian has emerged as the largest sponsor investing in France, managing a total estimated EV of €12.6bn in the region, followed by Bpifrance (€11.1bn) and Clayton, Dubilier & Rice (€10.6bn). France stands out as one of the most domestic PE markets in Europe.
Largest French investors investing in Europe — Ardian also emerges as the leading French HQ’d investor, managing a total estimated EV of €30.9bn across Europe, followed by PAI Partners ( €21.6bn) and Astorg (€12bn). Other investors in the top 10 include Crédit Agricole, Bpifrance, Antin, Naxicap, Eurazeo, CDC and AXA.
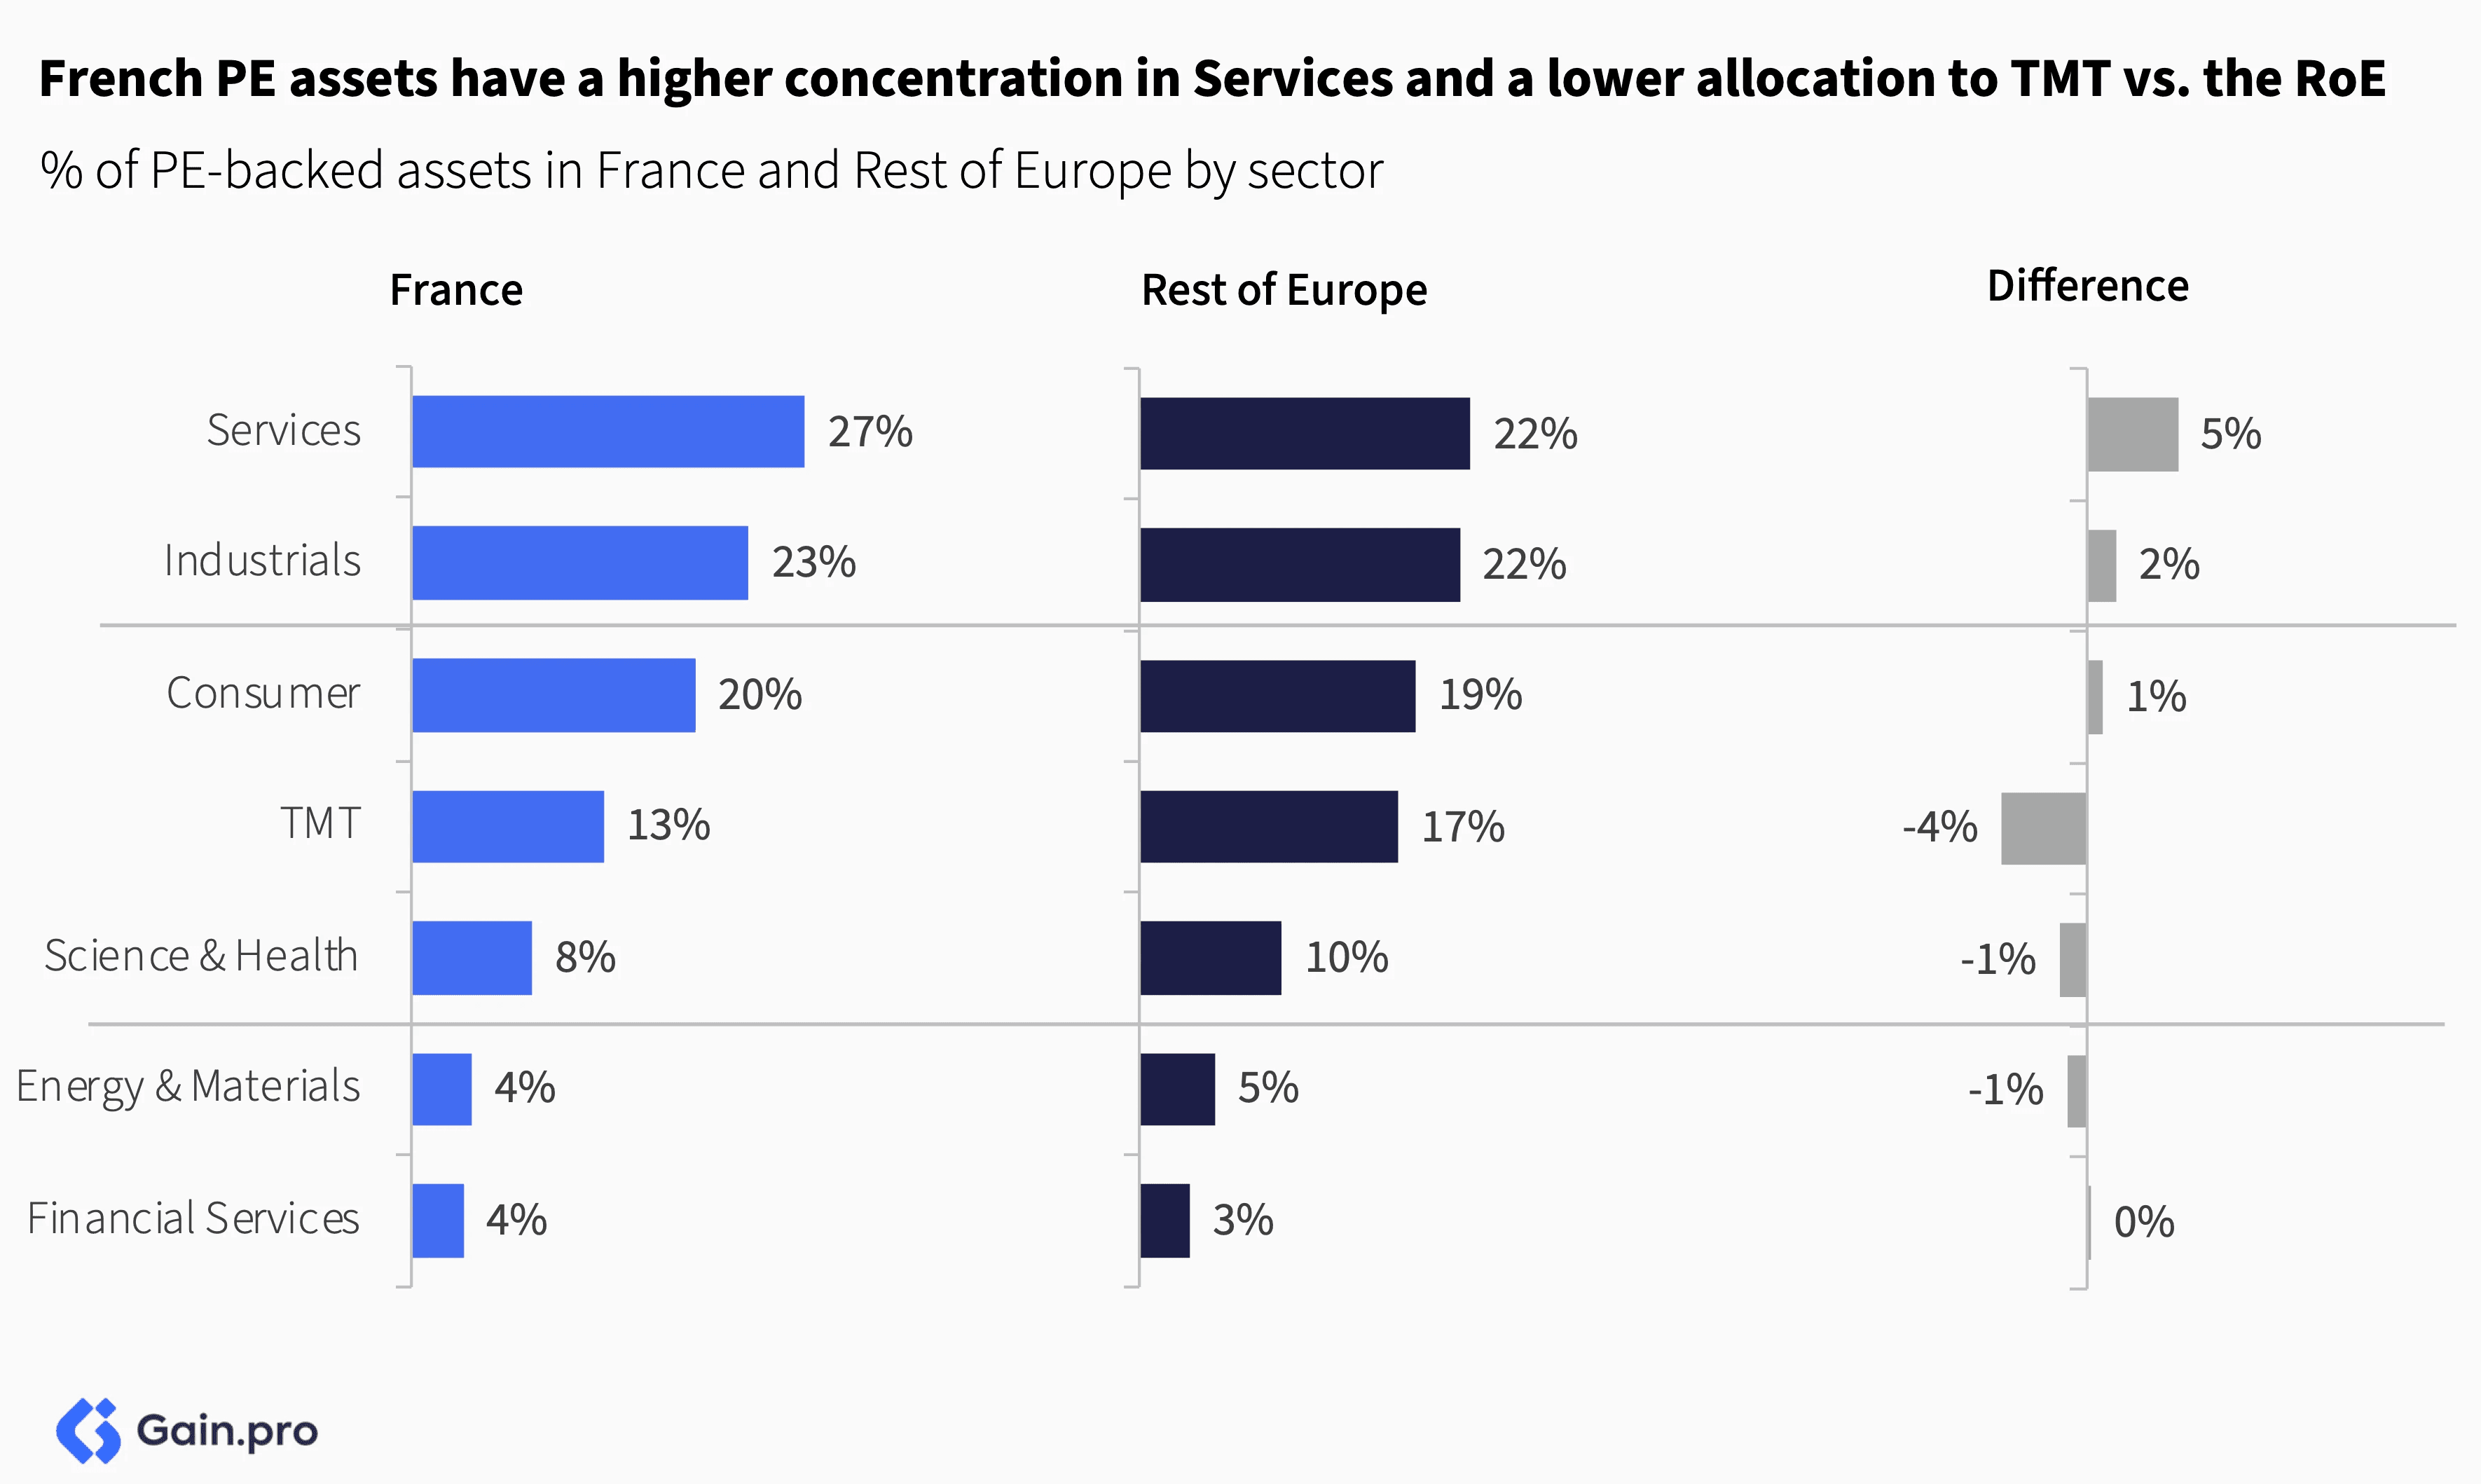
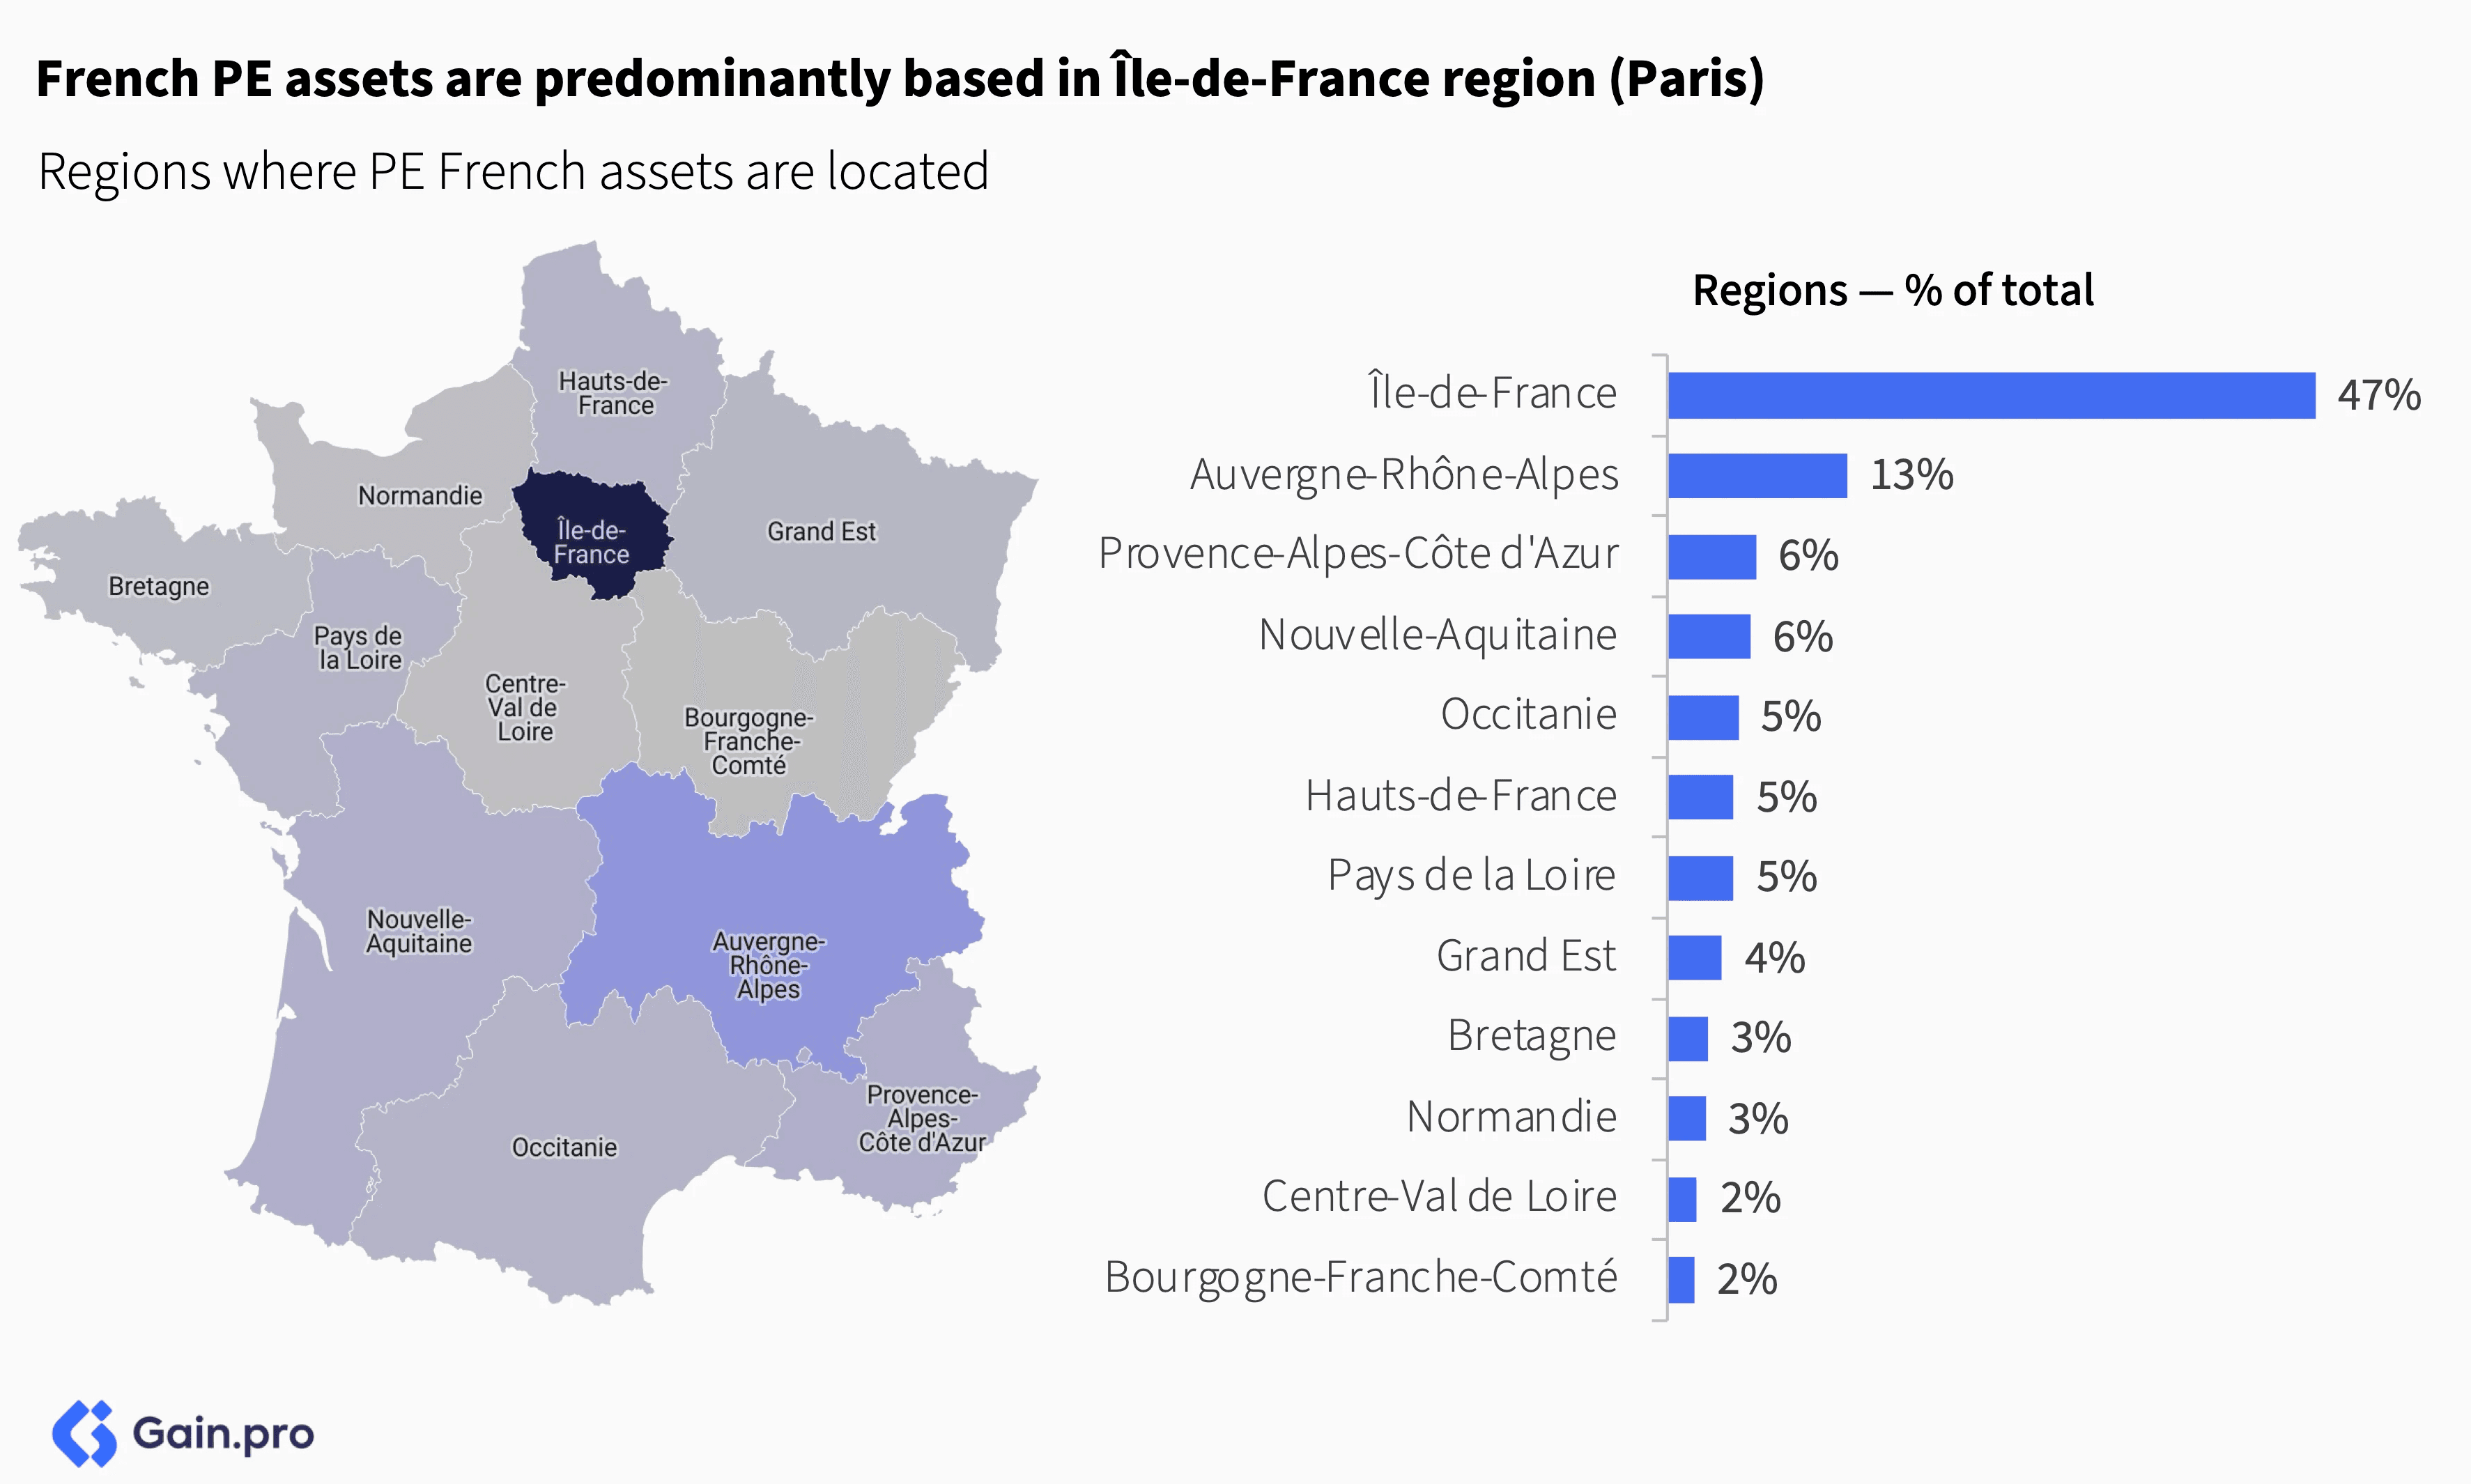
PE portfolio stats — Services is the largest PE sector in France accounting for 27% of assets followed by Industrials (23%) and Consumer (20%). By region, Paris is the de facto hub, accounting for 47% of French PE-backed assets and 44 of the 50 largest French investors.
If you have any questions about the data or the report, do not hesitate to reach out to sid.jain@gain.pro.


Chapter 01: Entries
Overall PE Entries
PE-backed entries in France are on track to hit a new high this year. Investors are starting to deploy record levels of dry powder as overall market conditions improve. The strong deal momentum is driven by an uptick in activity in the Services, Industrials and TMT sectors.
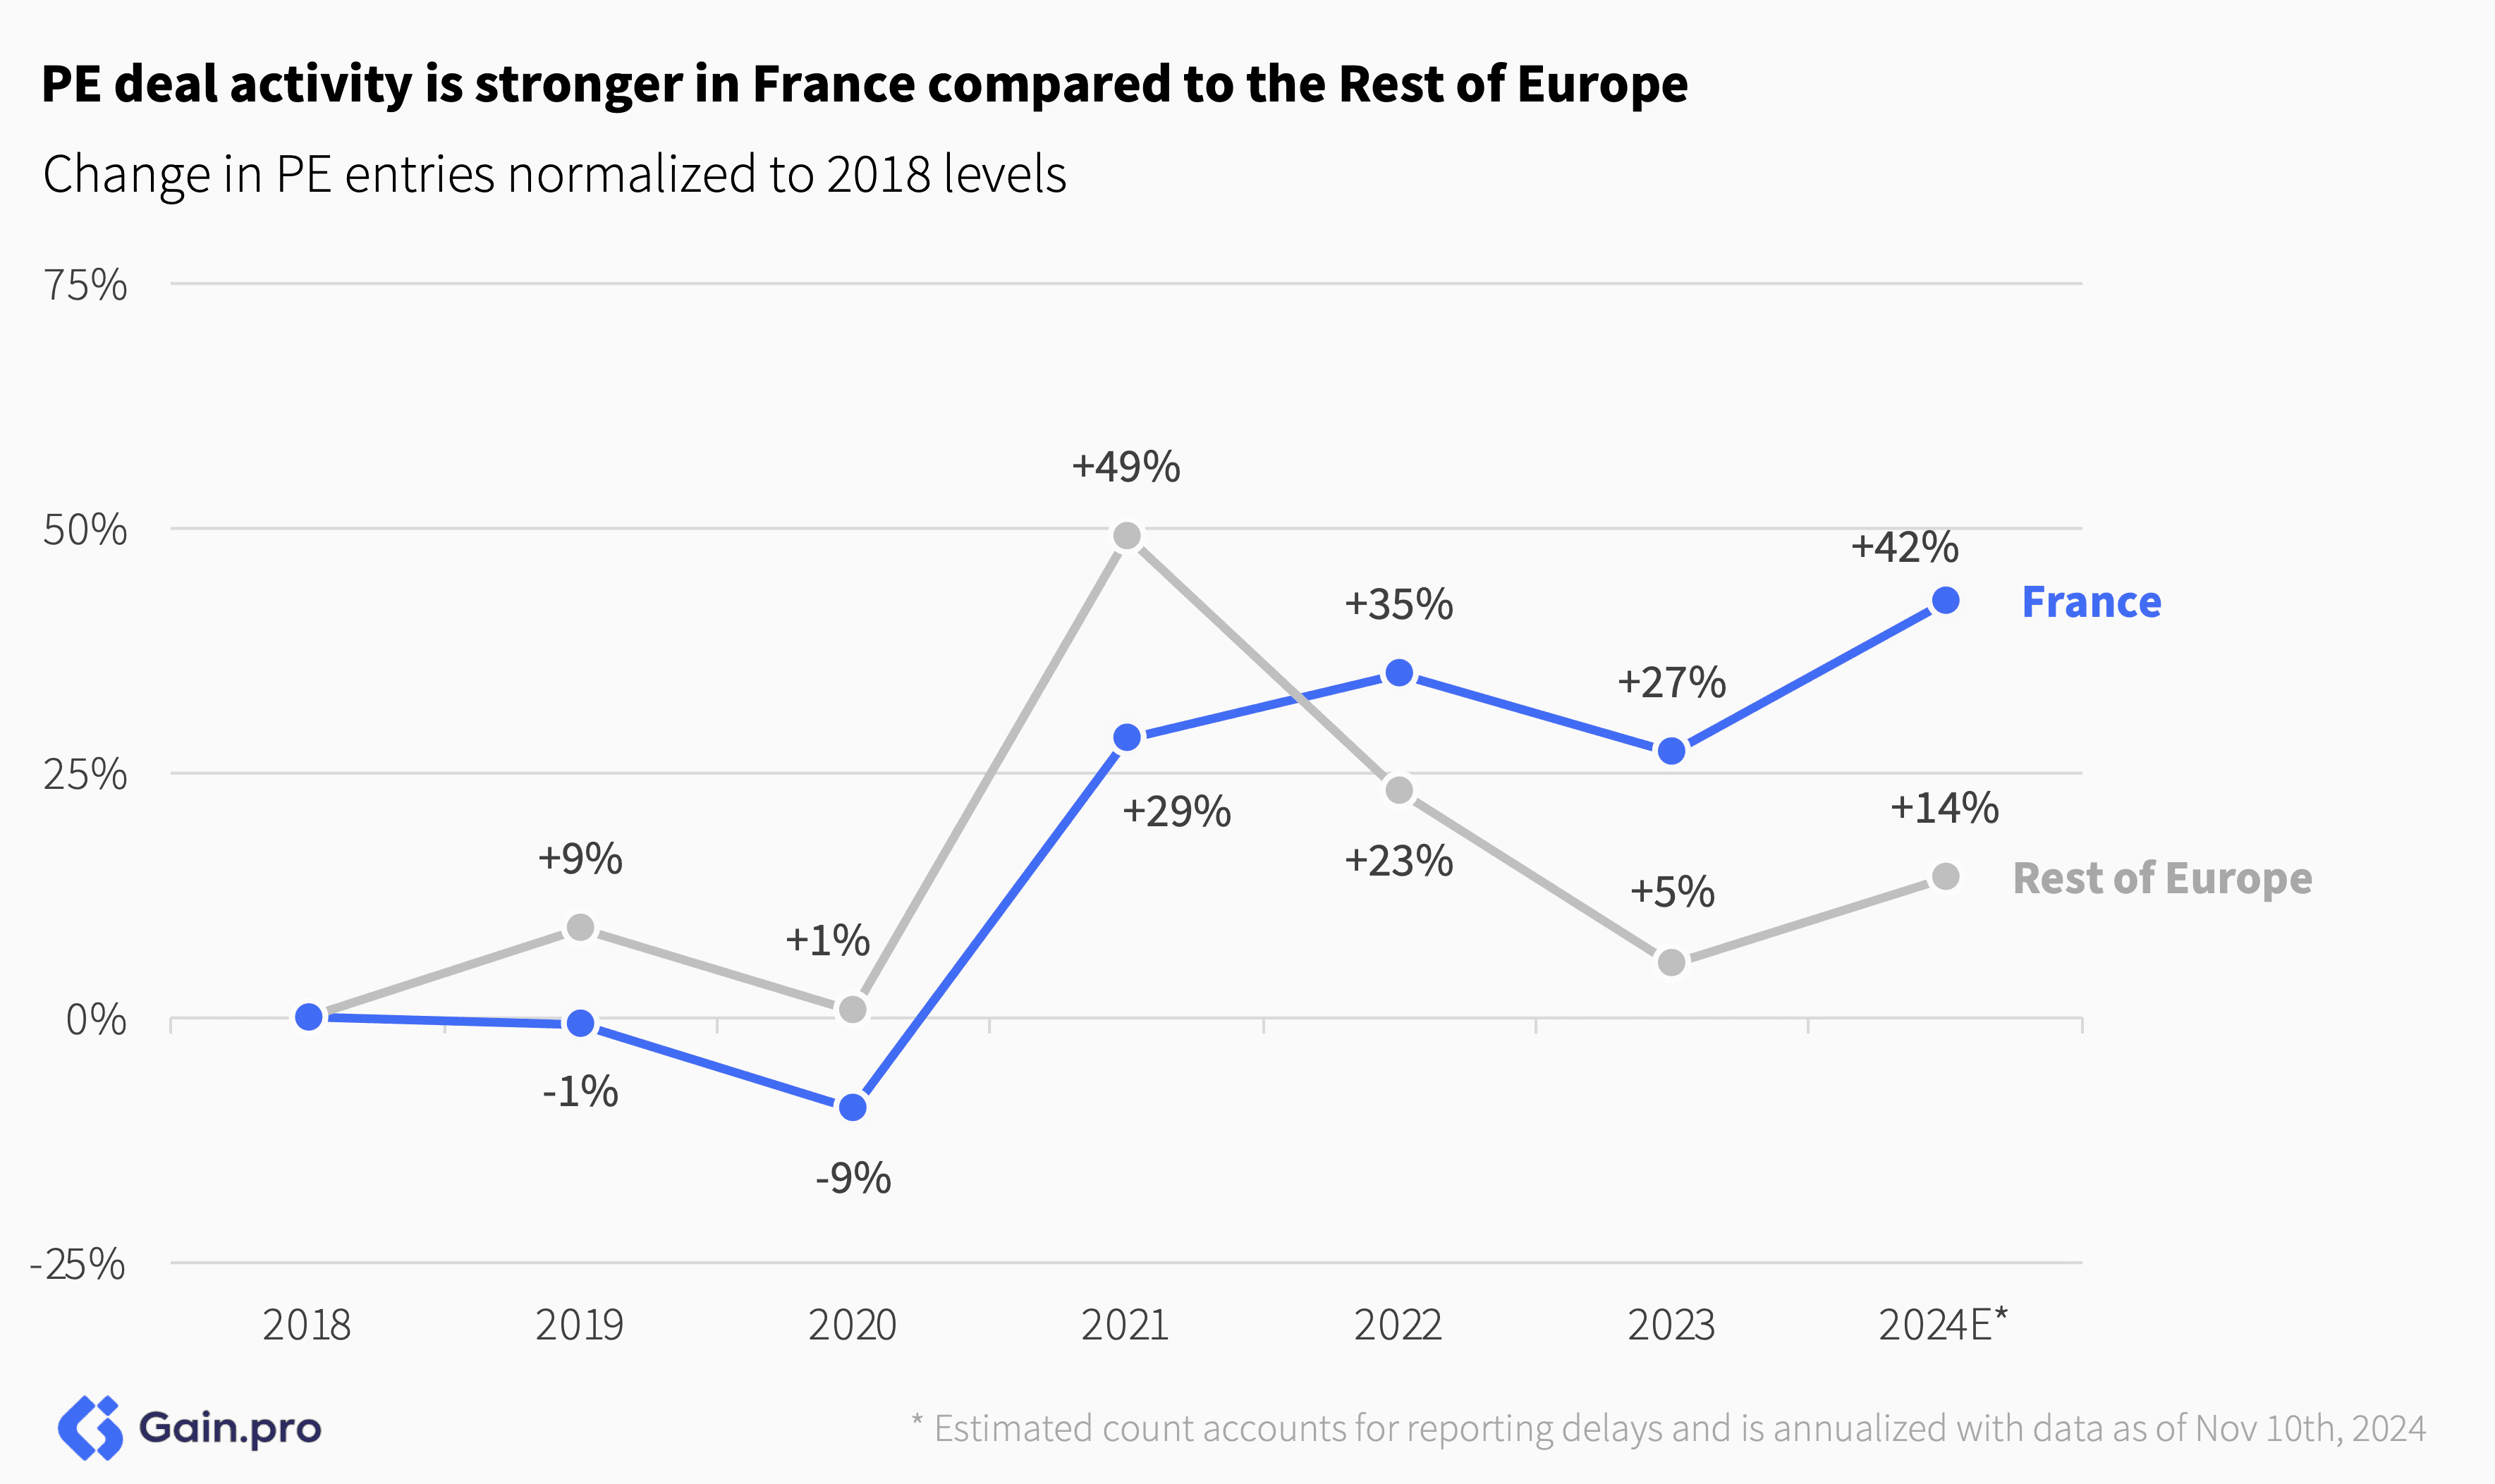
Compared to the Rest of Europe, deal activity remains stronger in France. Deals are up 42% since 2018, outpacing the 14% rise seen across the Rest of Europe. Unlike other regions, France also did not see a deal boom in 2021 followed by a sharp decline. Activity was more balanced.
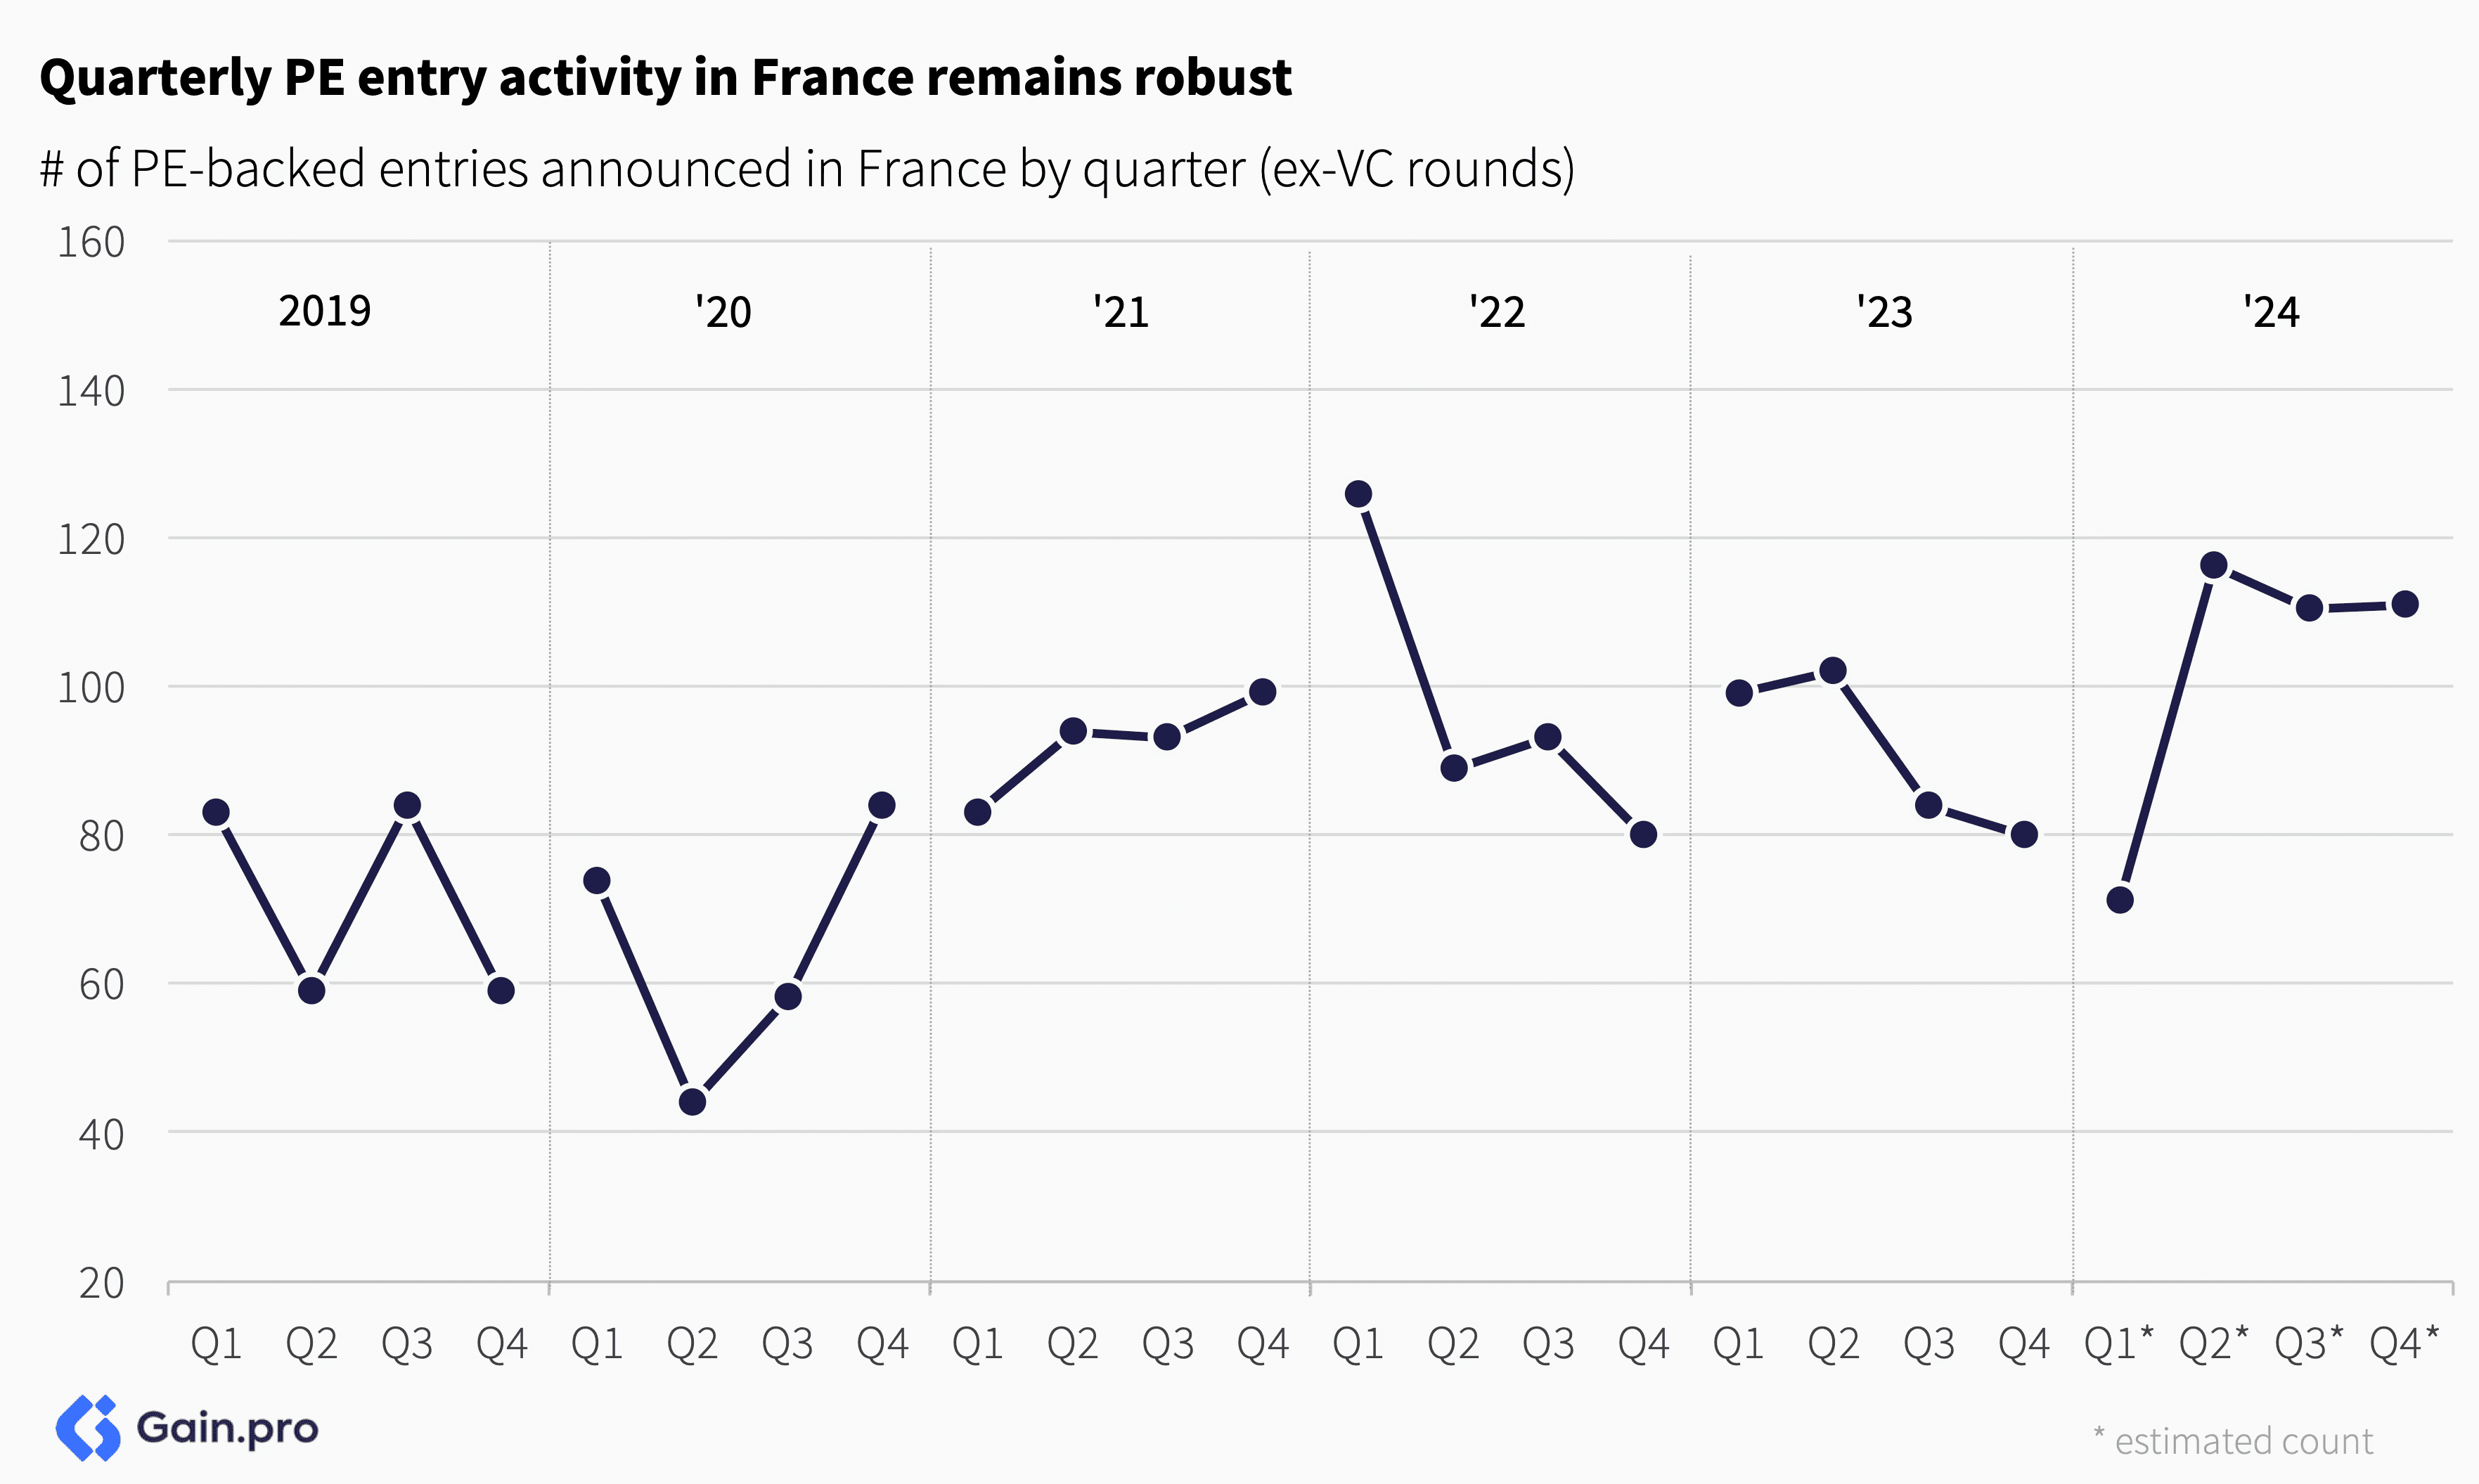
Quarterly PE entry activity in France remains robust. After a slow Q1, the pace of PE entries has picked up. Investor confidence is improving. Q4 saw one of largest PE deals in French history (CD&R acquiring 50% stake in Opella from Sanofi at €16bn EV).
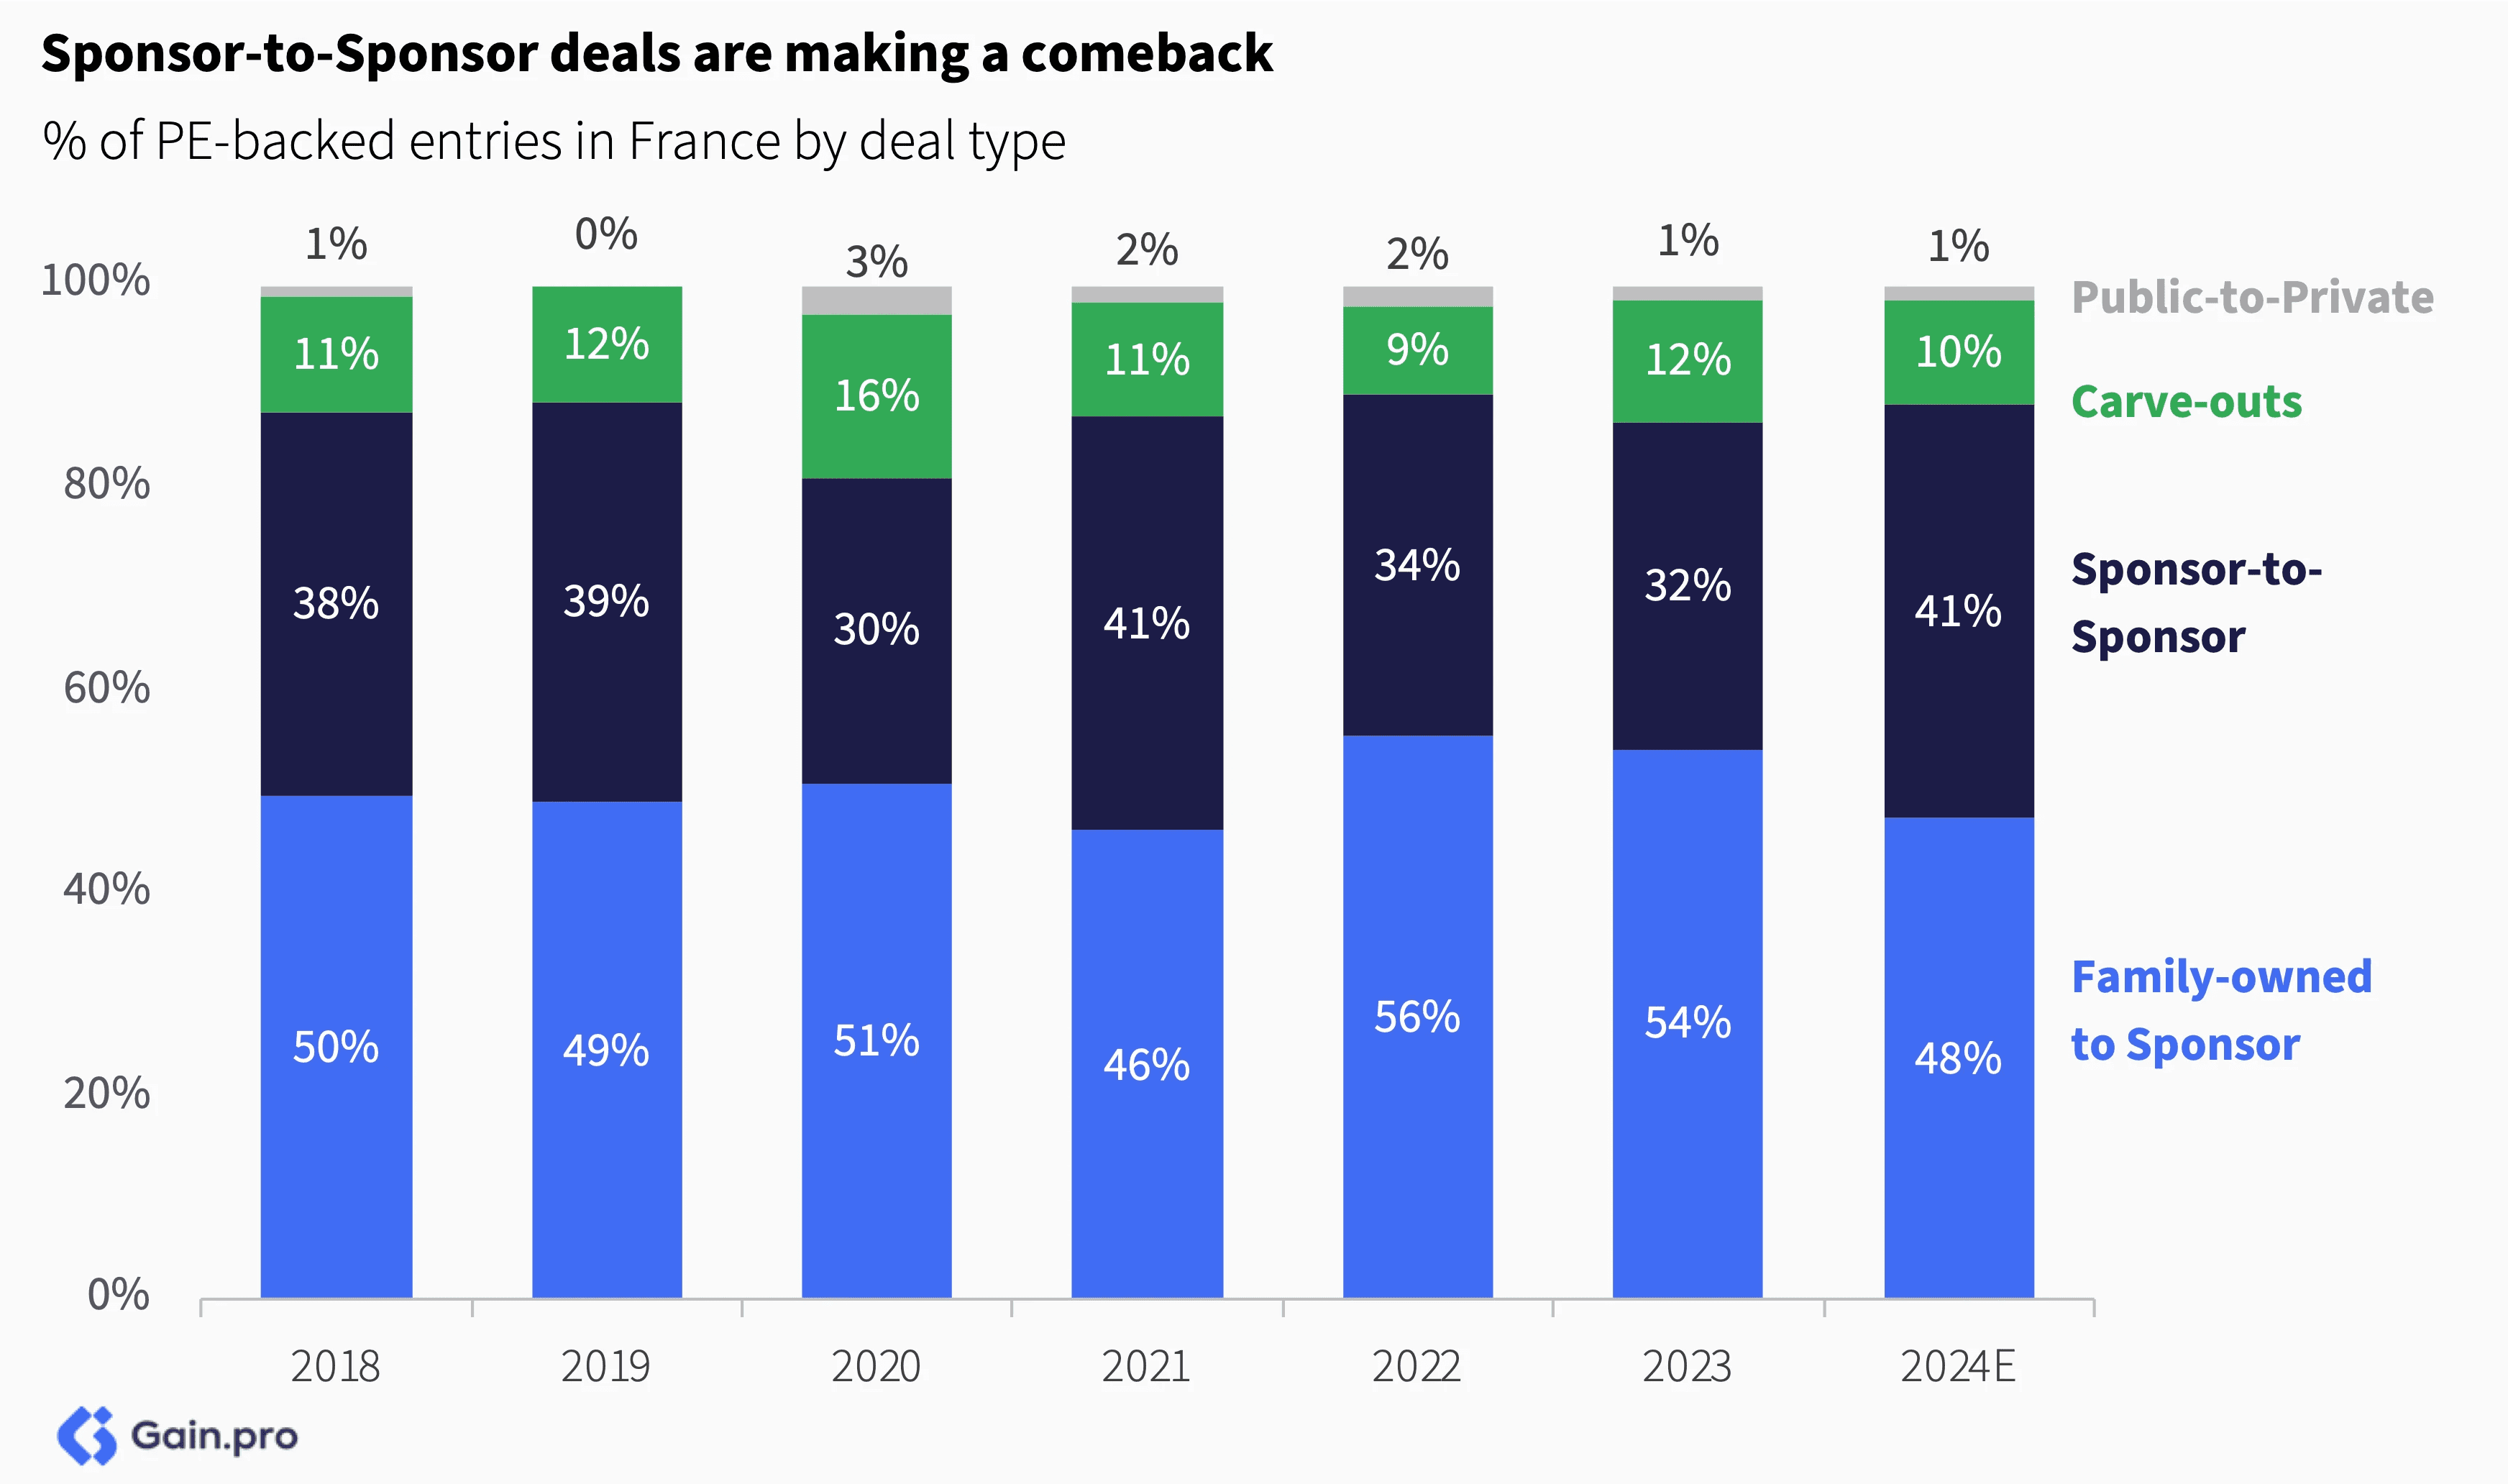
As for deal activity by type, Sponsor-to-Sponsor deals are coming back. Their share is up from 32% in 2023 to 41% in 2024. For deals with EBITDA >€10m, their share was even higher (57%).
Sector Trends
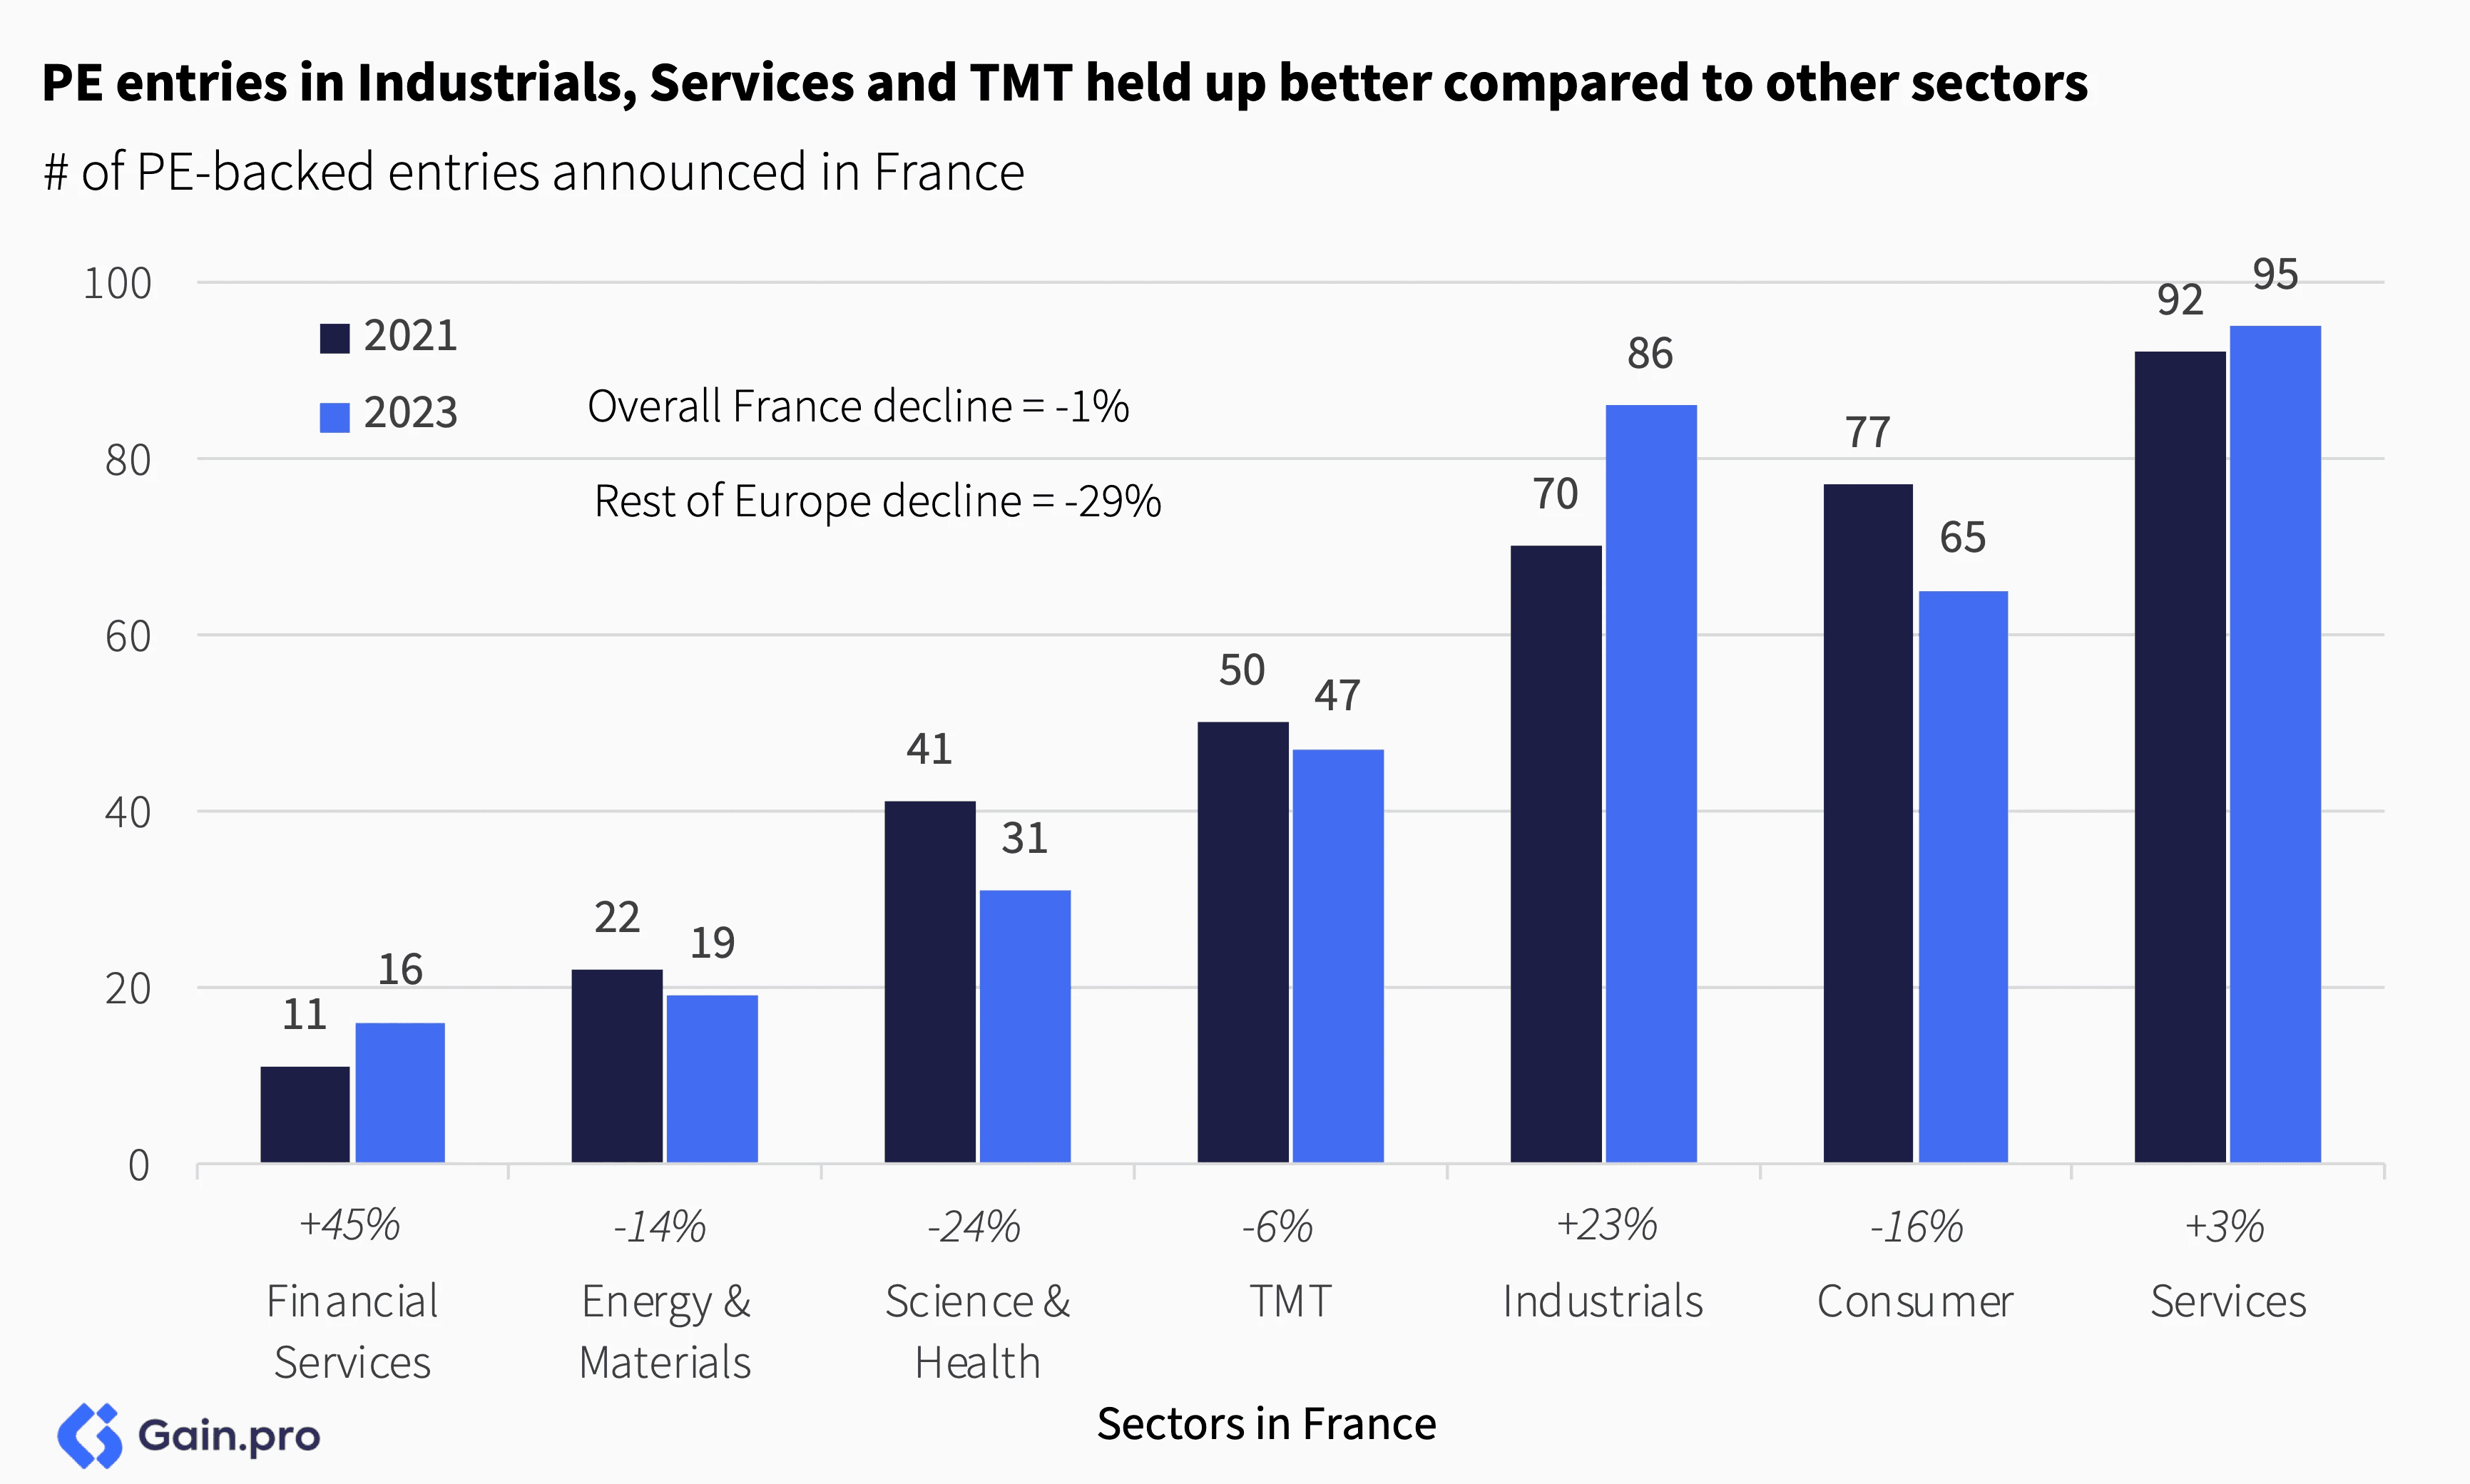
By sector, PE entries in Industrials, Services and TMT held up better. Entries were up 23% in Industrials, 3% in Services and down just 6% in TMT. Overall, French PE entry count fared better compared to the Rest of Europe (down -1% vs. -29% for the Rest of Europe).
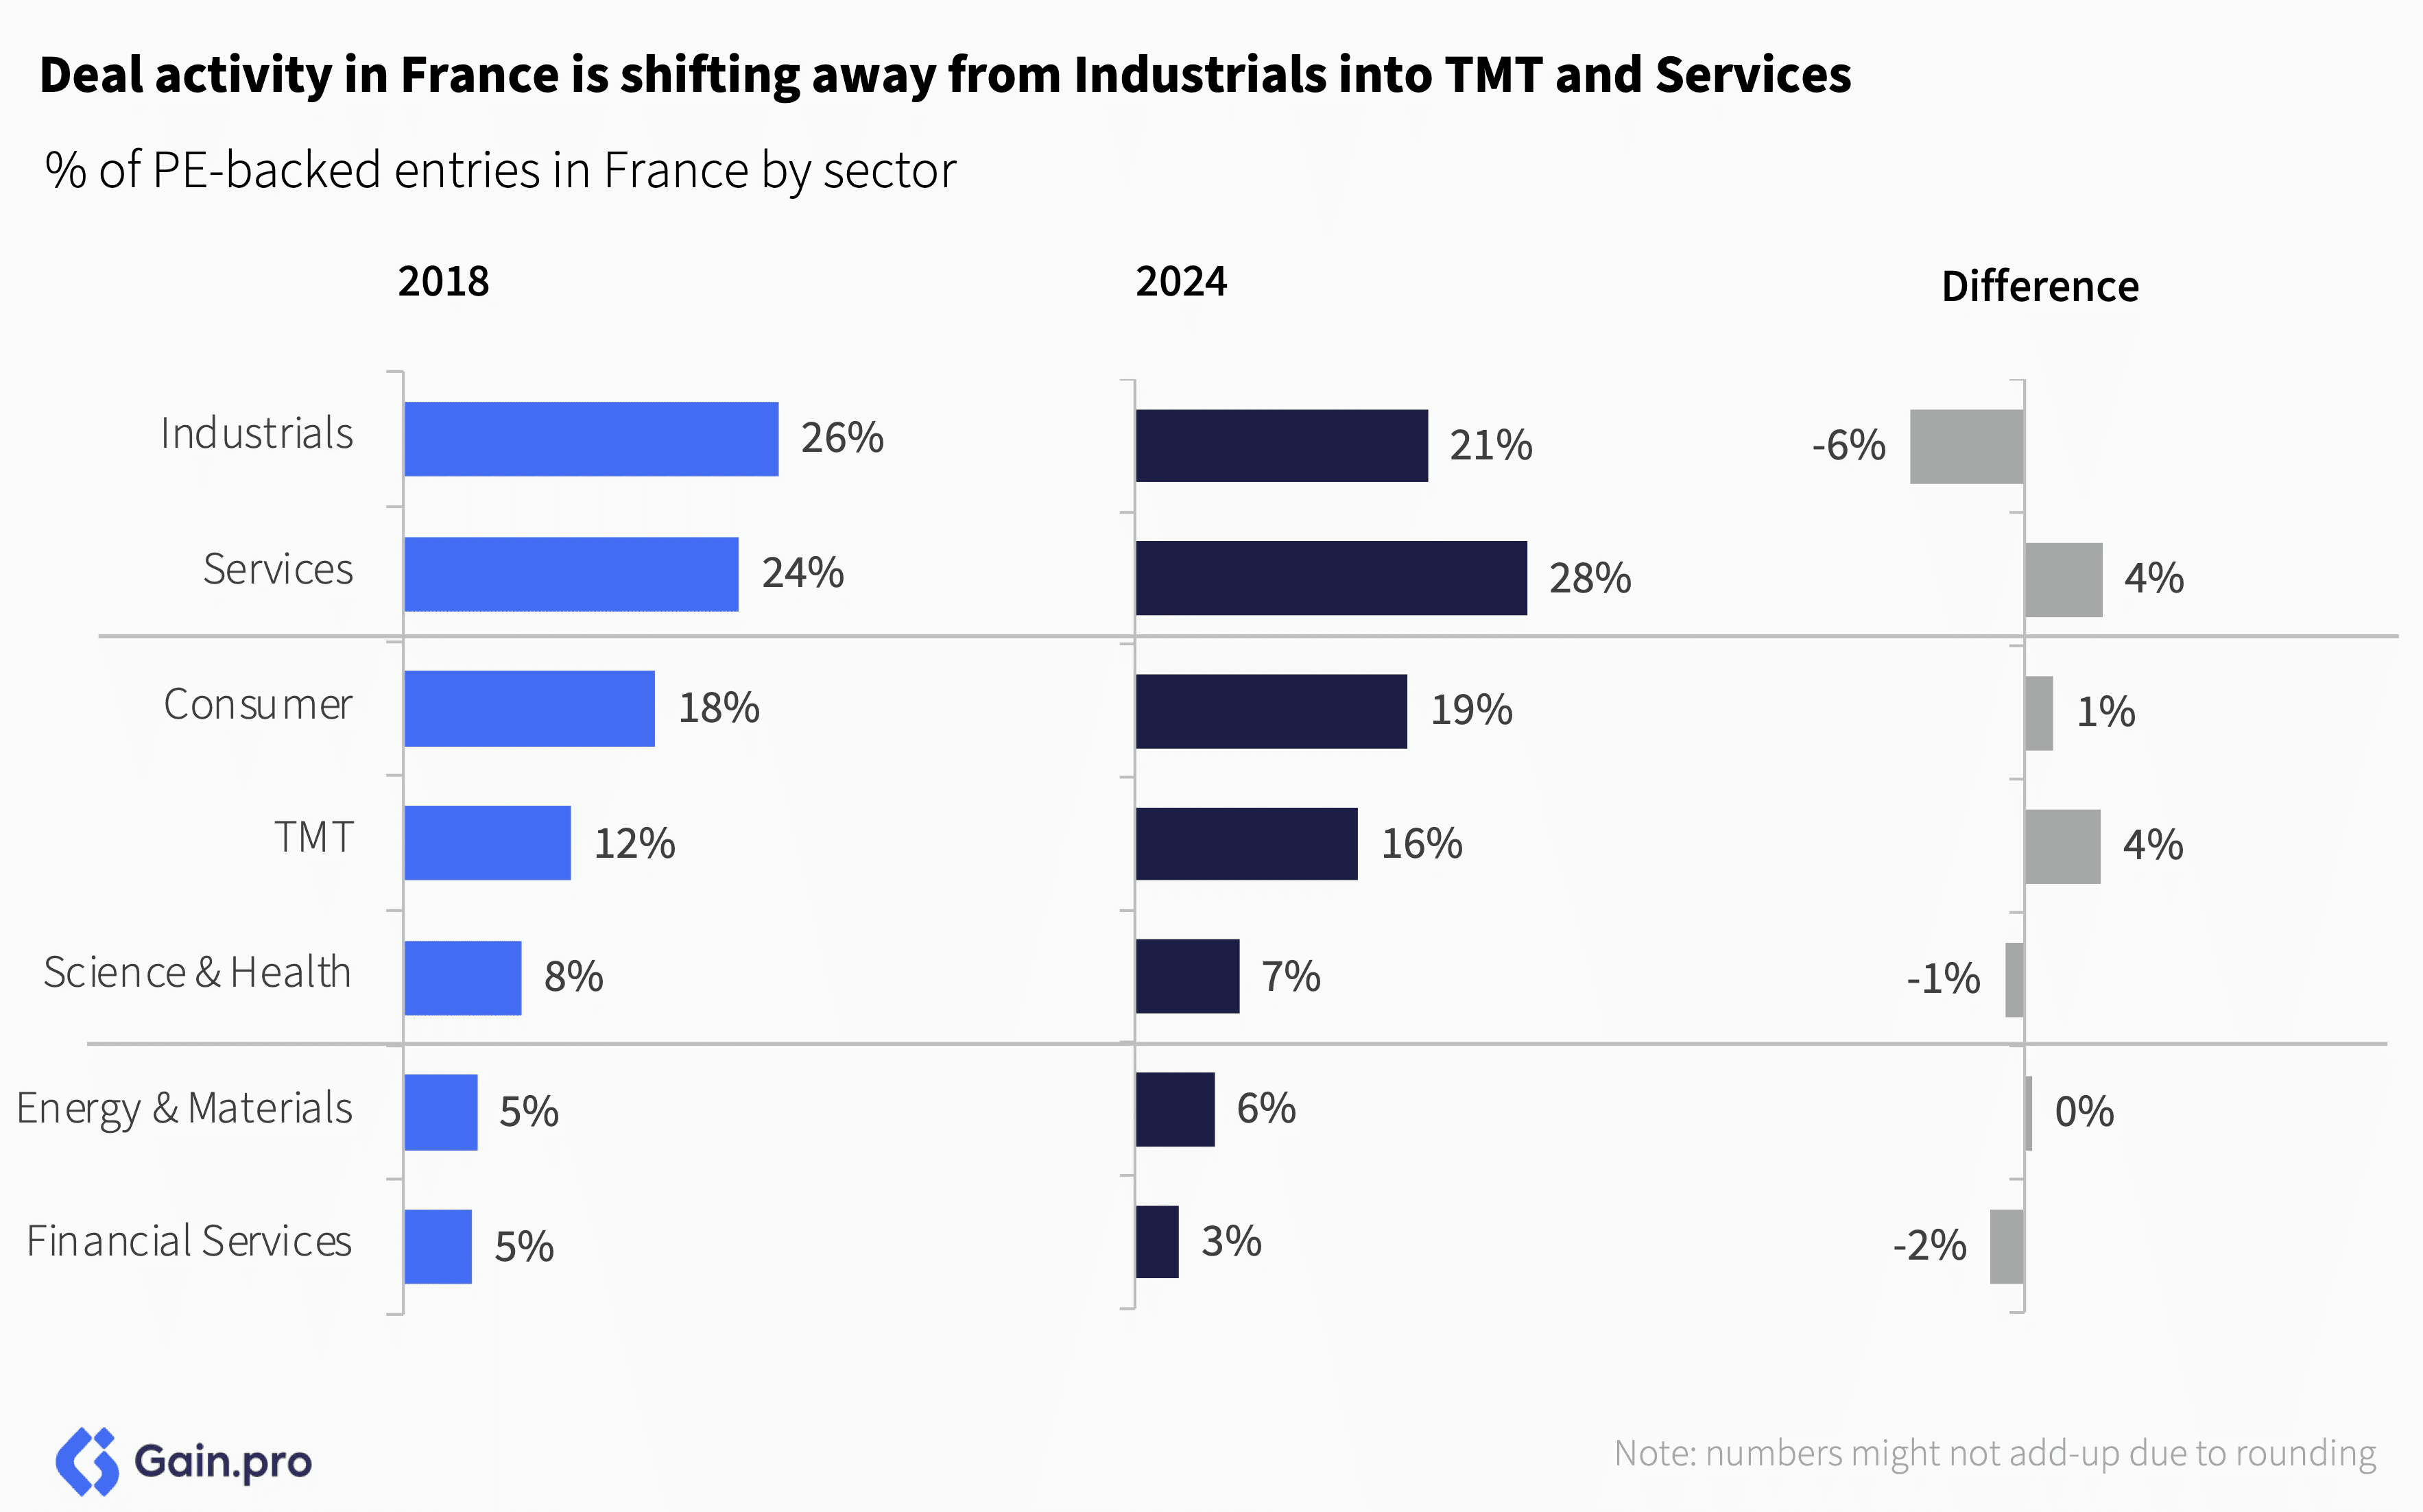
Over the longer term, the share of Industrials entries is declining, with TMT and Services gaining share. The share of Consumer entries has also seen an uptick – a trend in contrast to the Rest of Europe, driven by France's attractive fashion, retail and other well-performing consumer brand industries.
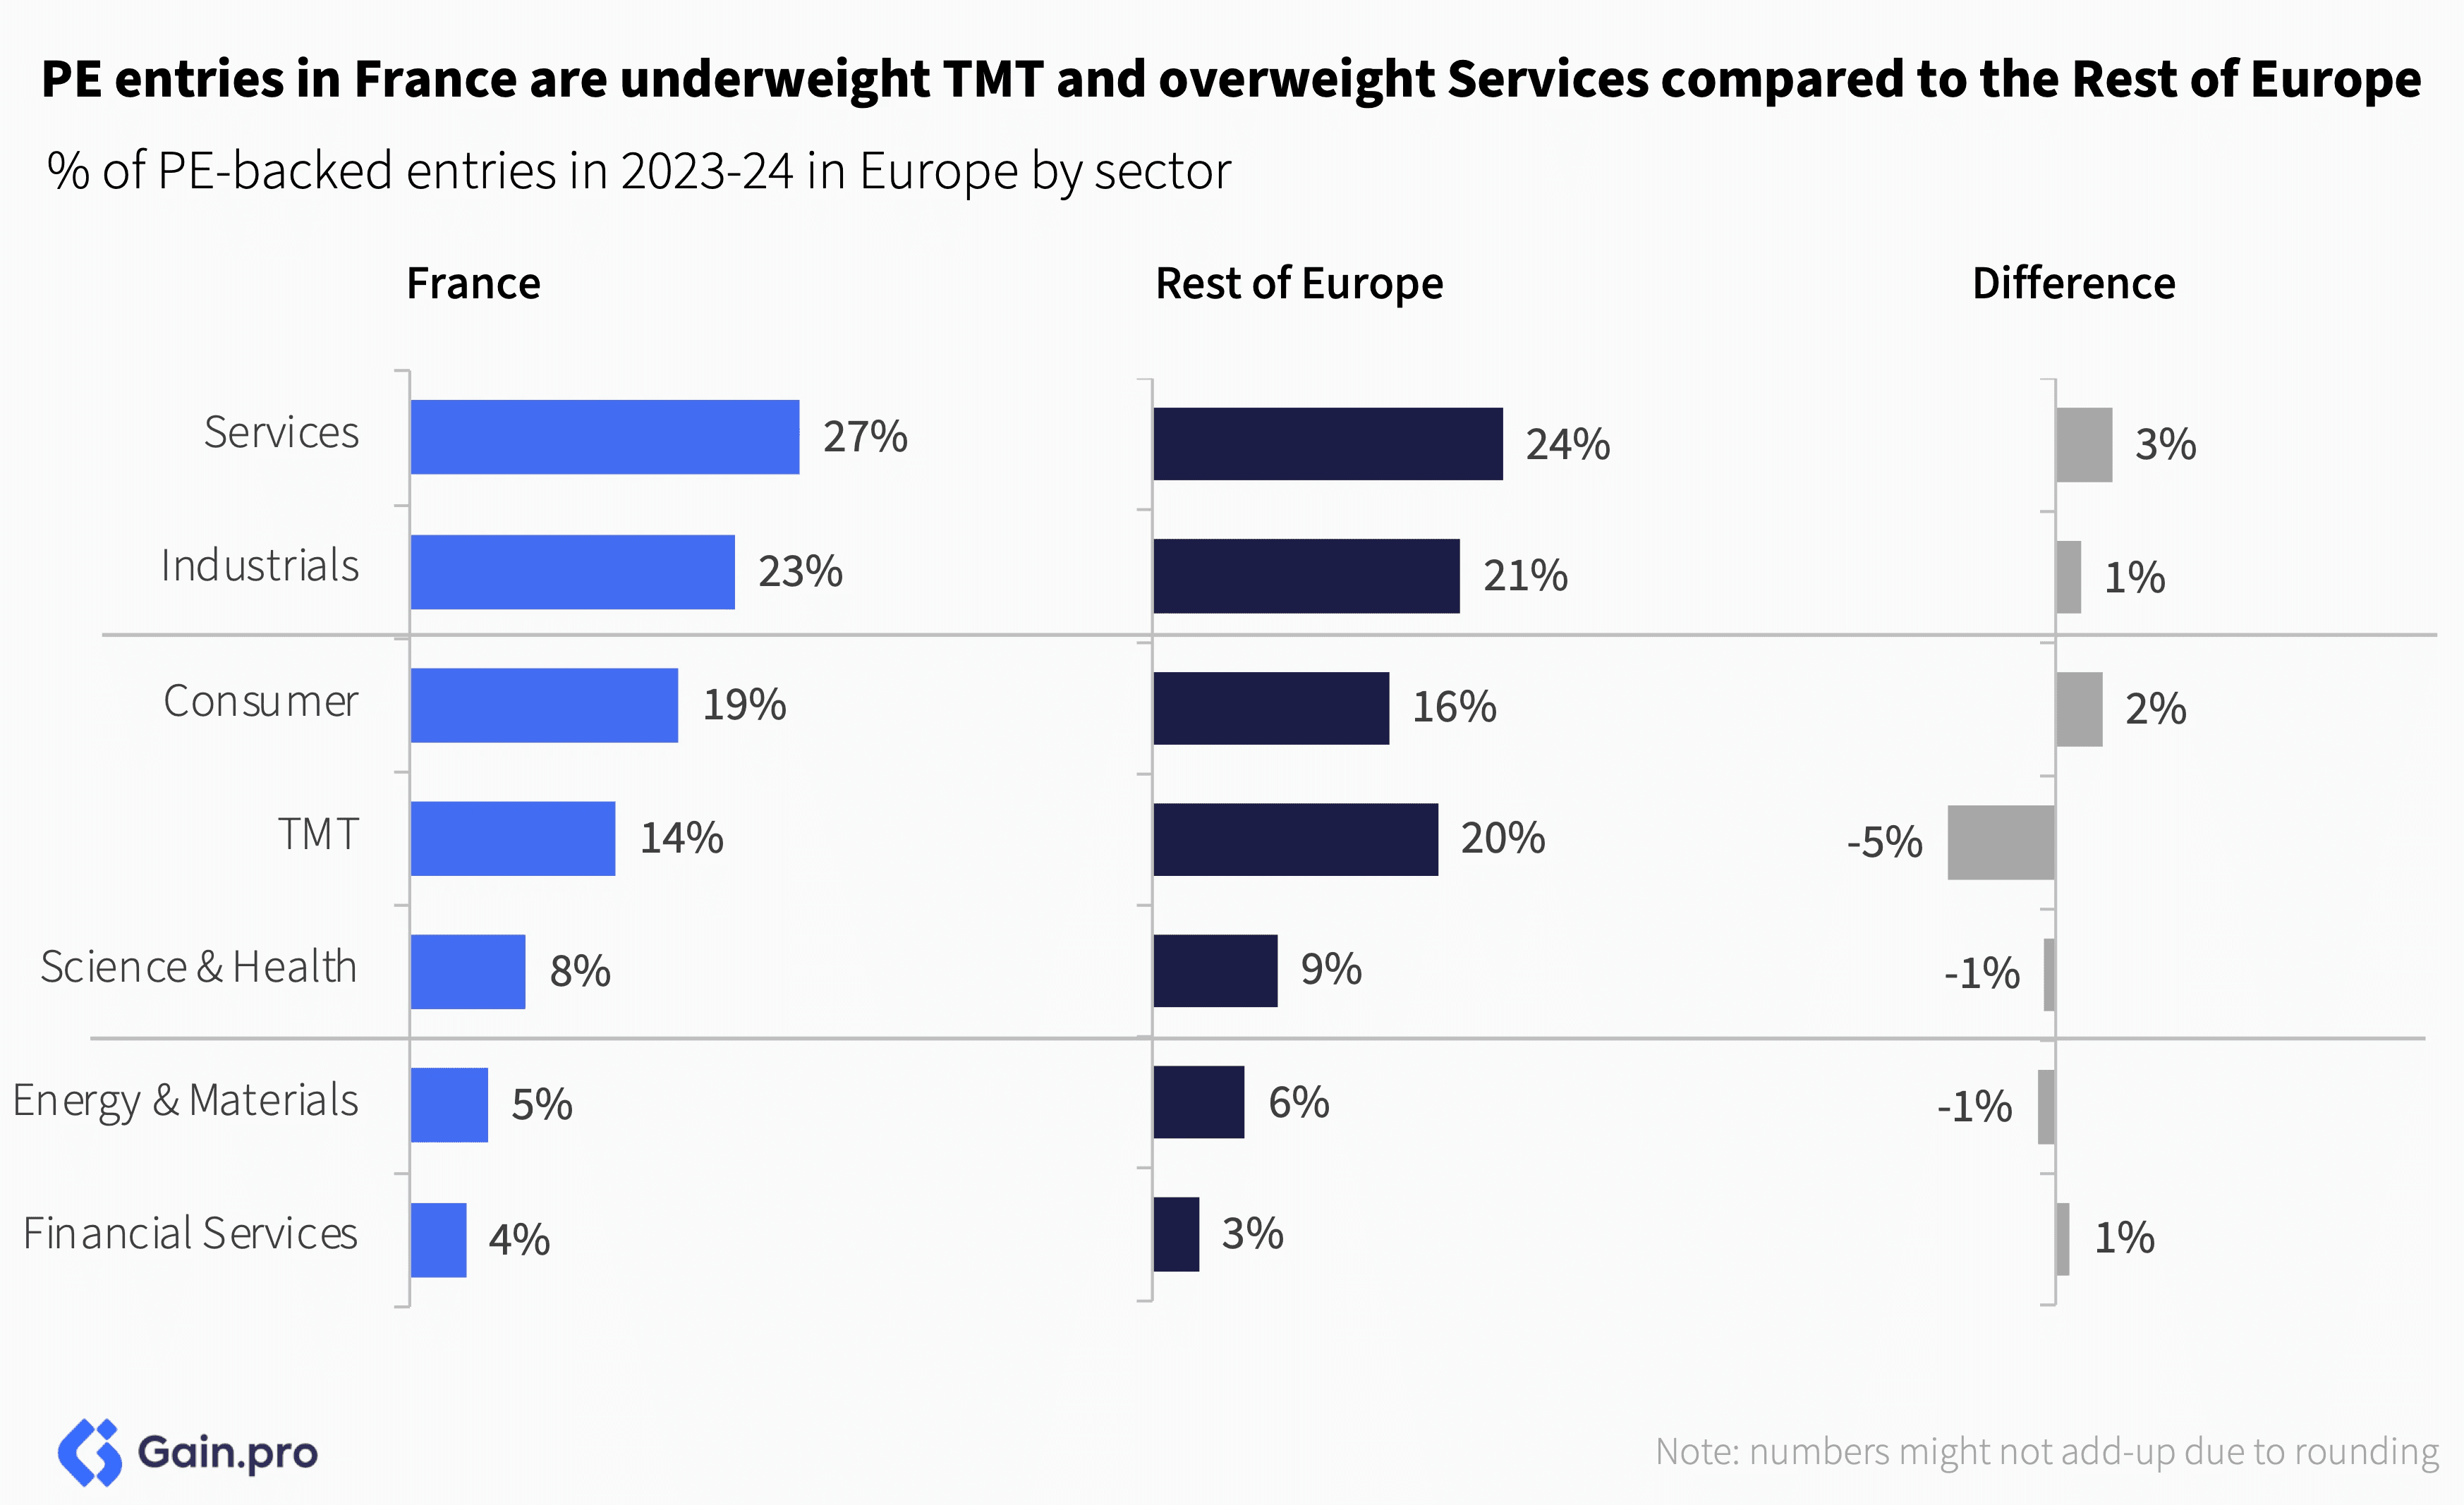
Even after the recent shift in deal activity, France notably remains underweight TMT (-5%). France also remains overweight in the Services (+3%) and Consumer (+2%) sectors compared to the Rest of Europe.
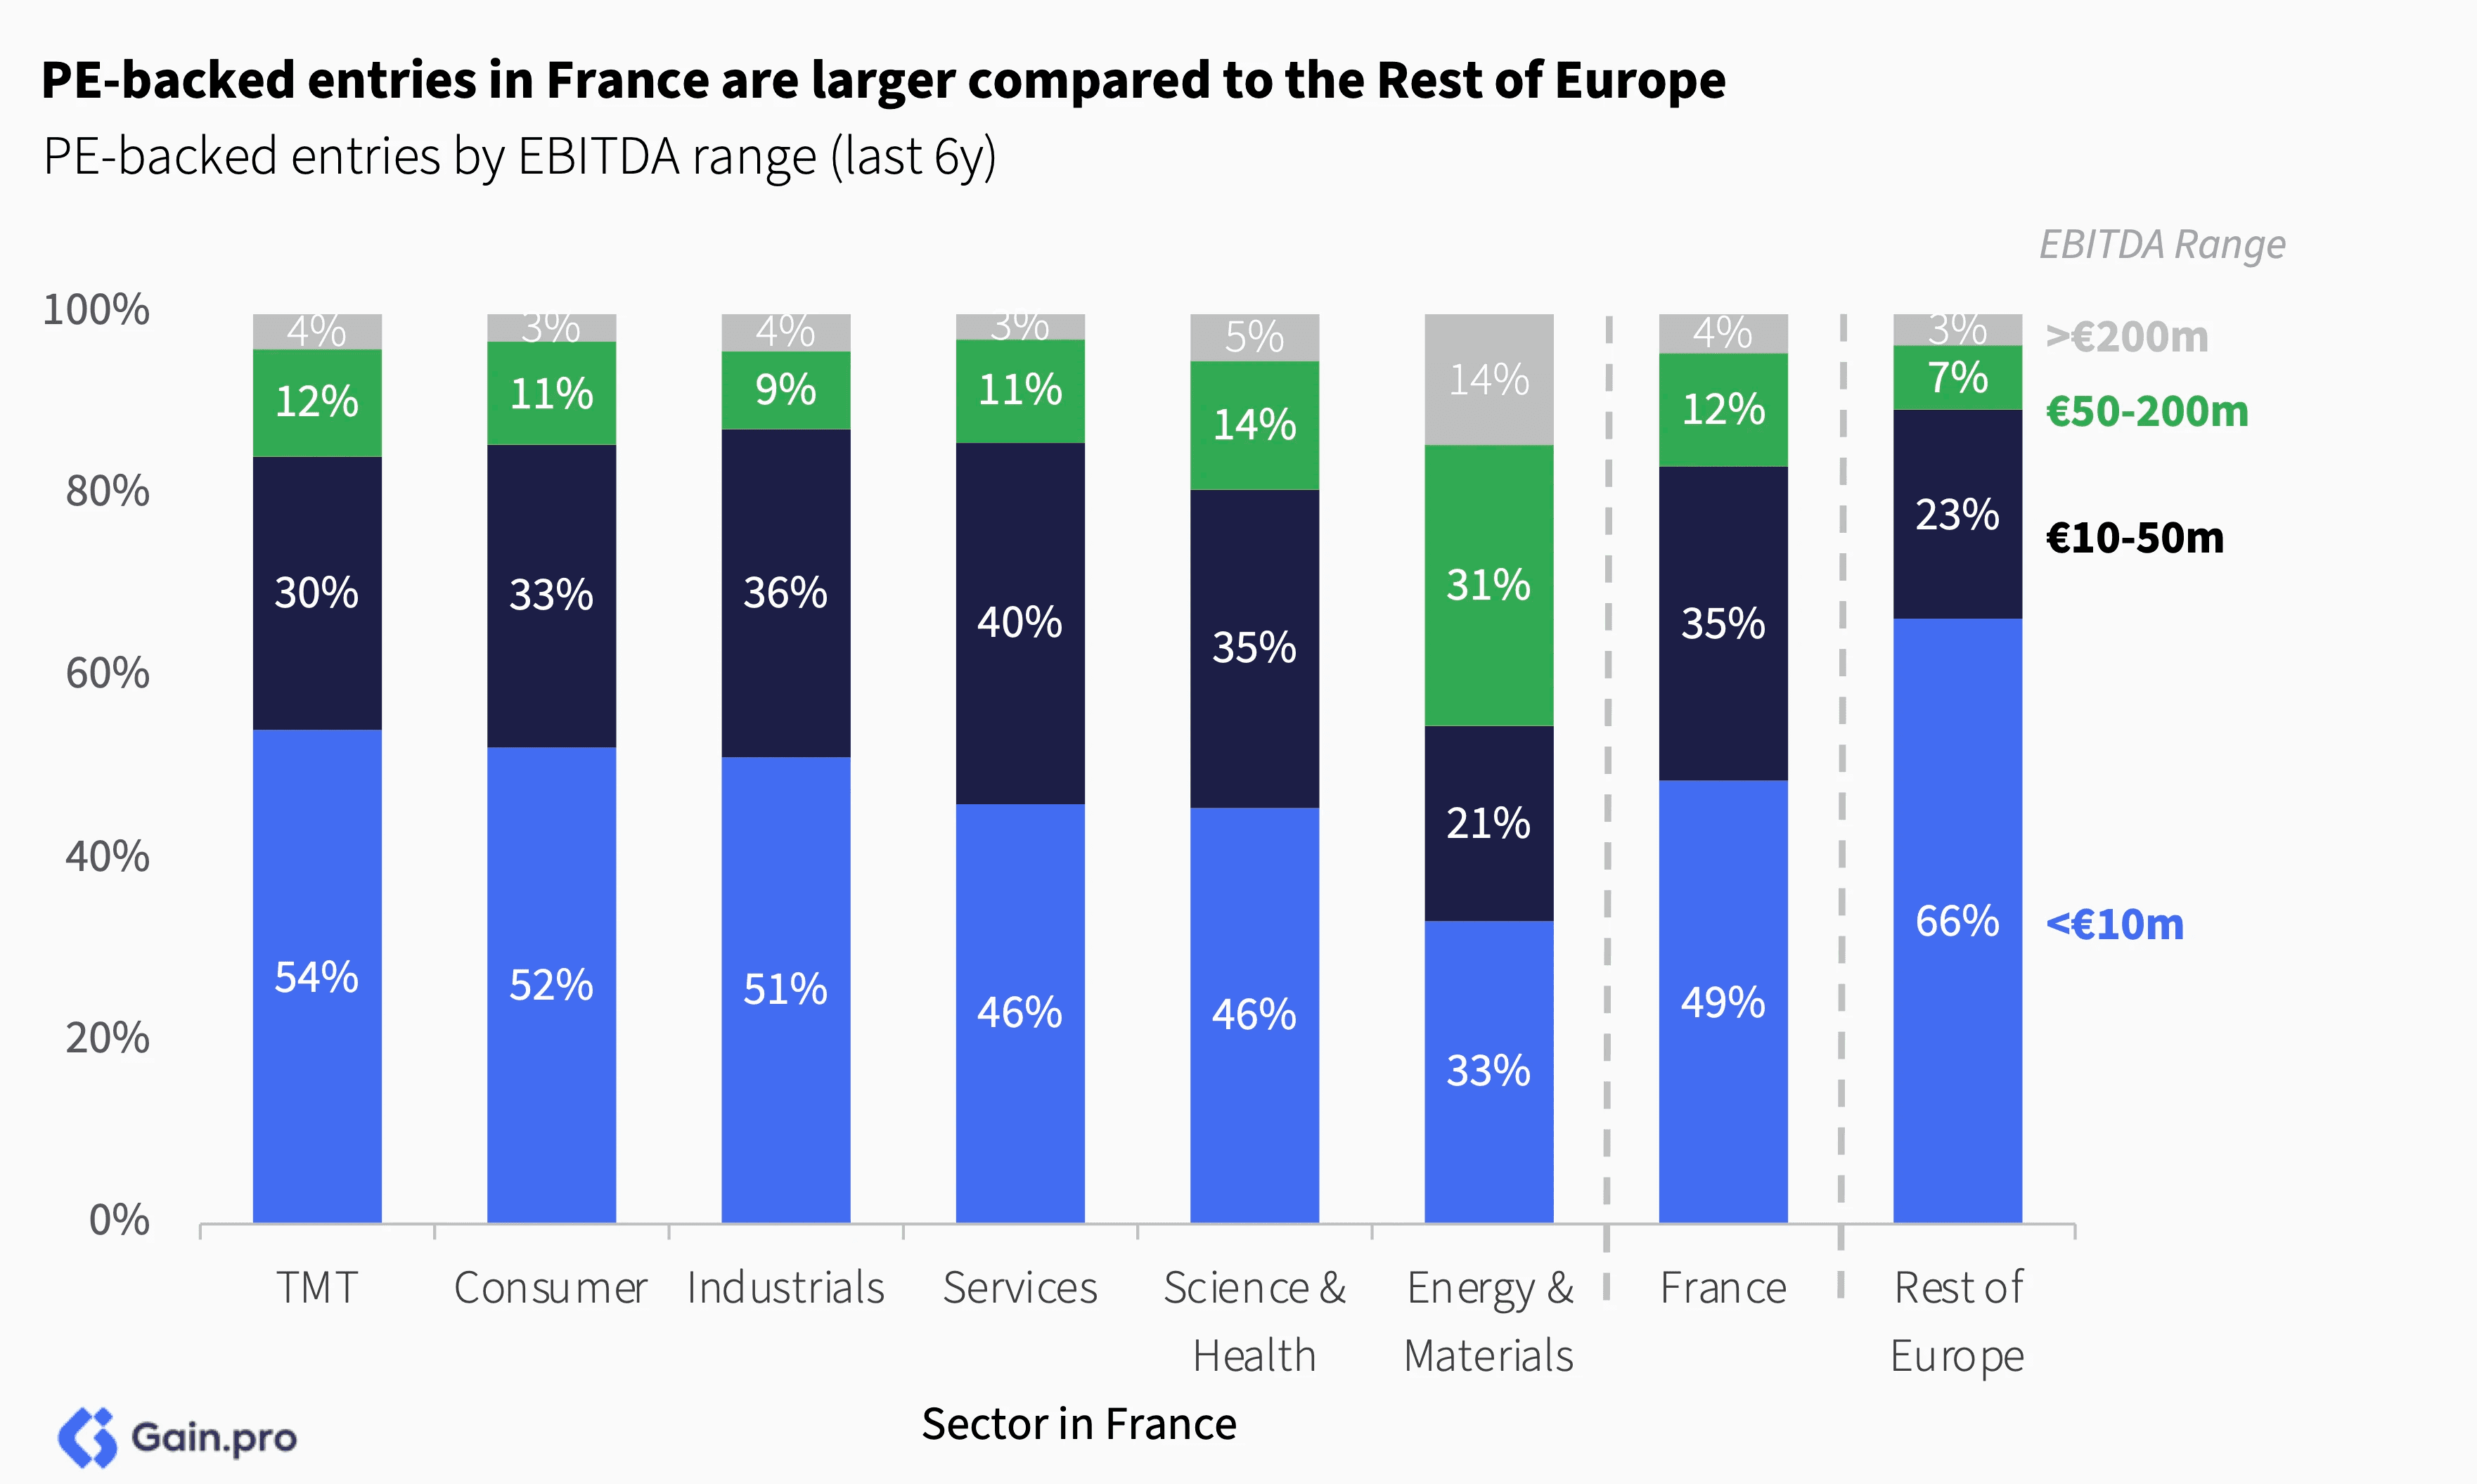
As for size, PE-backed entries in France are larger compared to the Rest of Europe. 51% of PE entries in France were of those with EBITDA >€10m (vs. 34% for the Rest of Europe). Entry size was smallest in TMT and largest in Energy & Materials.
Minority vs. Majority Deals
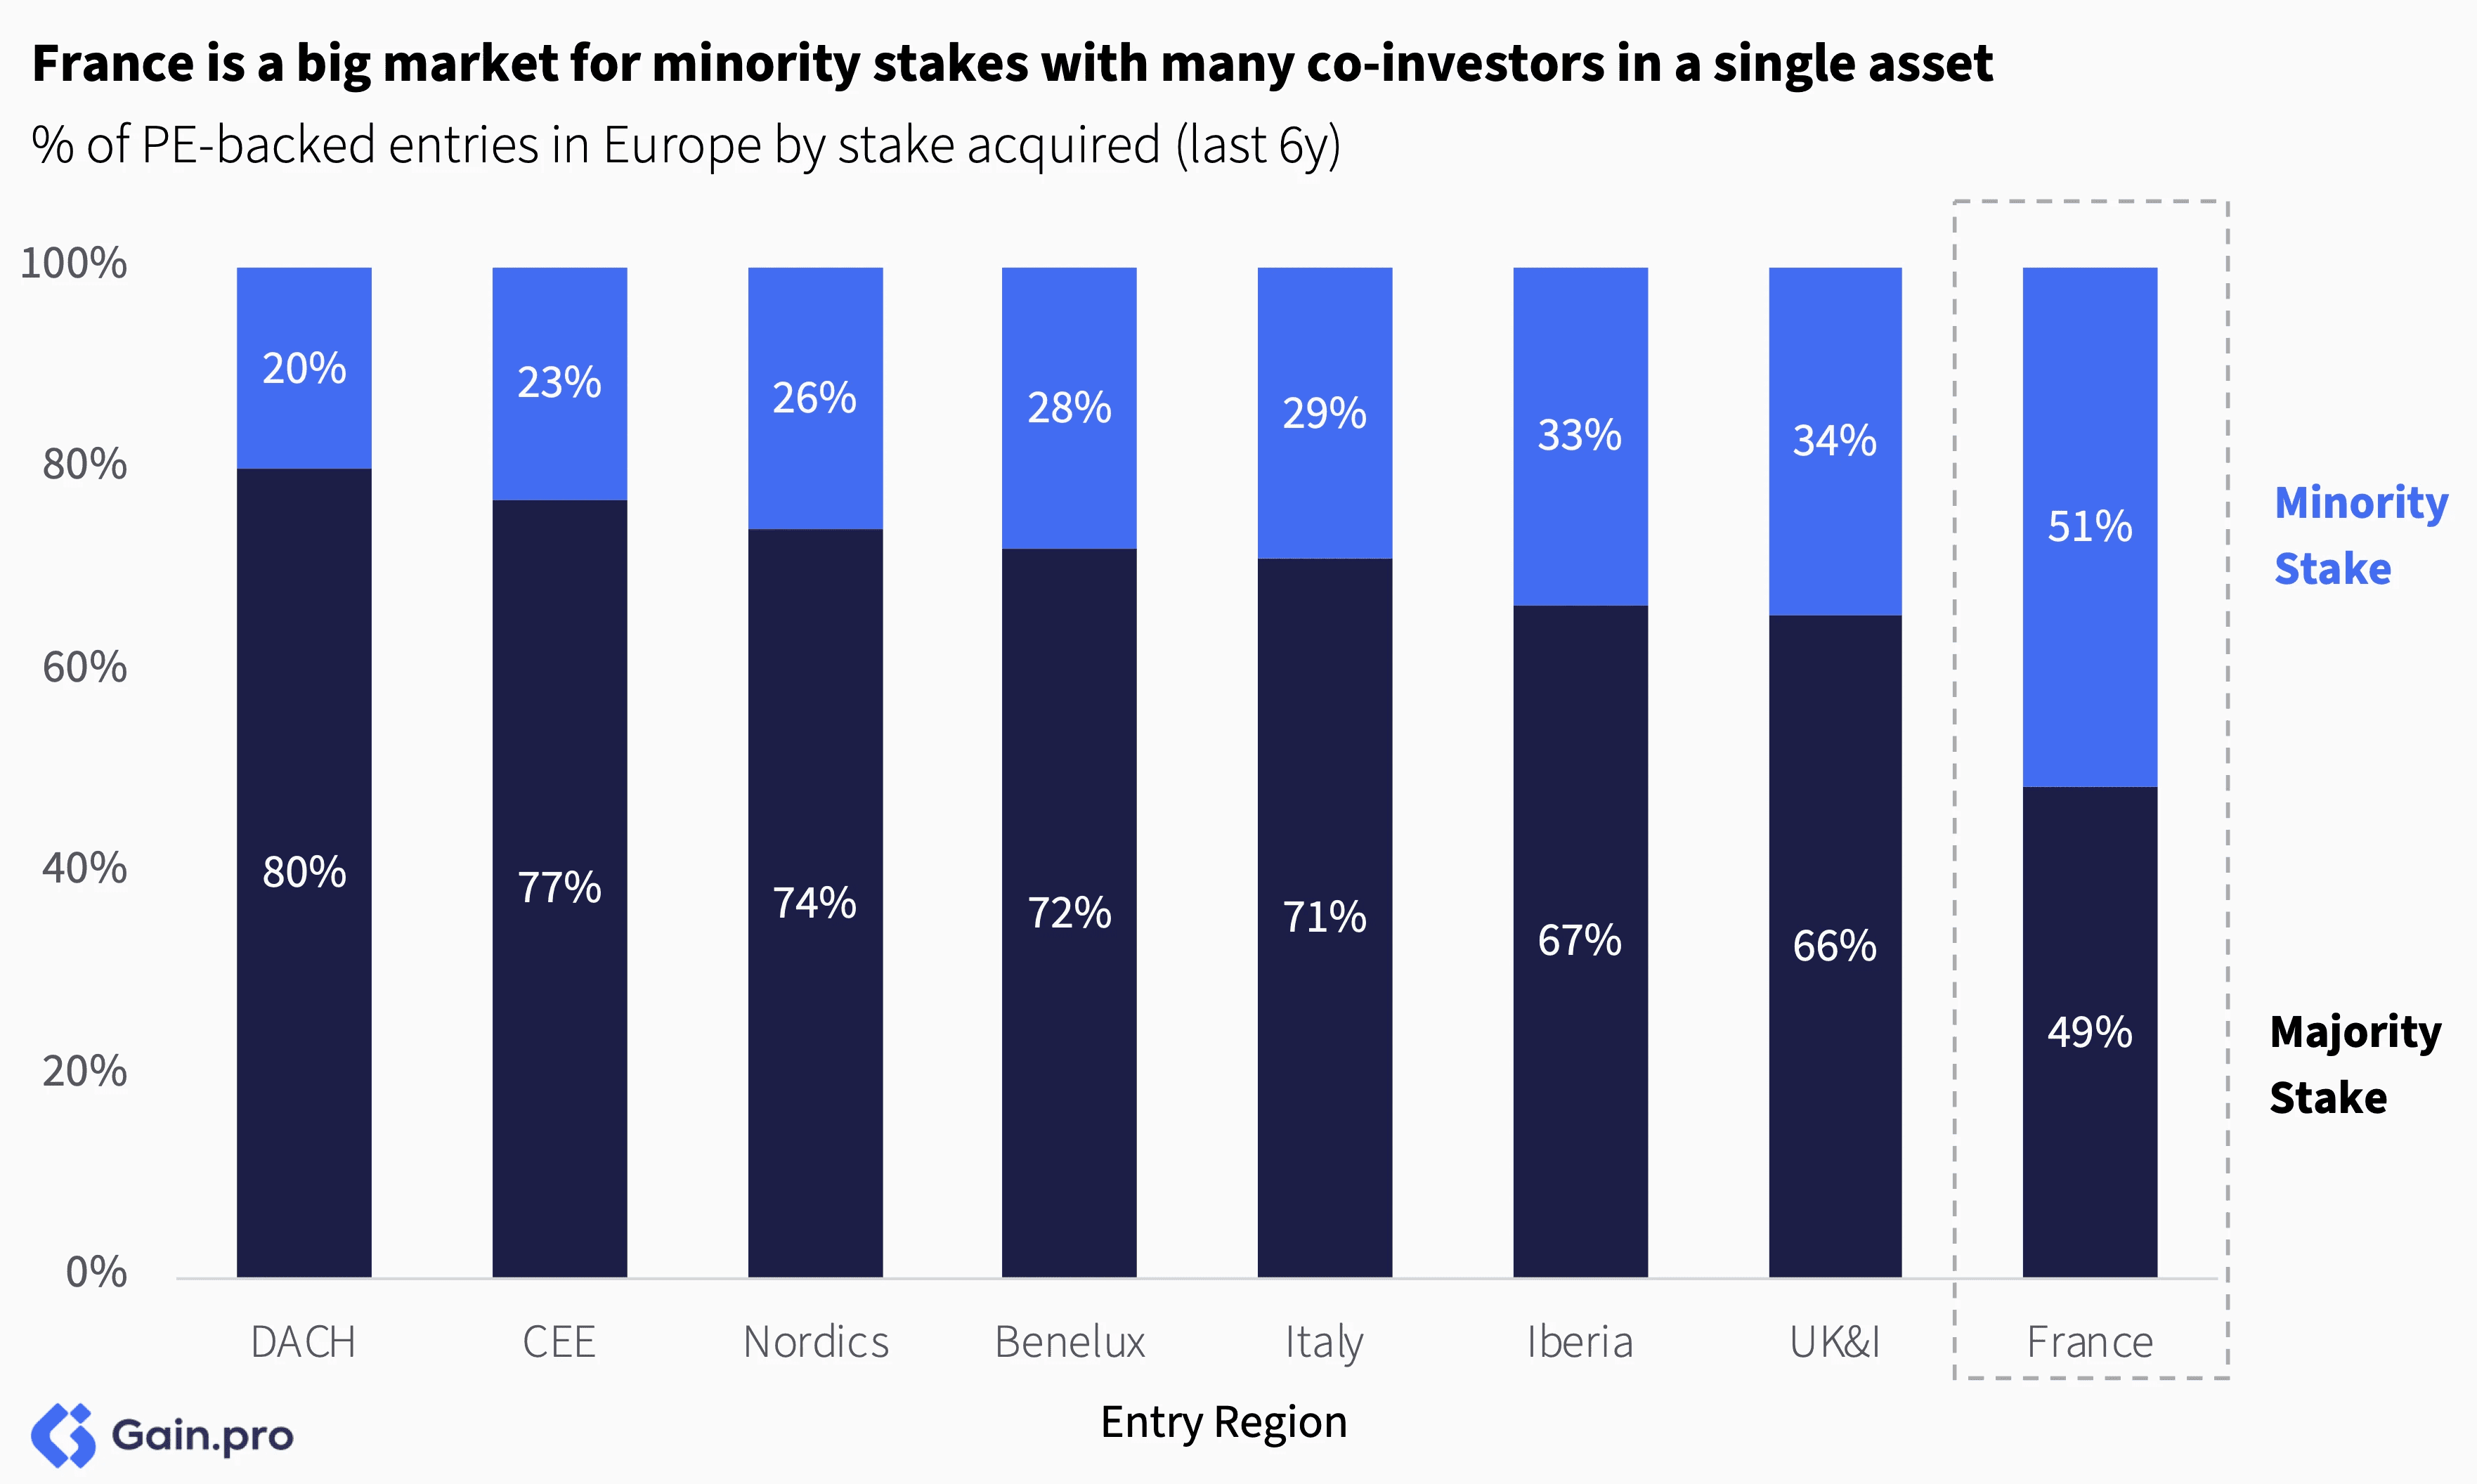
France is a big market for minority stakes with many co-investors in a single asset.51% of PE-backed entries in France were minority stakes (compared to just 20% in DACH, 28% in Benelux and 34% in UK).
Buy-and-Build
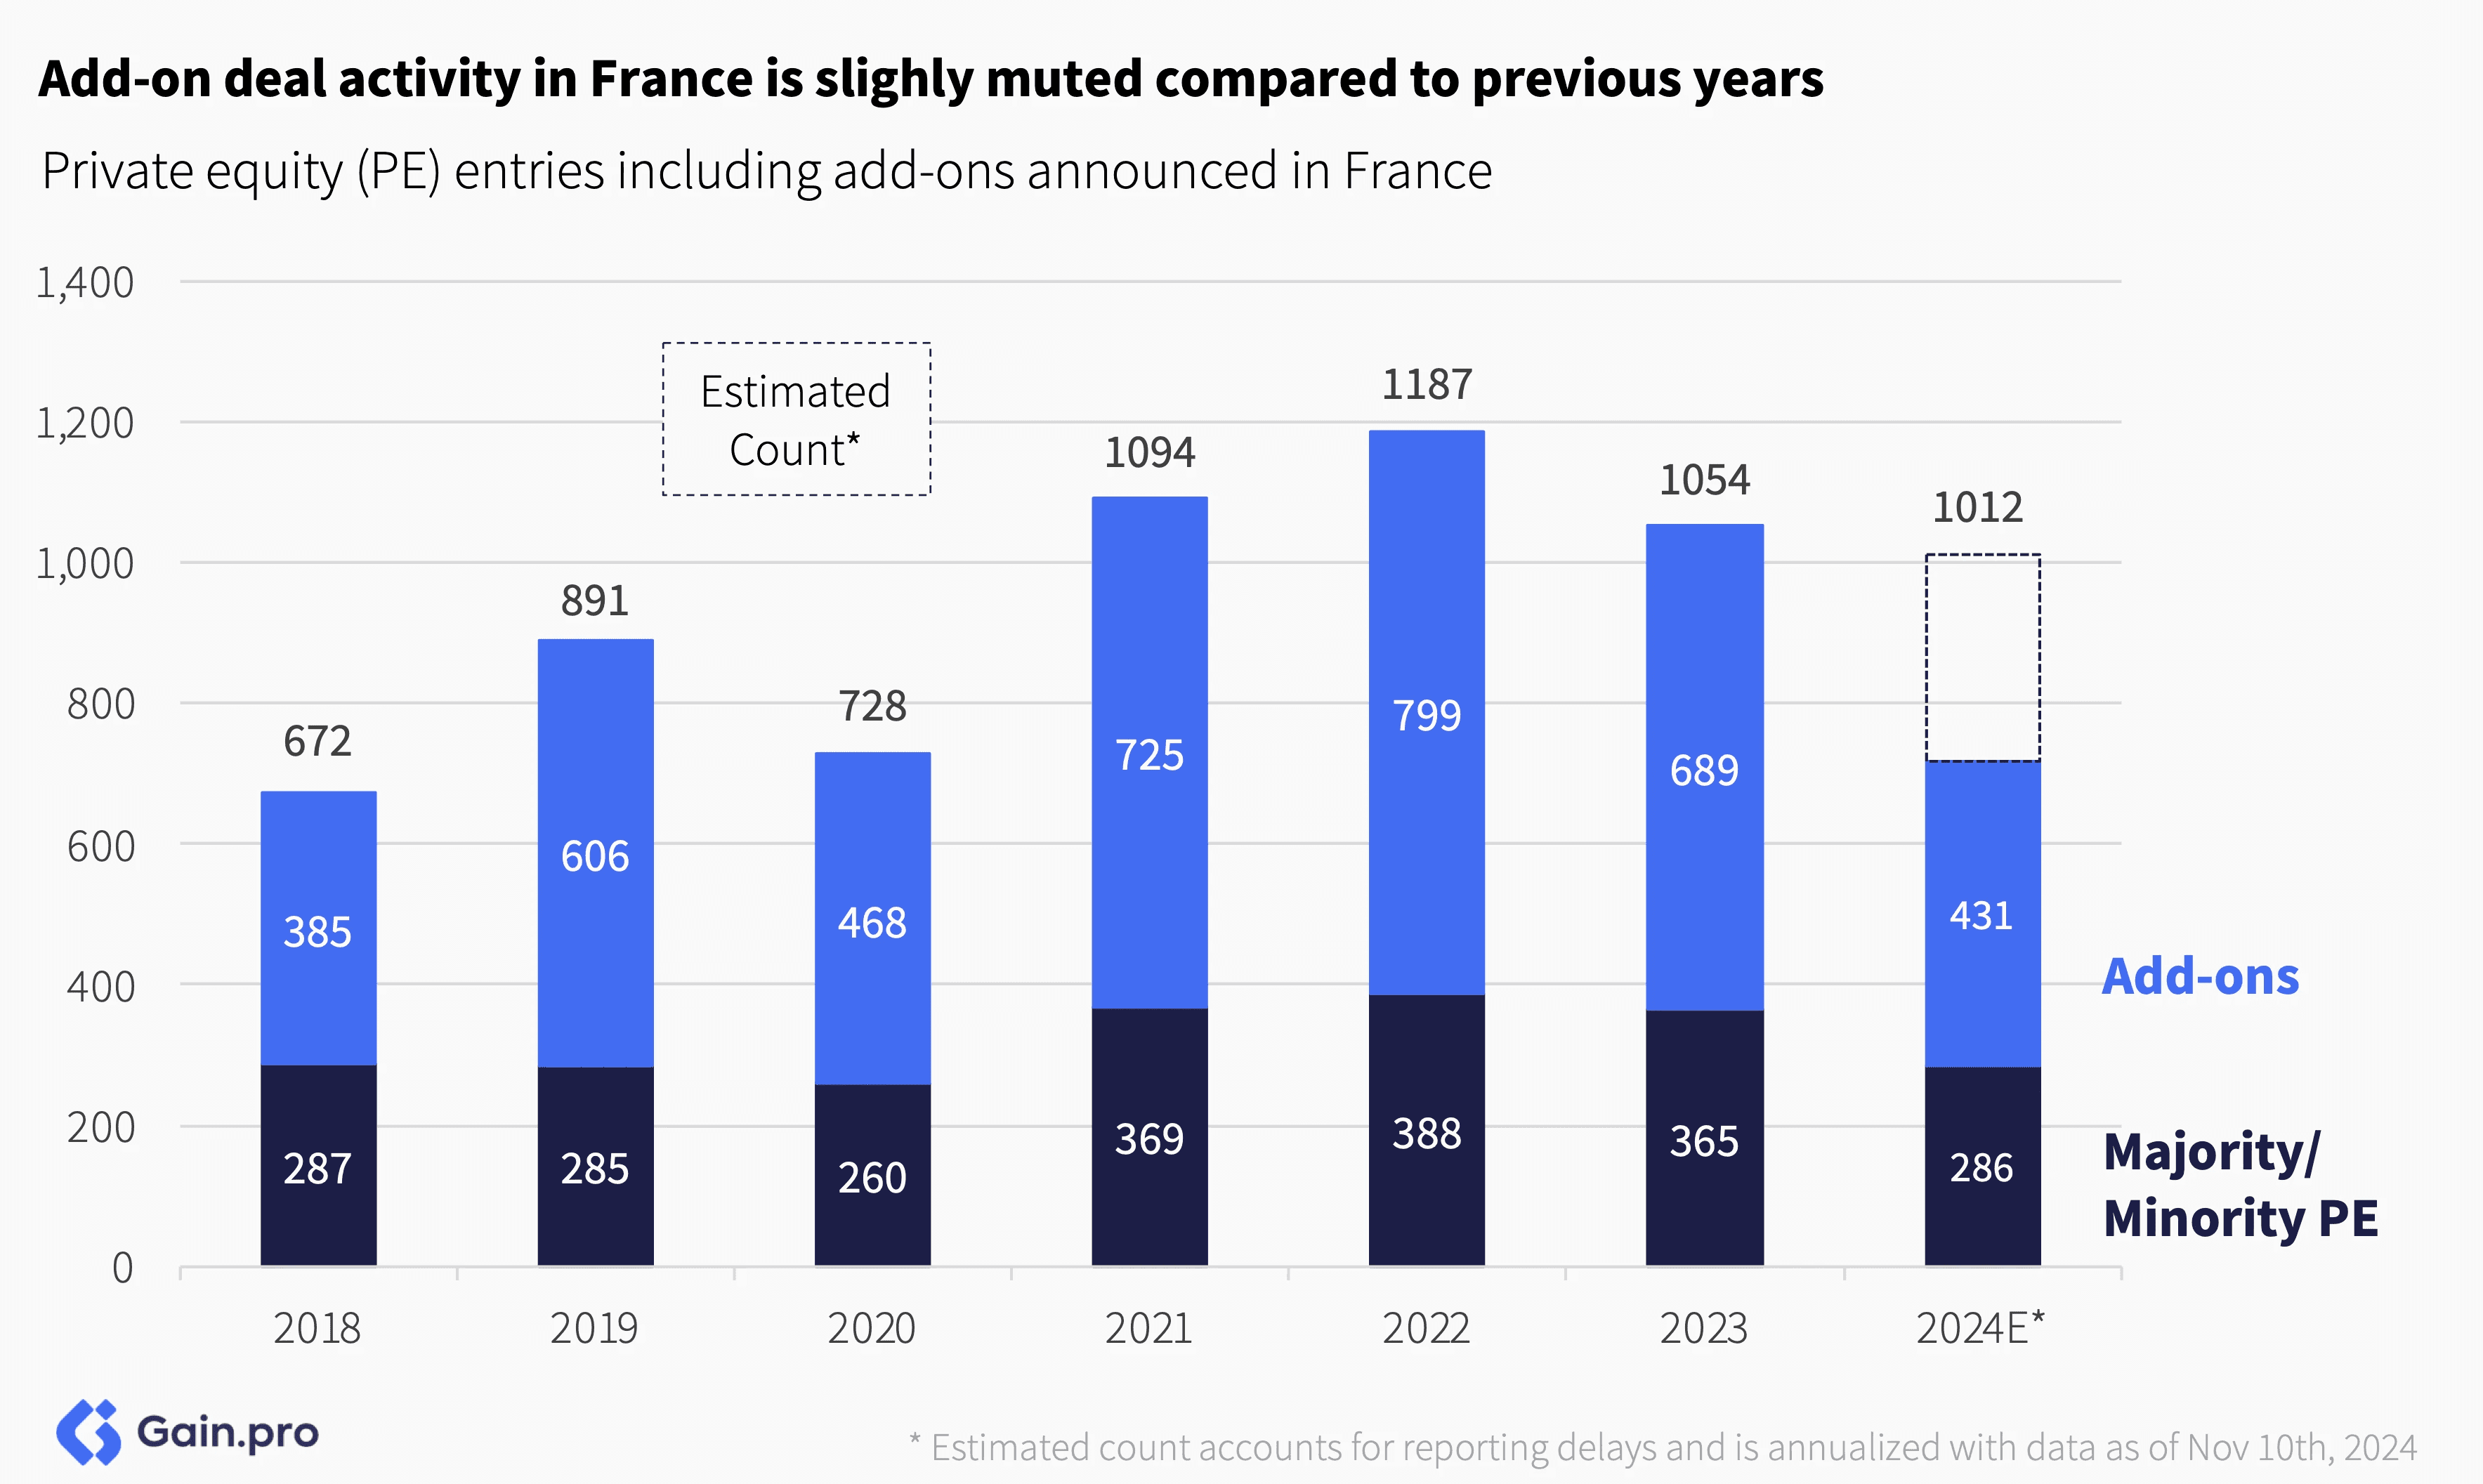
Add-on deal activity in France is slightly muted compared to previous years. Even after estimating for reporting delays and annualizing the data, we expect add-on activity levels to be down ~12% yoy.
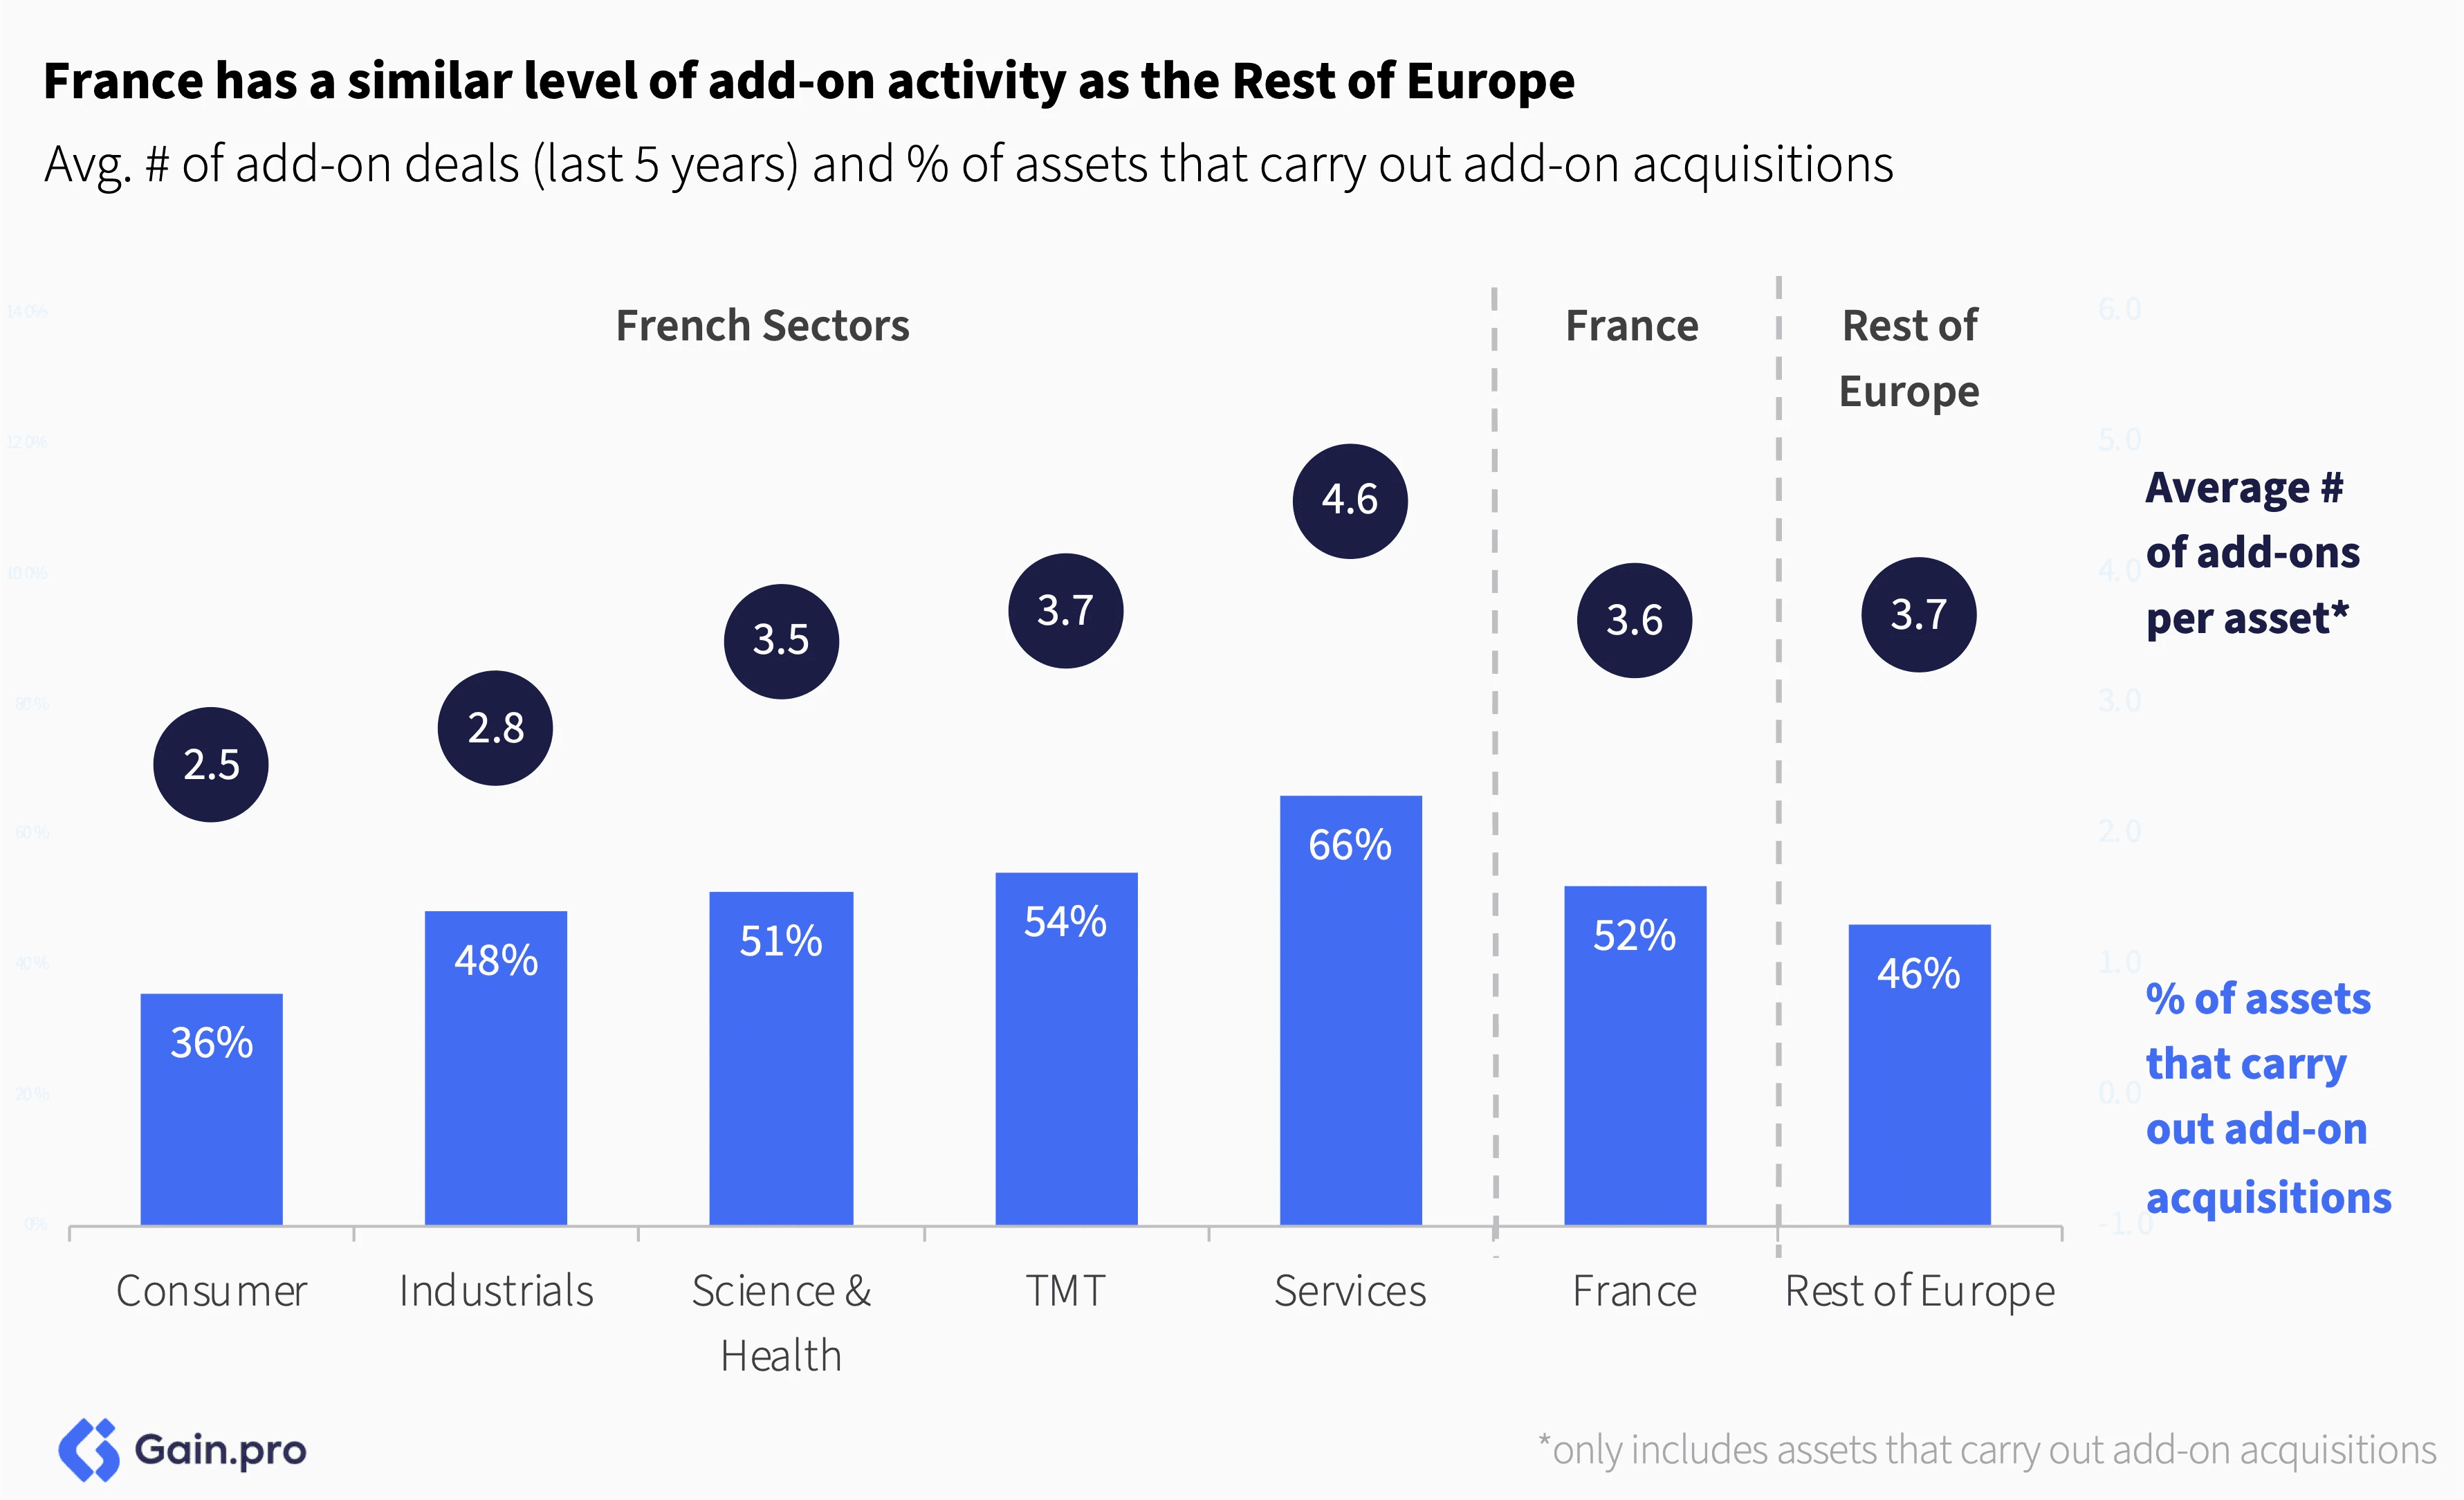
France has a similar level of add-on activity compared to the Rest of Europe. On average, 52% of French PE assets carry out add-on acquisitions. By sector, Services, TMT and Industrials are the most active sectors for buy-and-build, accounting for 42%, 19% and 17% of deals, respectively.
Chapter 02: Exits
Overall PE Exits
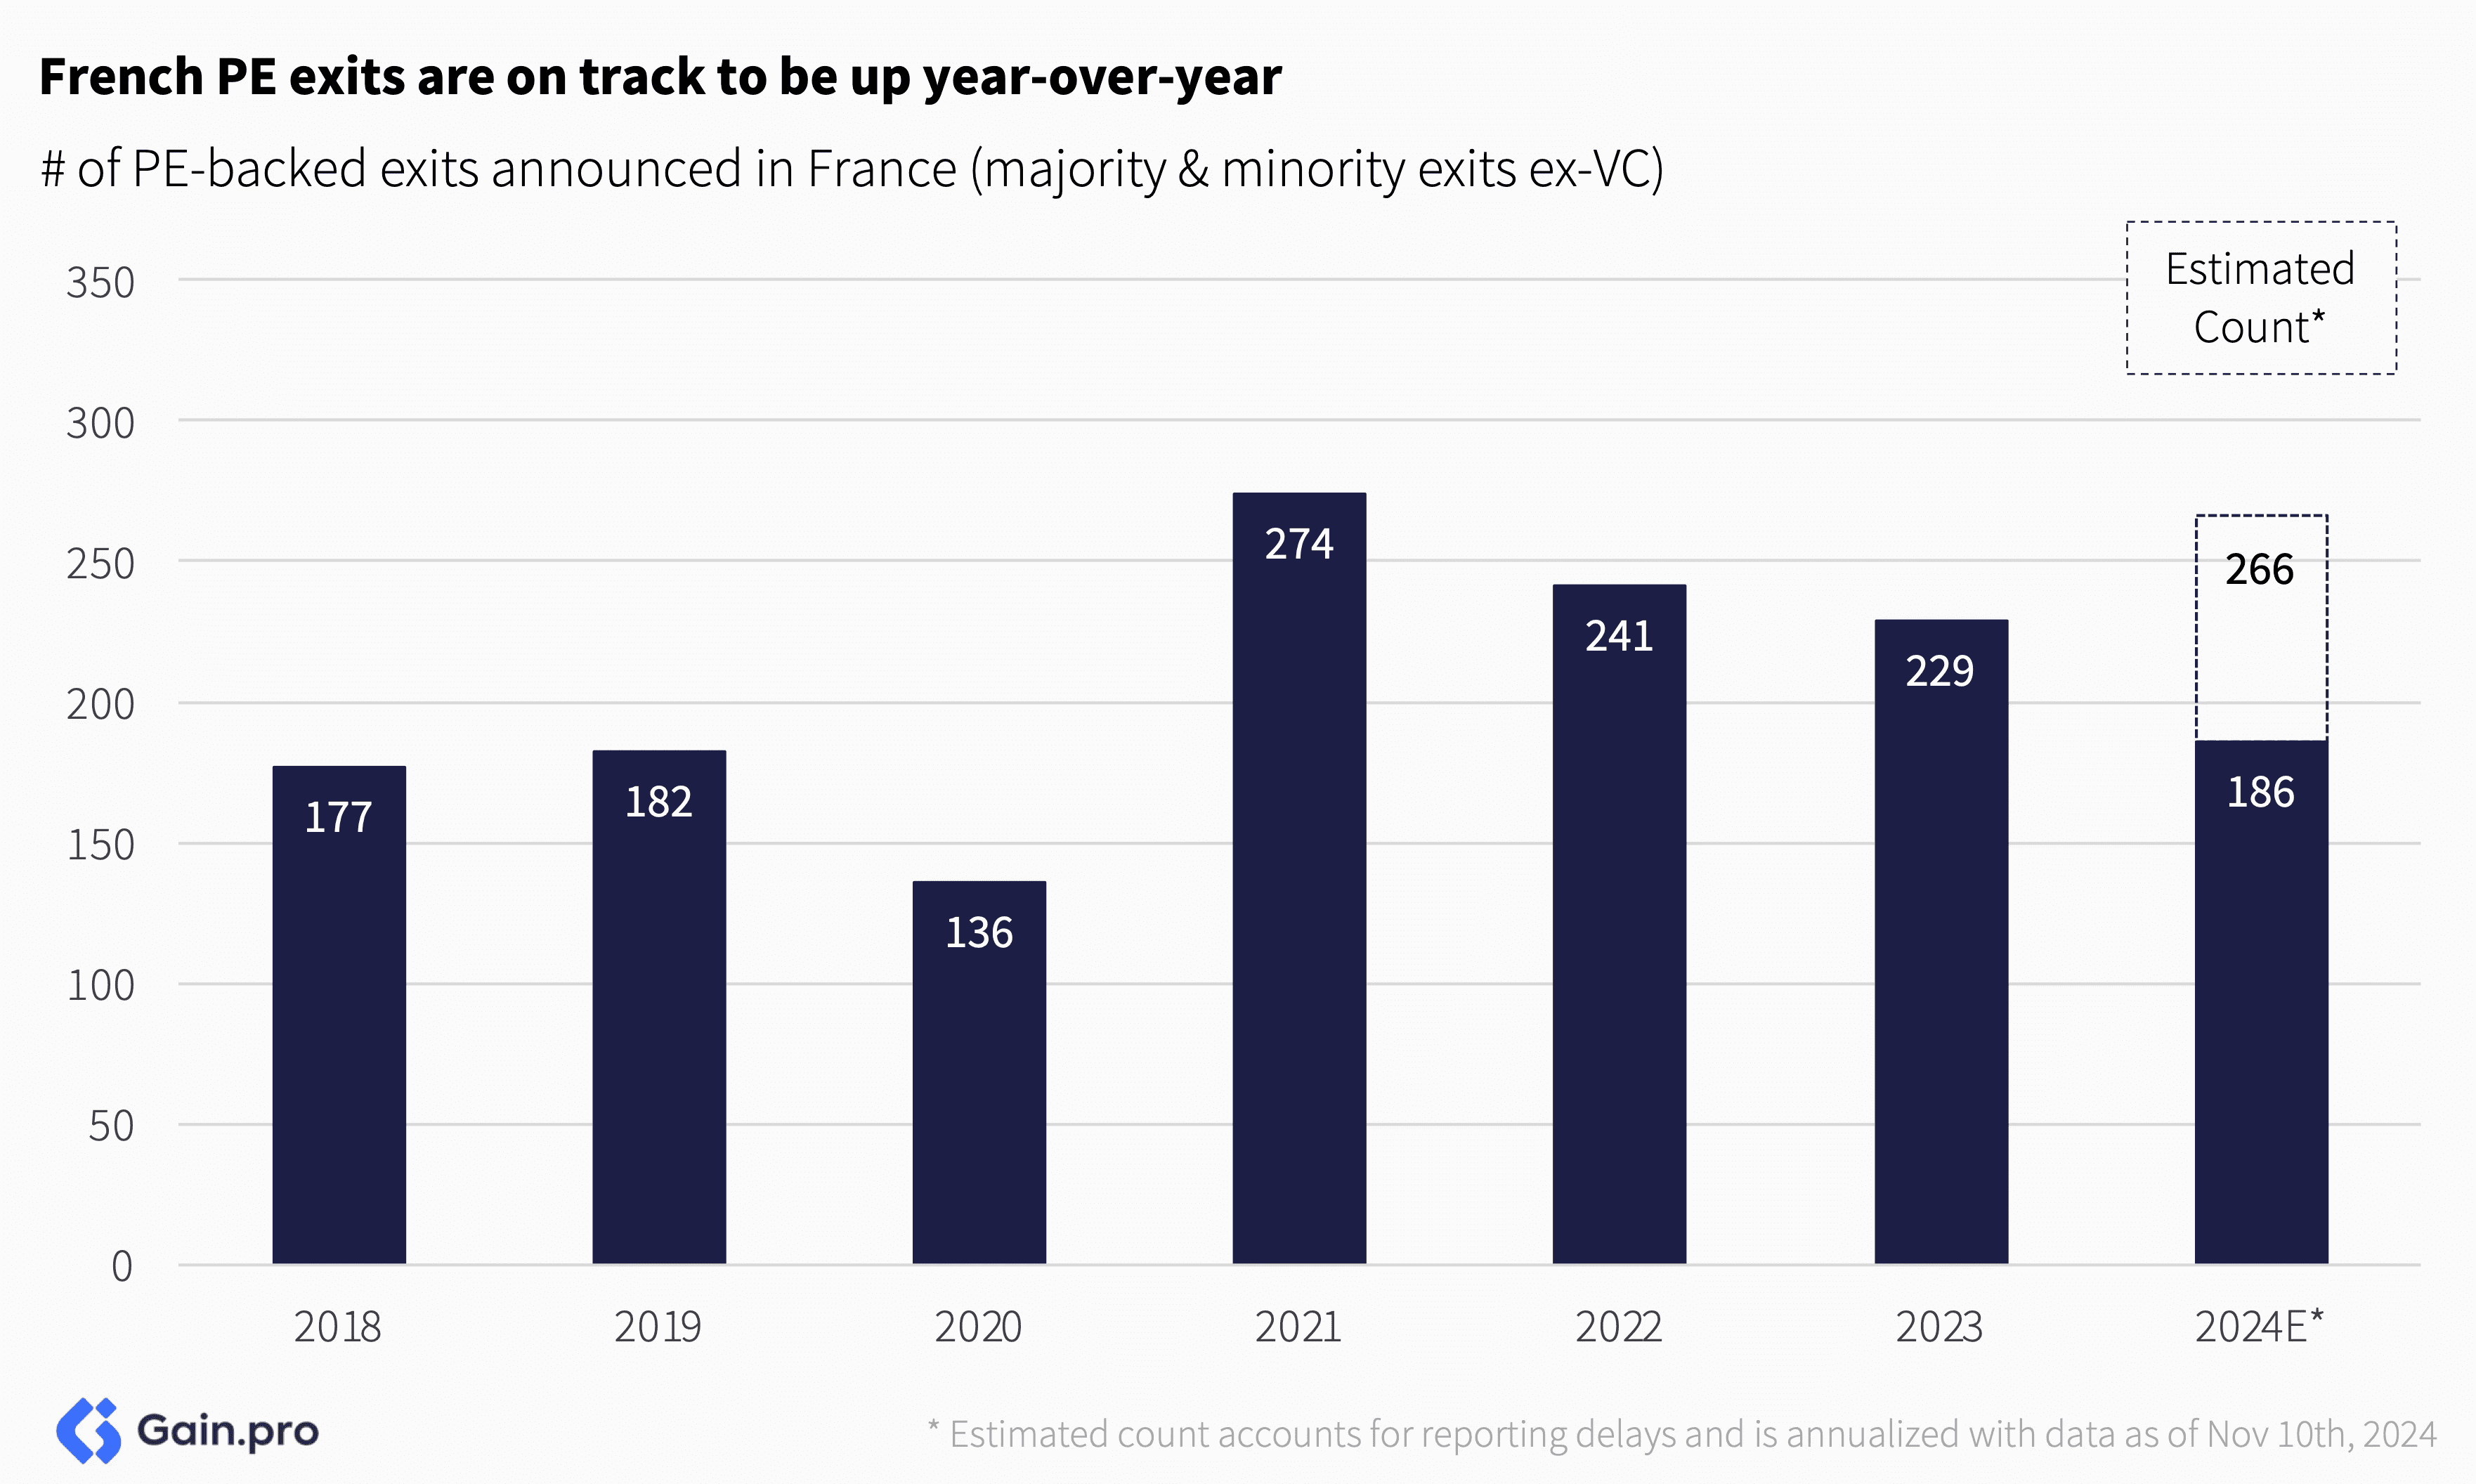
French PE exit activity is on track to be up year-over-year. After two consecutive years of decline, we expect activity to pick up this year, driven by a particularly strong Sponsor-to-Sponsor exit market in France.
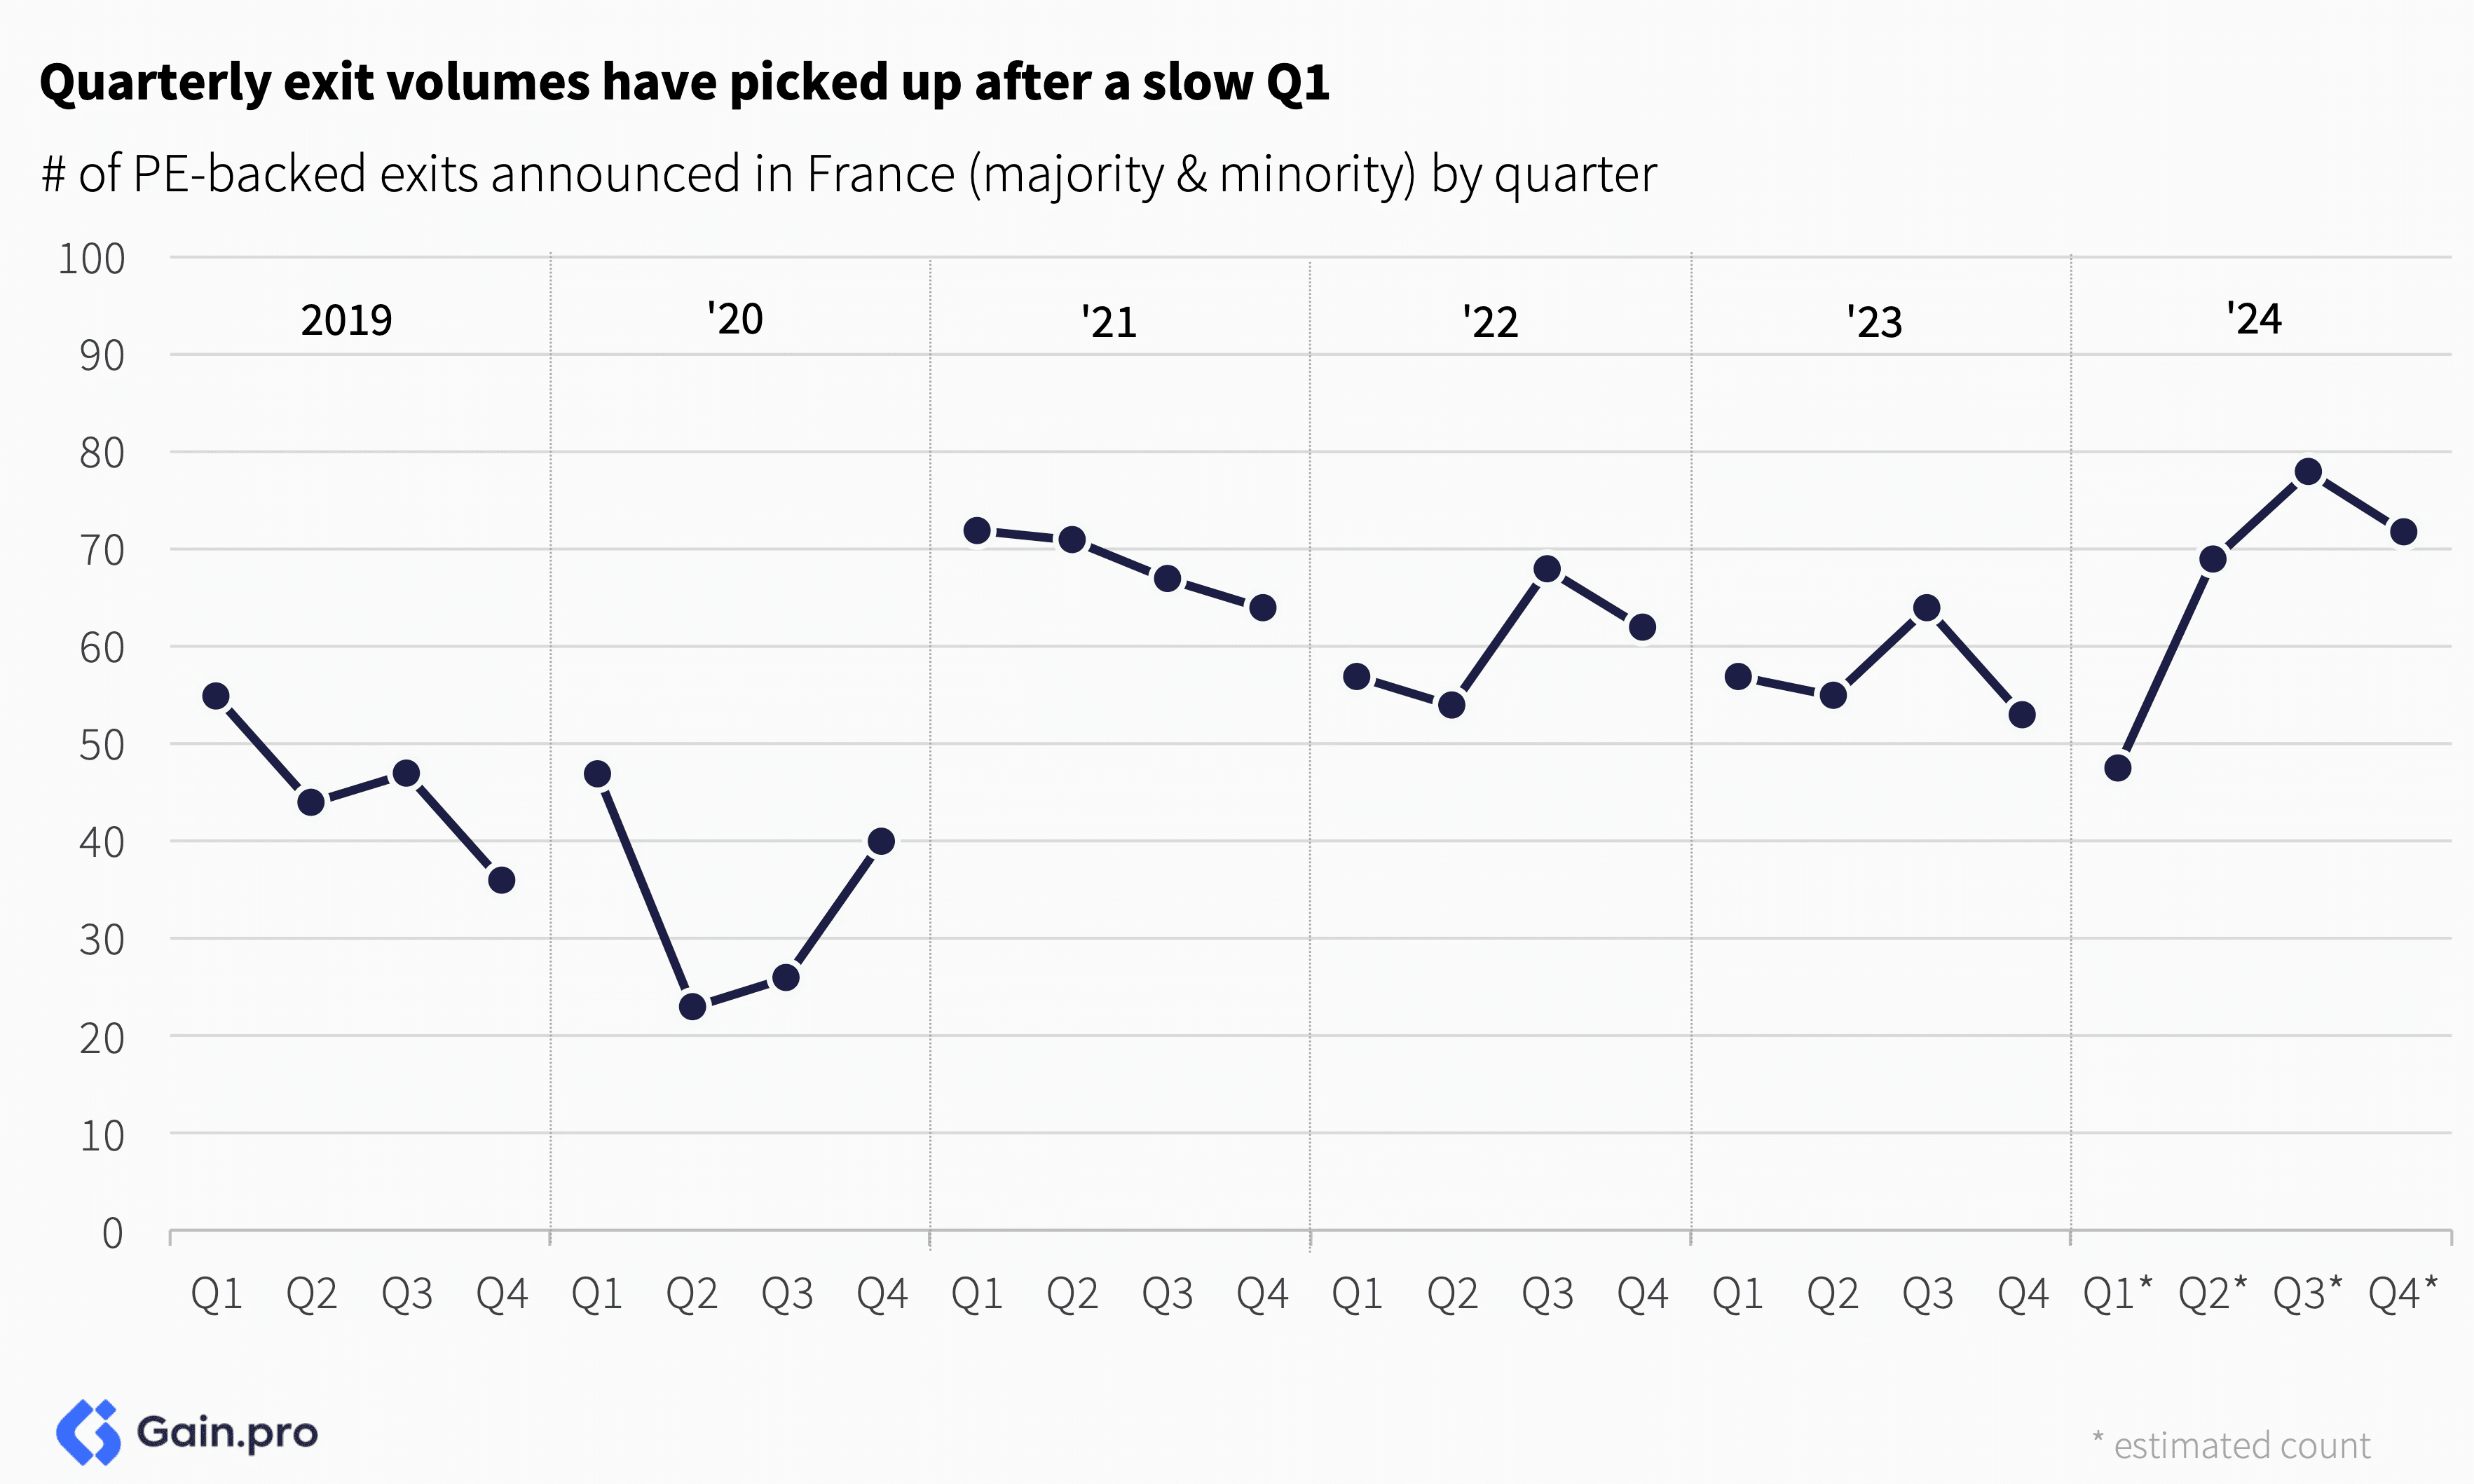
Quarterly exit volumes are hitting new highs after a slow Q1. Improving overall market conditions, greater availability of credit and fundraising dynamics are all contributing to the uptick.
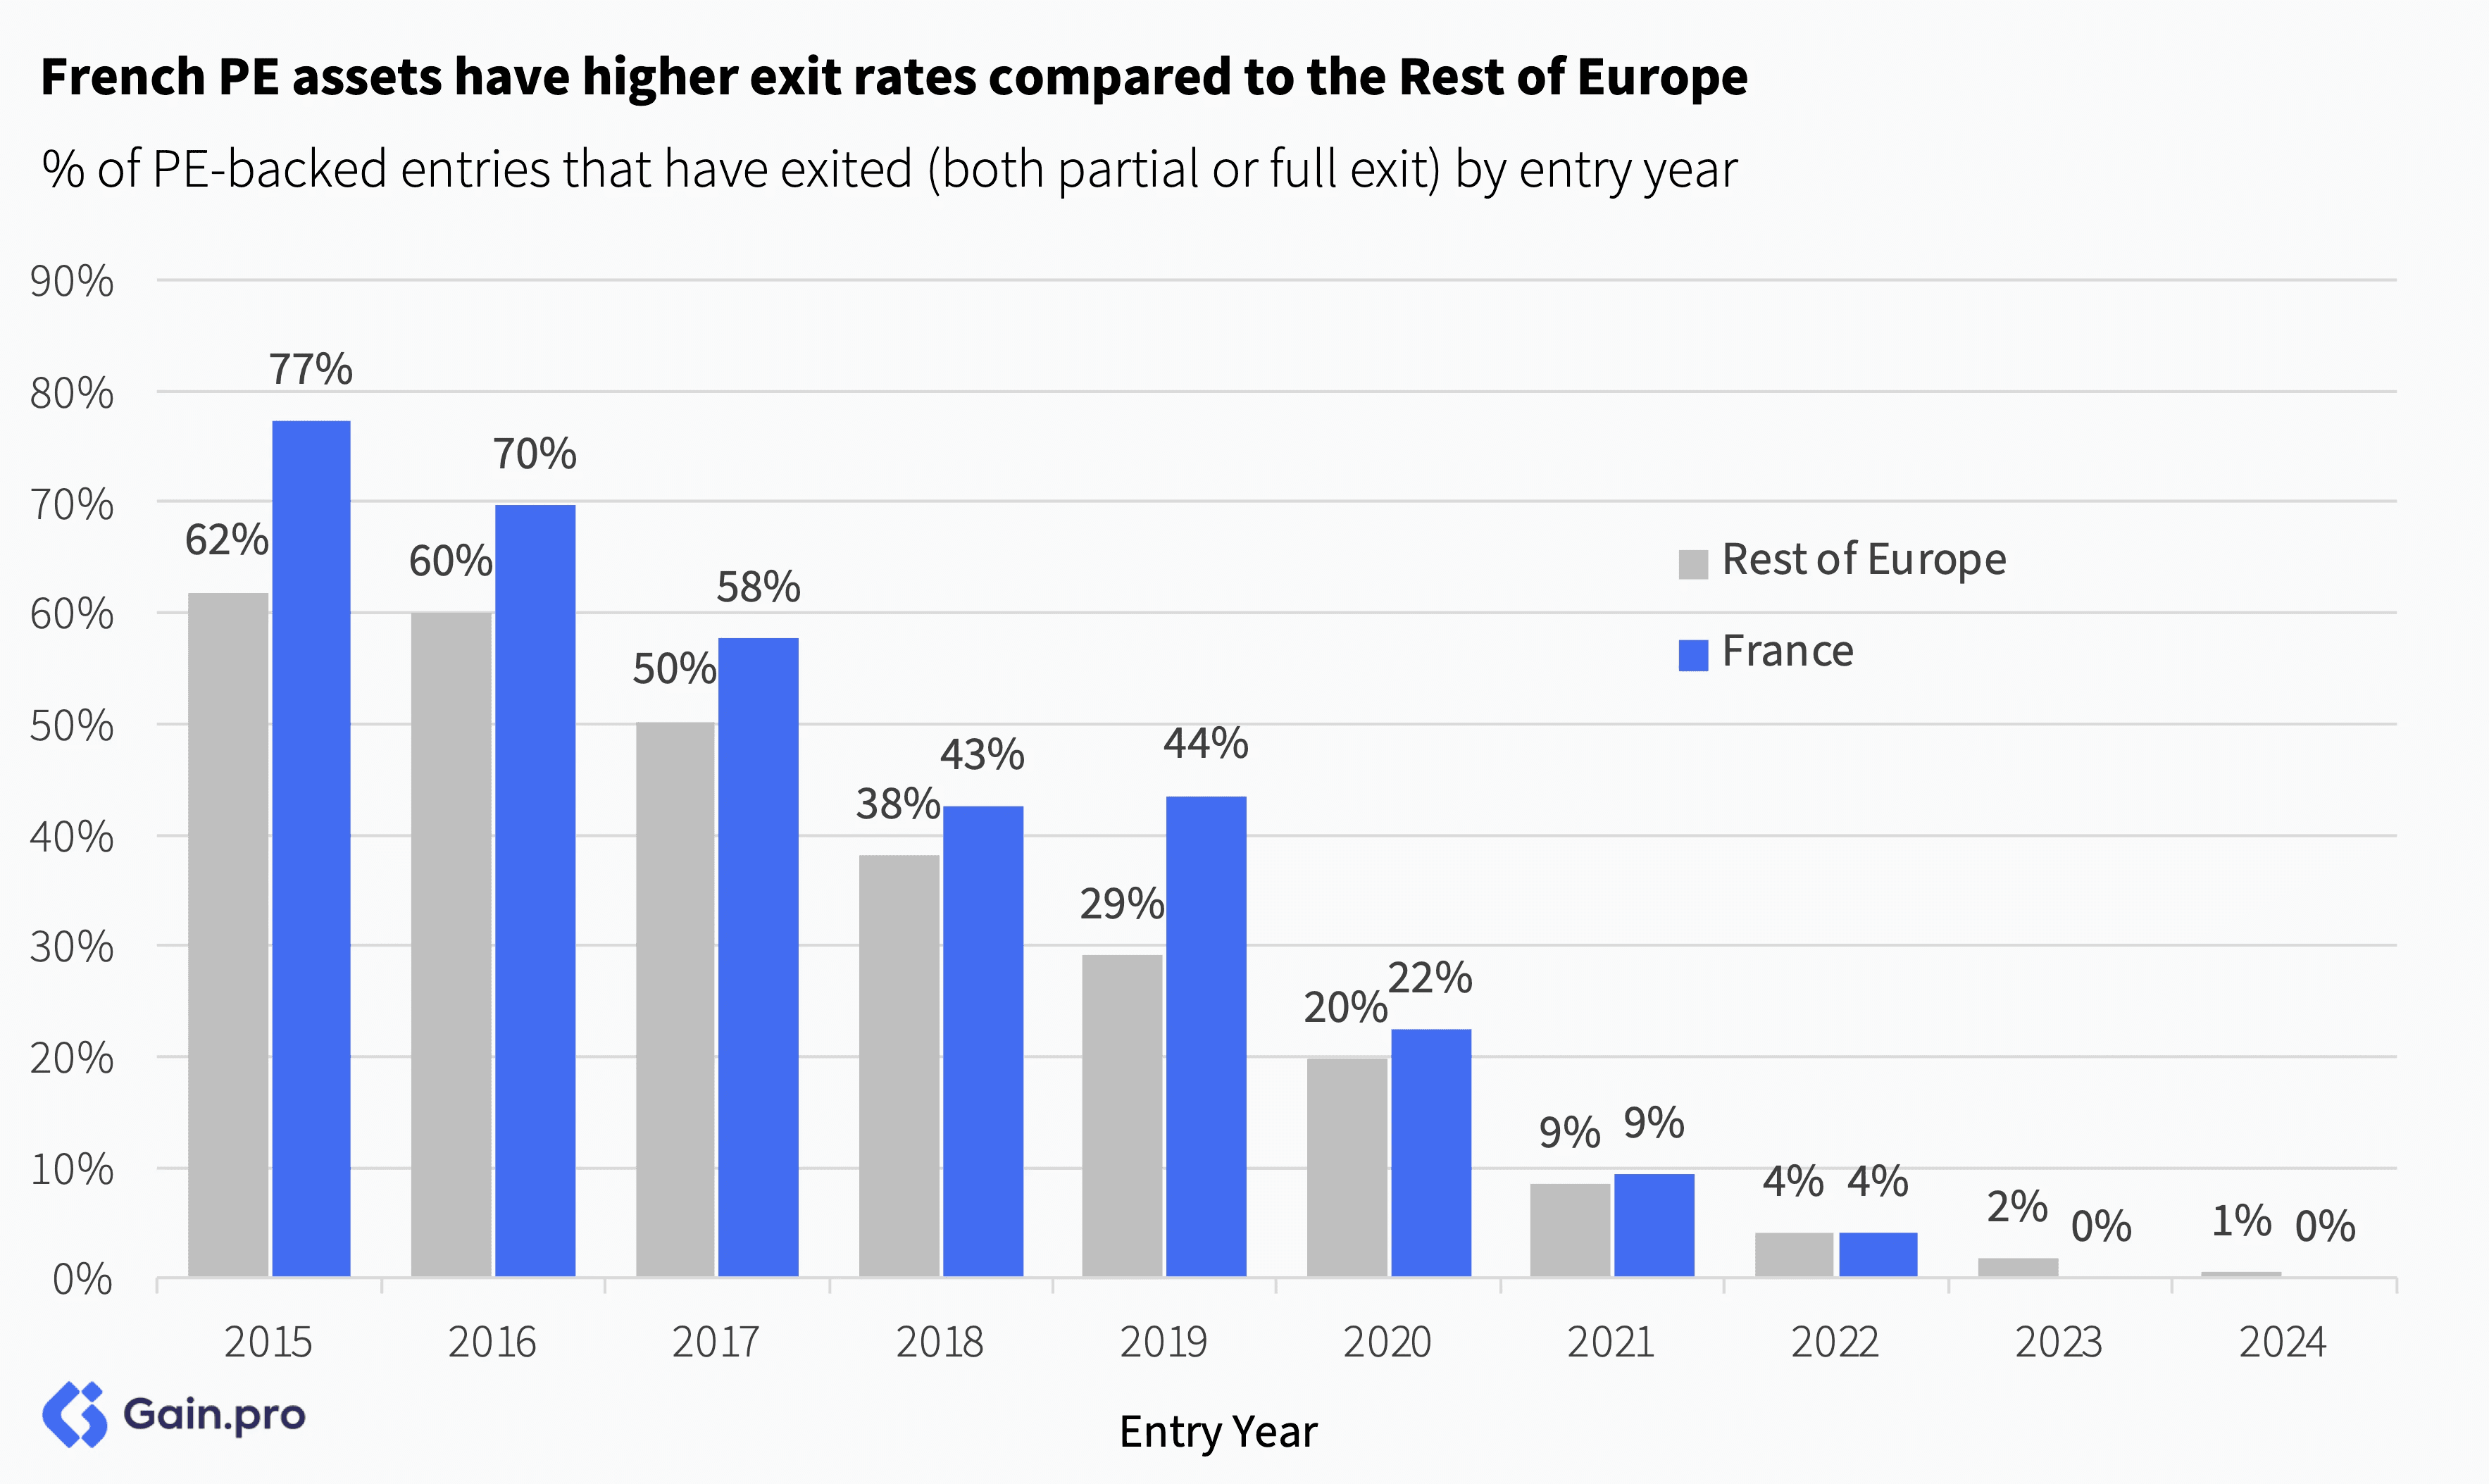
As a percentage of entries, a higher number of French PE assets have exited compared to the Rest of Europe. 77% of French PE entries from the year 2015 have exited (vs. 62% for the Rest of Europe). The data for more recent years (2016-2020) tells a similar story.
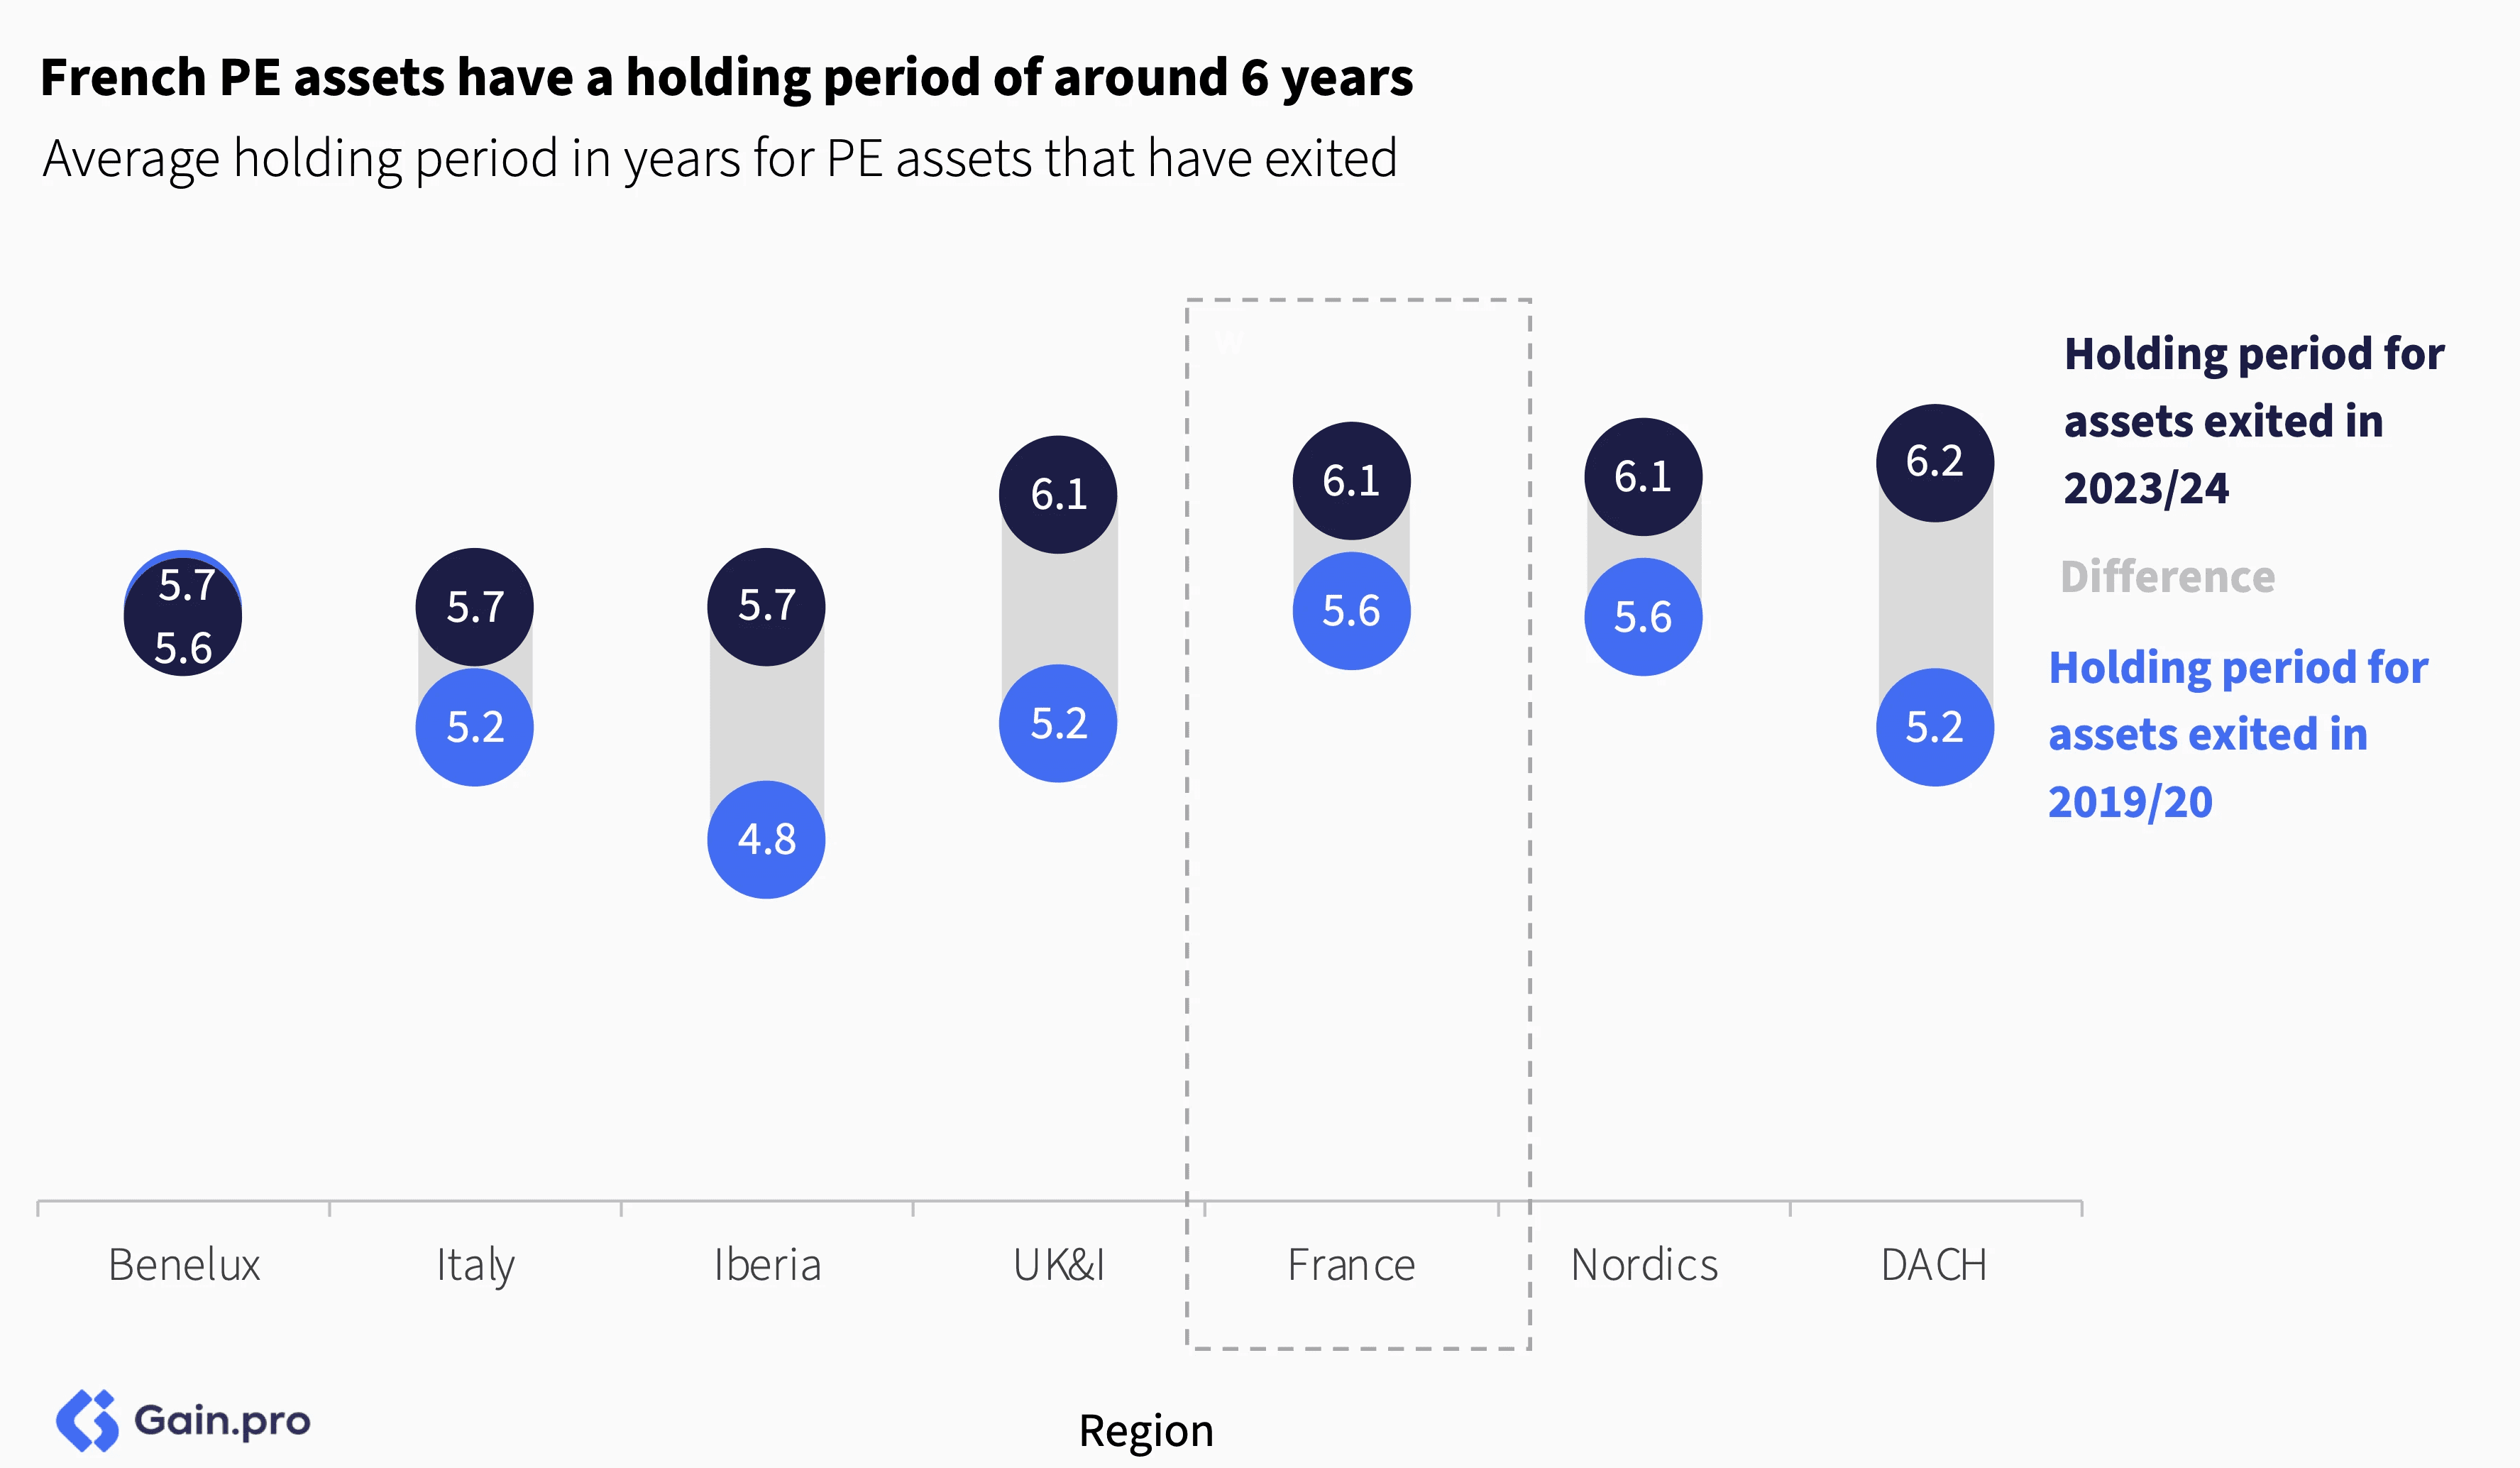
On average, French PE assets have a holding period of around 6 years (in line with other regions). As exits ramp up, we anticipate average holding periods to rise even further, particularly in regions outside of France, which have a larger inventory of longer-held assets.
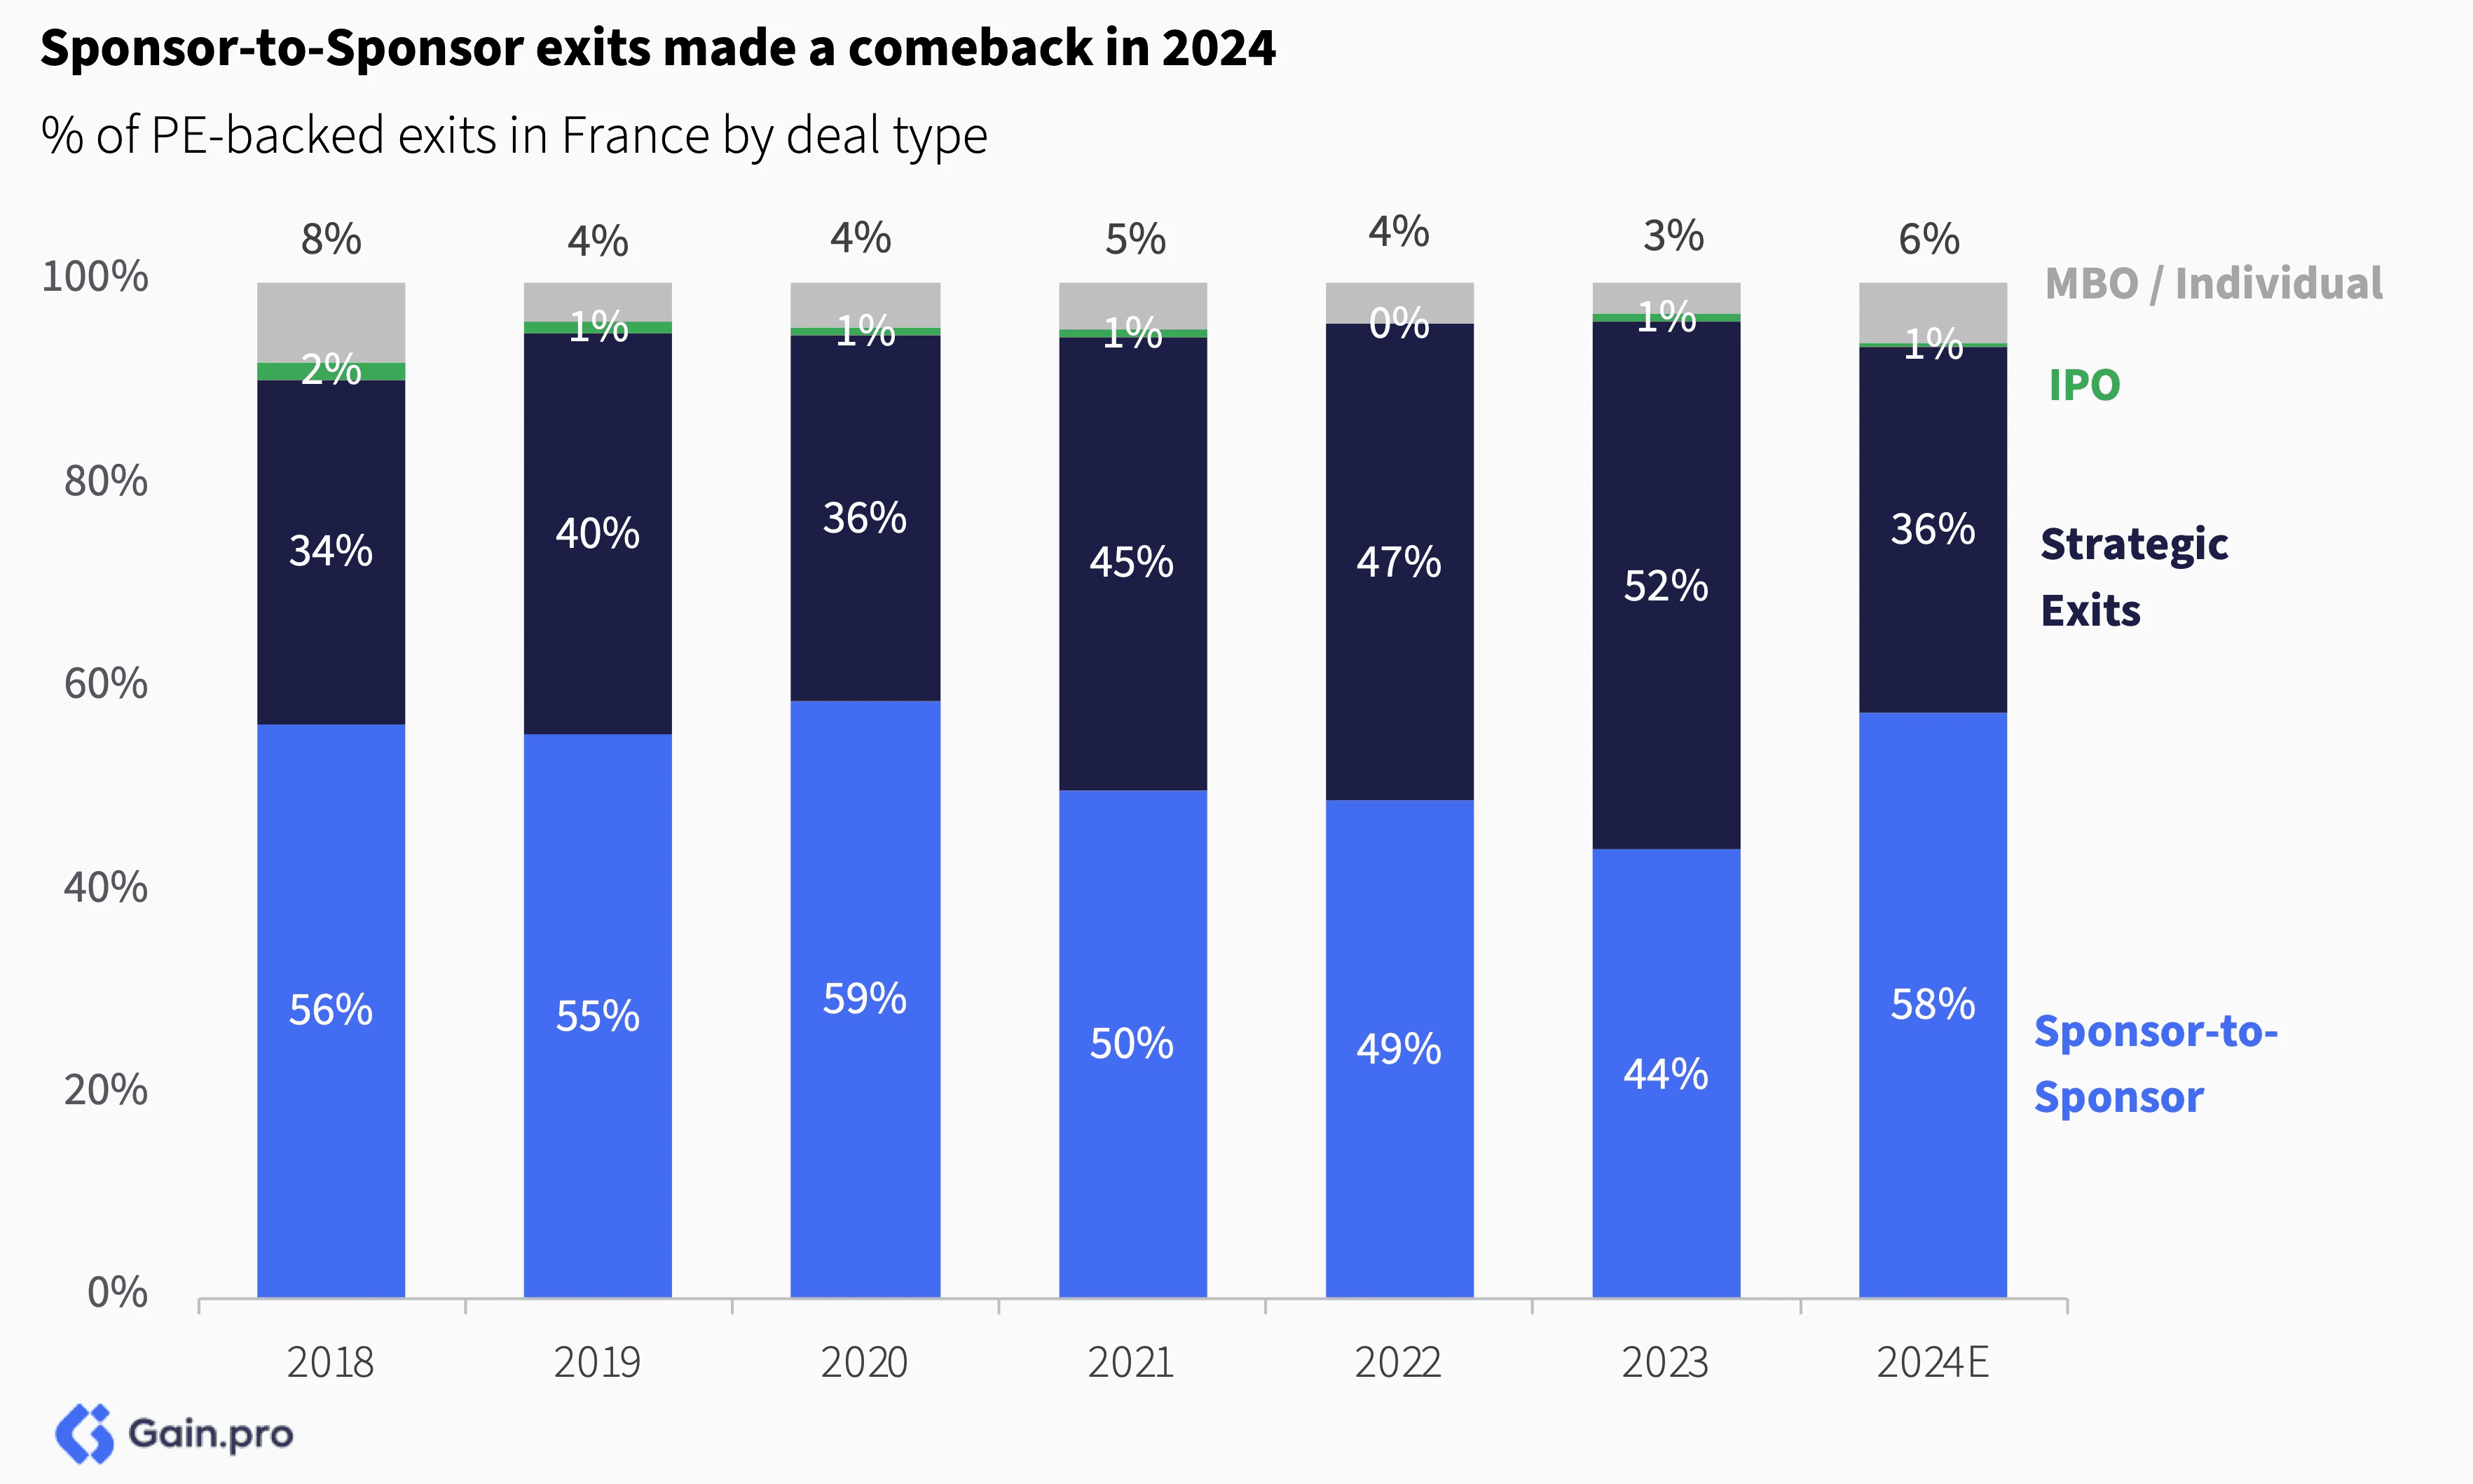
Sponsor-to-Sponsor exits made a comeback in 2024. 58% of PE exits in France in 2024 were Sponsor-to-Sponsor (up from 44% in 2023). The share of strategic exits, which increased in the years 2021-2023, has since come down.
Sector Trends
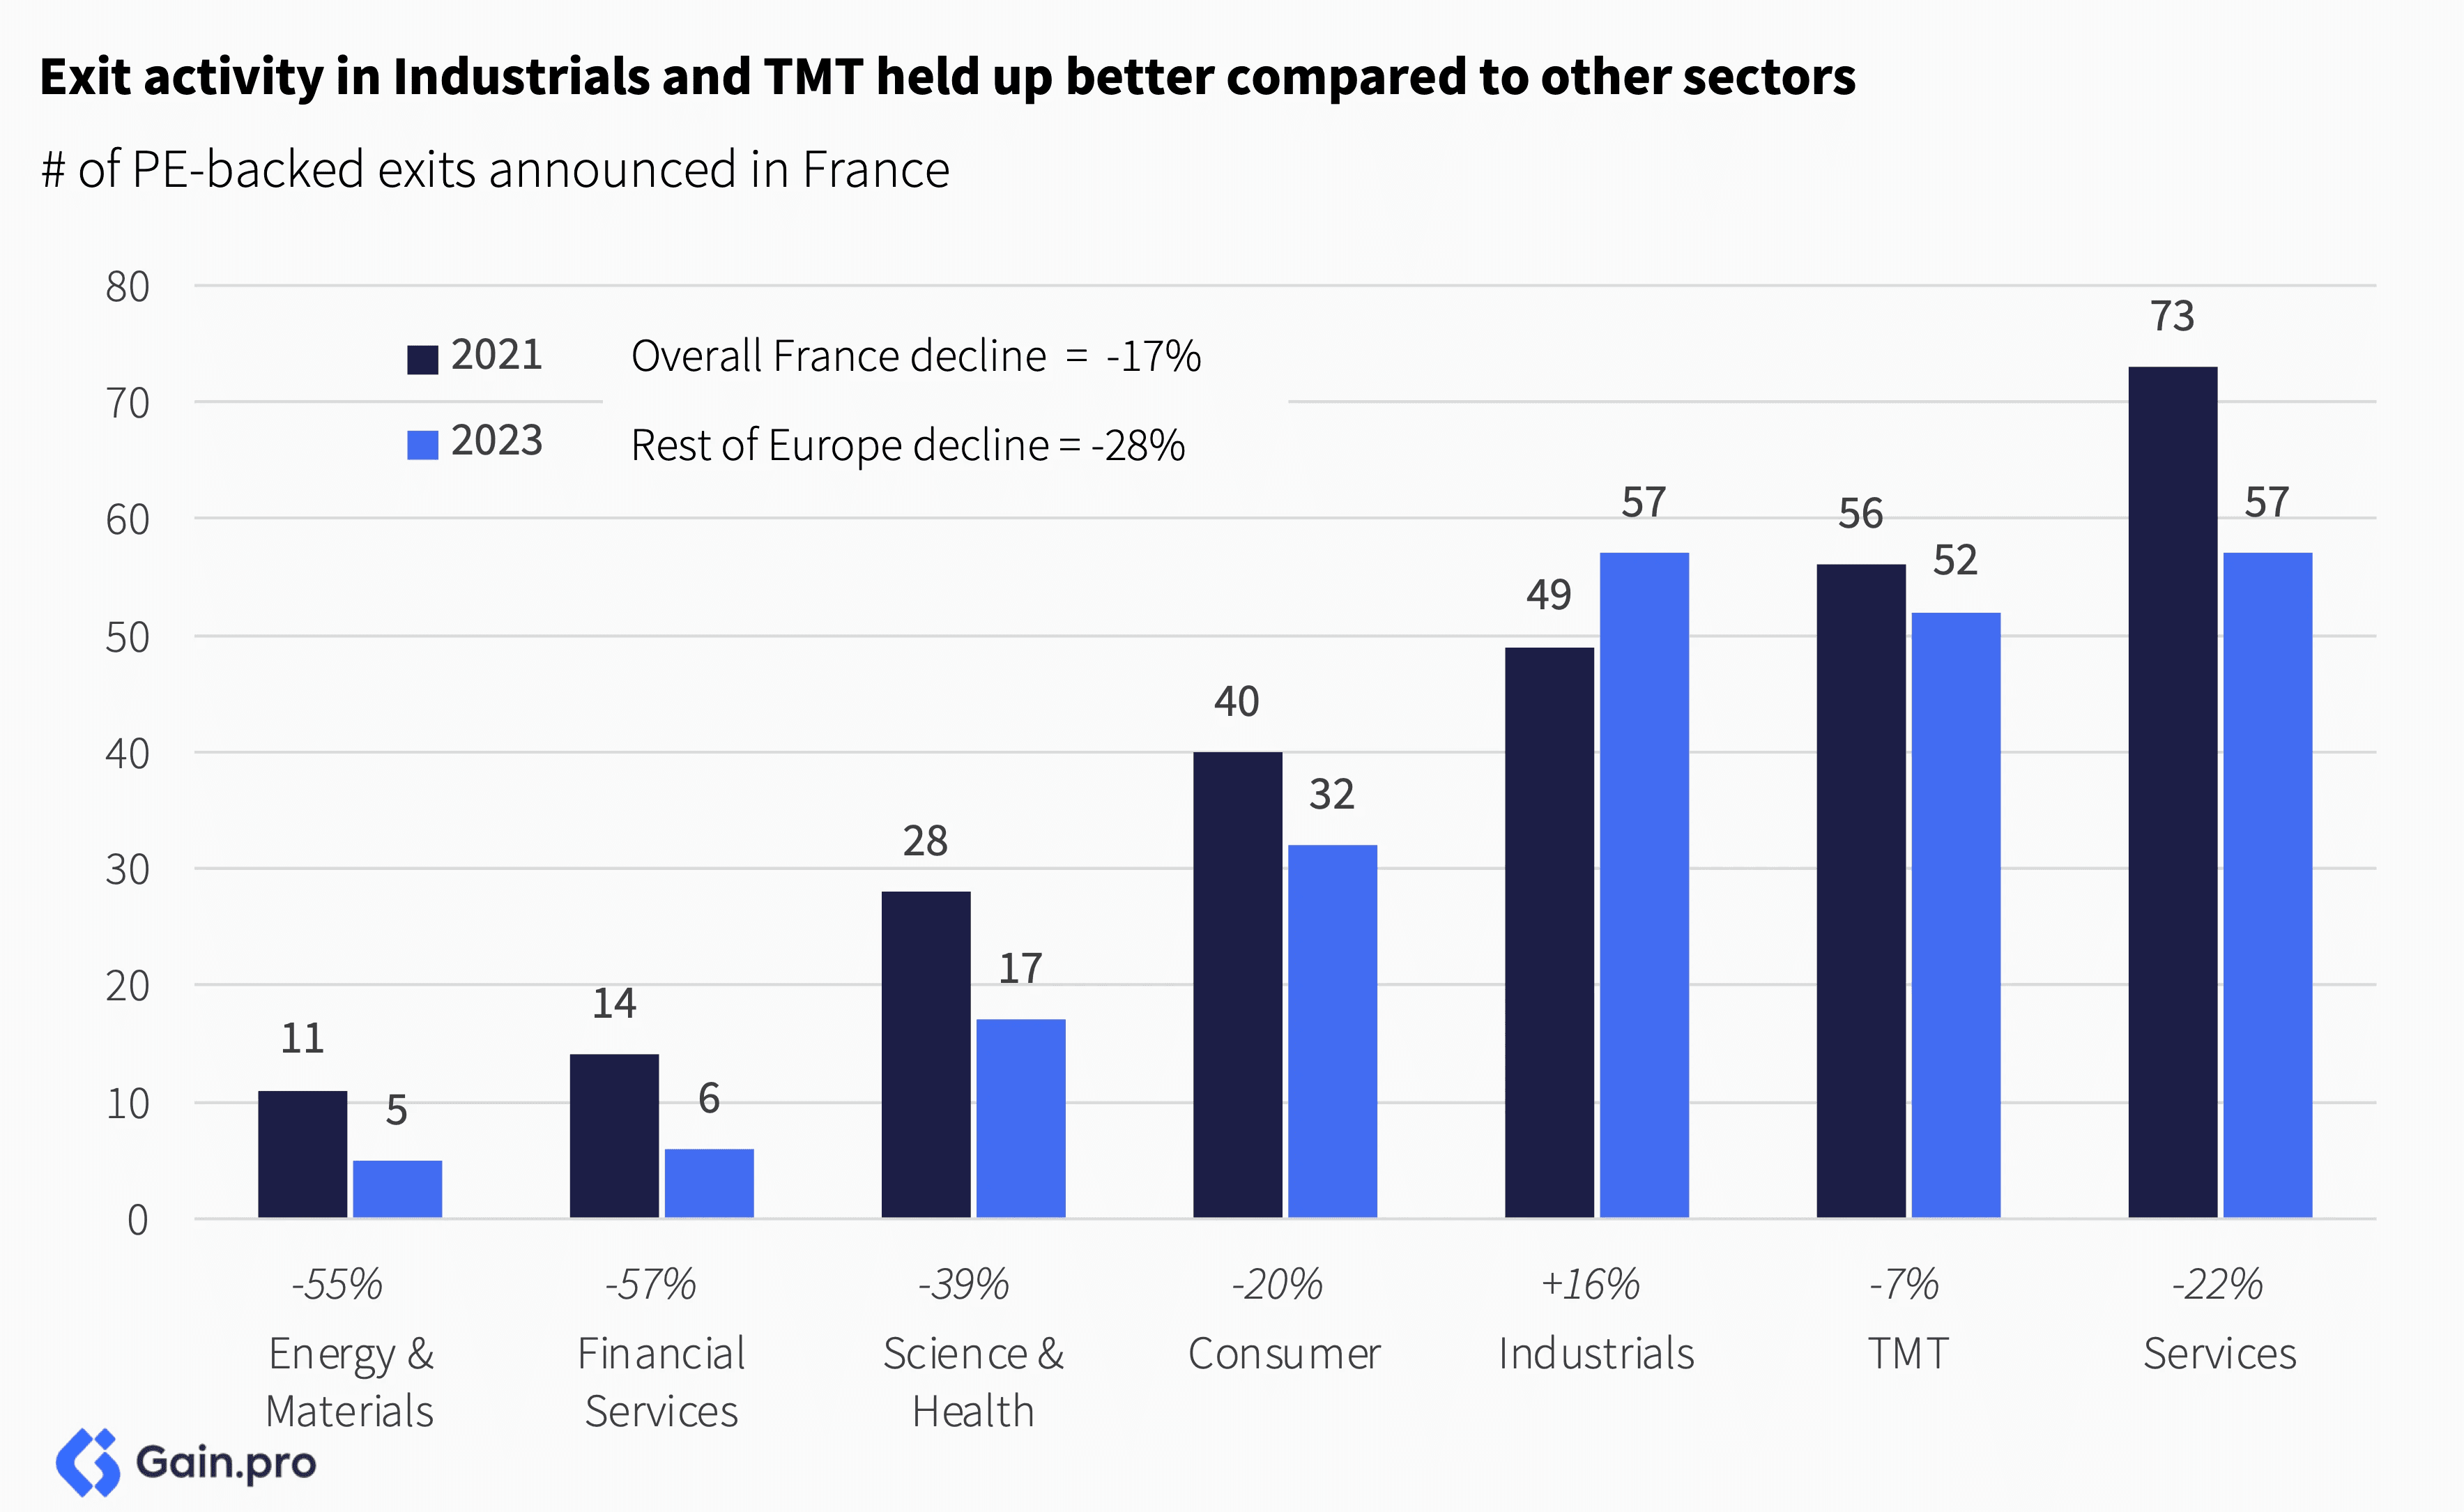
Exits in Industrials and TMT held up better compared to other sectors. PE exits in Industrials were up 16% and down just 7% in TMT. Overall, French PE exit count also fared better than the Rest of Europe (-17% vs. -28%, respectively).
Multiples
PE deal multiples in France are lower compared to the Rest of Europe. On average, deals are 20-30% cheaper to execute in France, with the discount holding steady over the past few years (except 2022 which was impacted by a few outlier deals).
Chapter 03: Largest Investors
Largest Global Investors Investing in France
Ardian has emerged as the largest investor investing in France, managing a total estimated EV of €12.6bn in the region, followed by Bpifrance (€11.1bn) and Clayton, Dubilier & Rice (€10.6bn).
Other investors in the top 10 include Groupe Crédit Agricole (€10bn), EQT (€9bn), PAI Partners (€6.2bn), KKR (€6.1bn), Naxicap (€5.3bn), Eurazeo (€5.2bn) and Groupe HLD (€4.7bn). Collectively, the largest 50 investors in France manage an estimated EV of €173.3bn, with the top 10 alone managing an estimated EV of €81bn (~47% of the total).
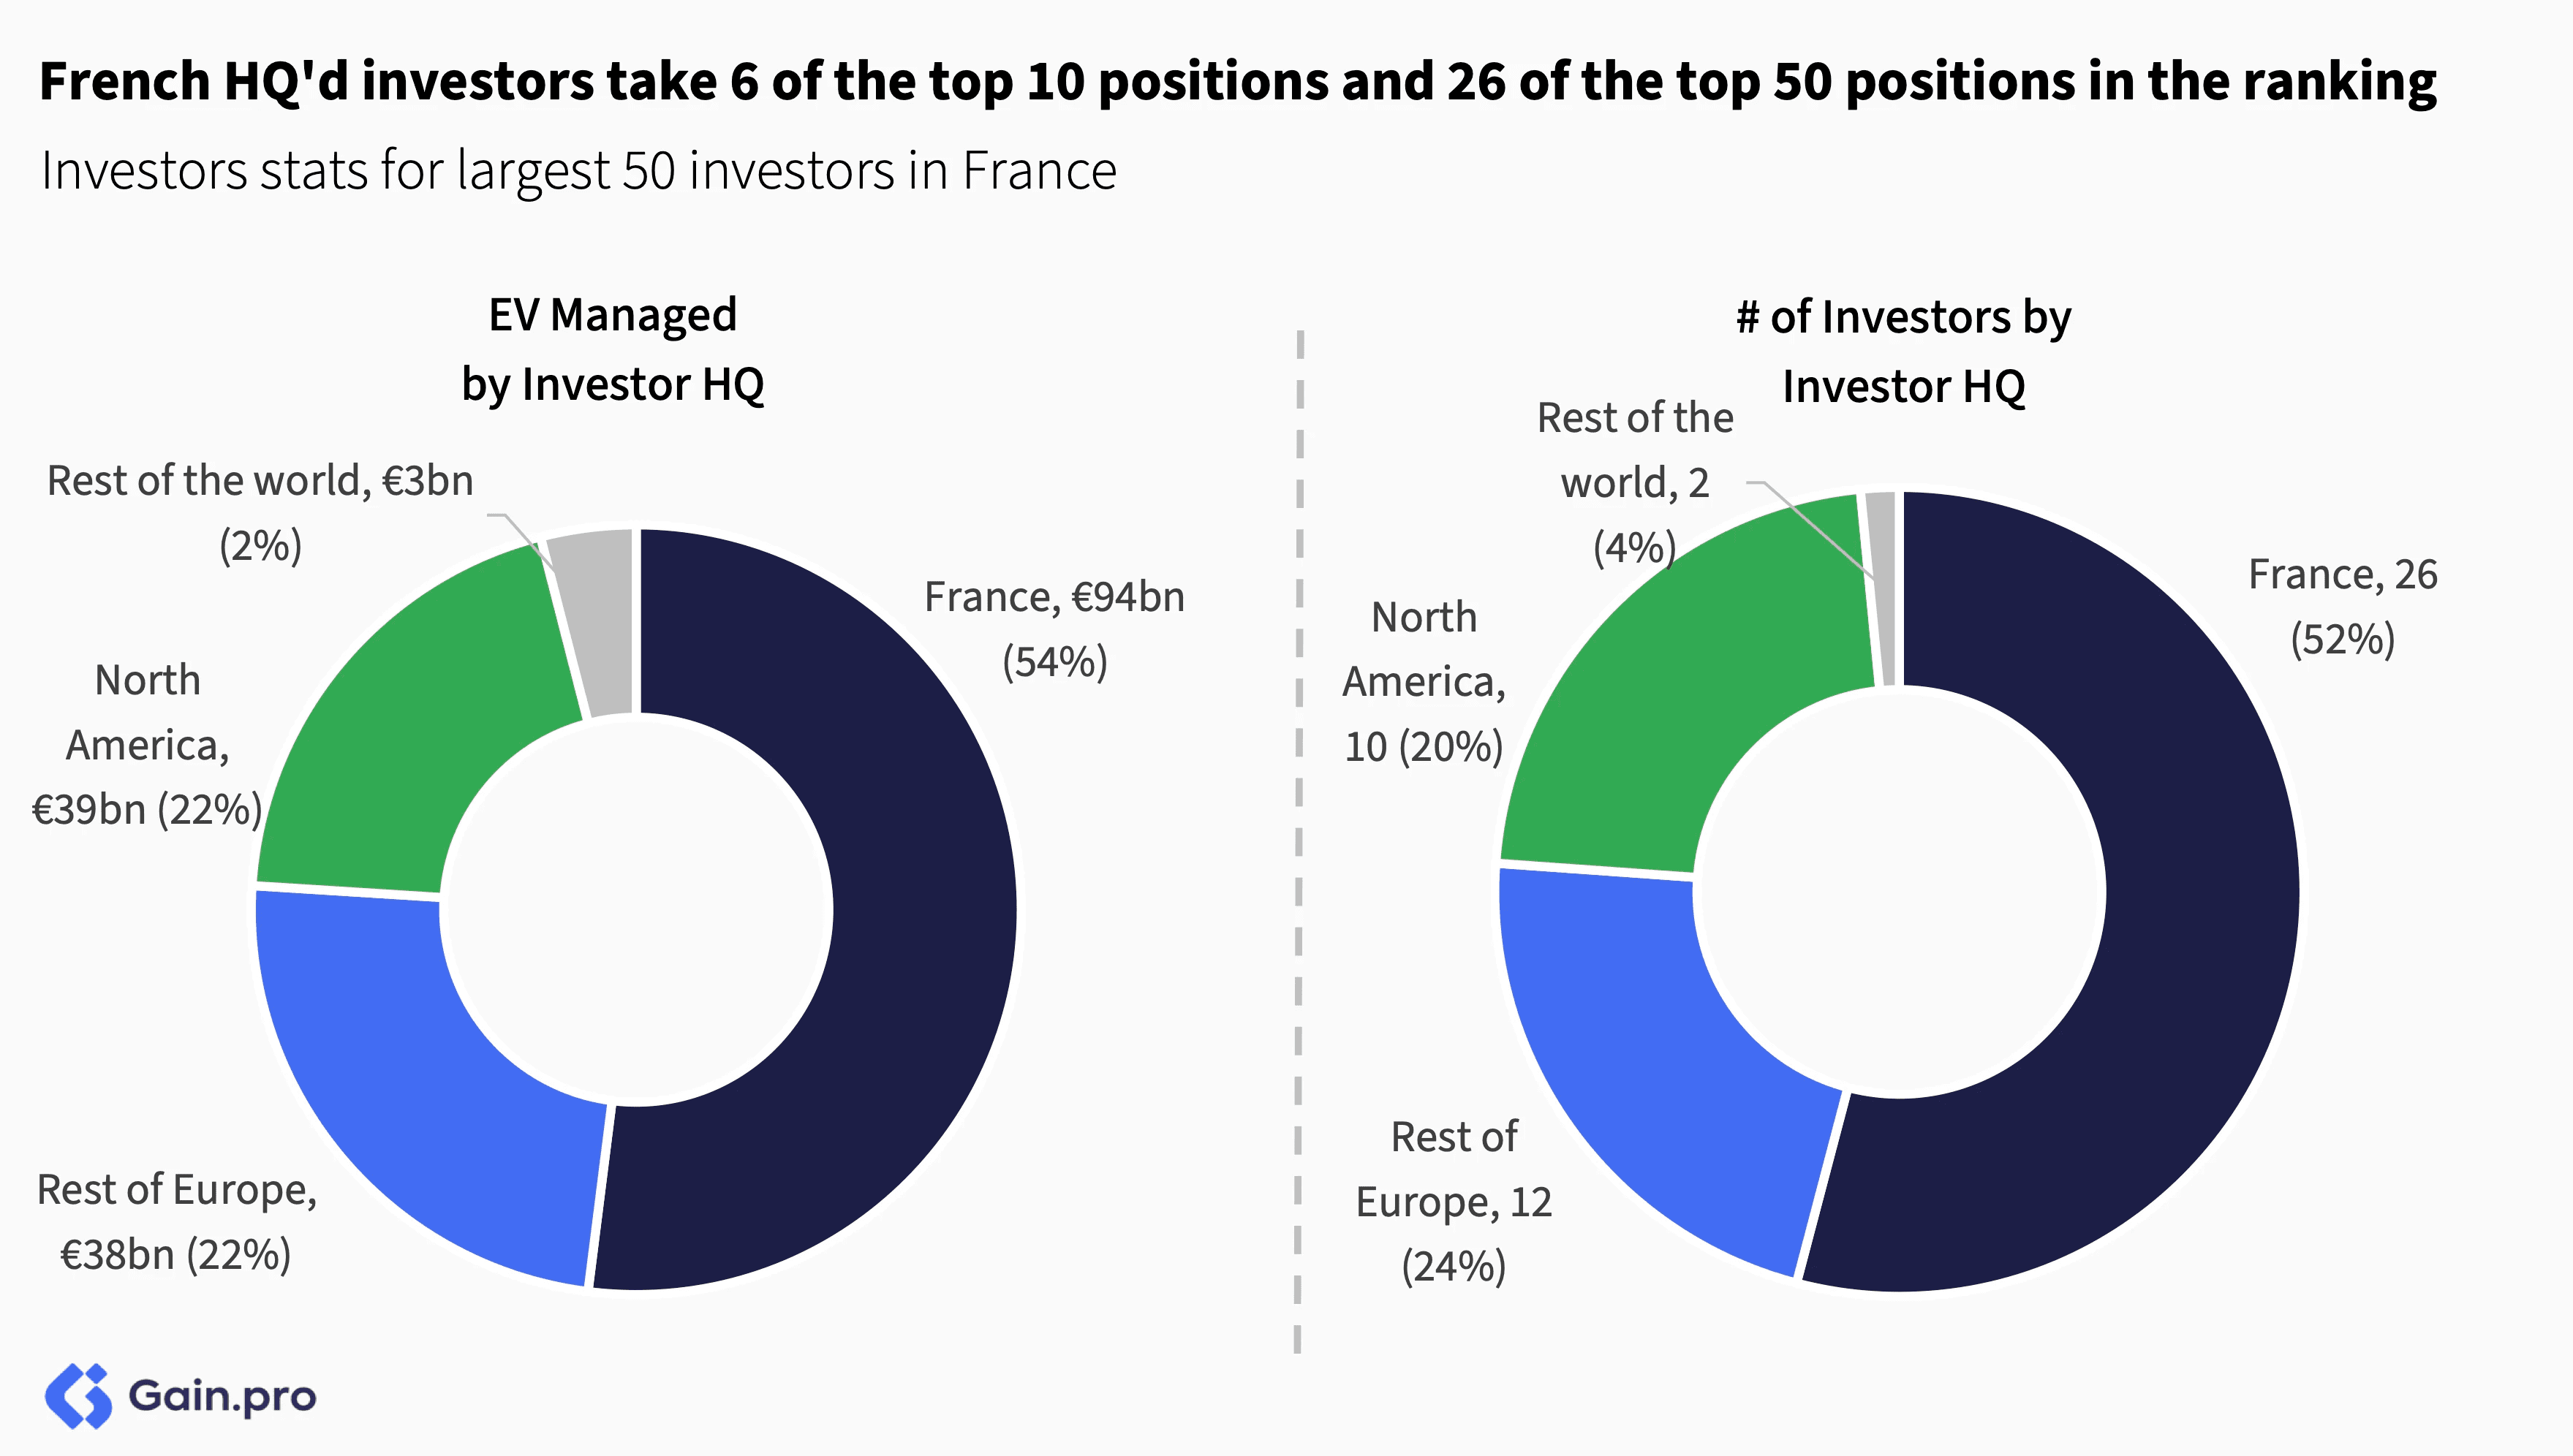
French HQ’d investors dominate the ranking, taking 6 of the top 10 positions and 26 of the top 50. France’s private equity market is distinctly local, with French investors managing €94bn (52%) of total enterprise value (EV), compared to €39bn (22%) for North American investors and €38bn (22%) for the rest of Europe.
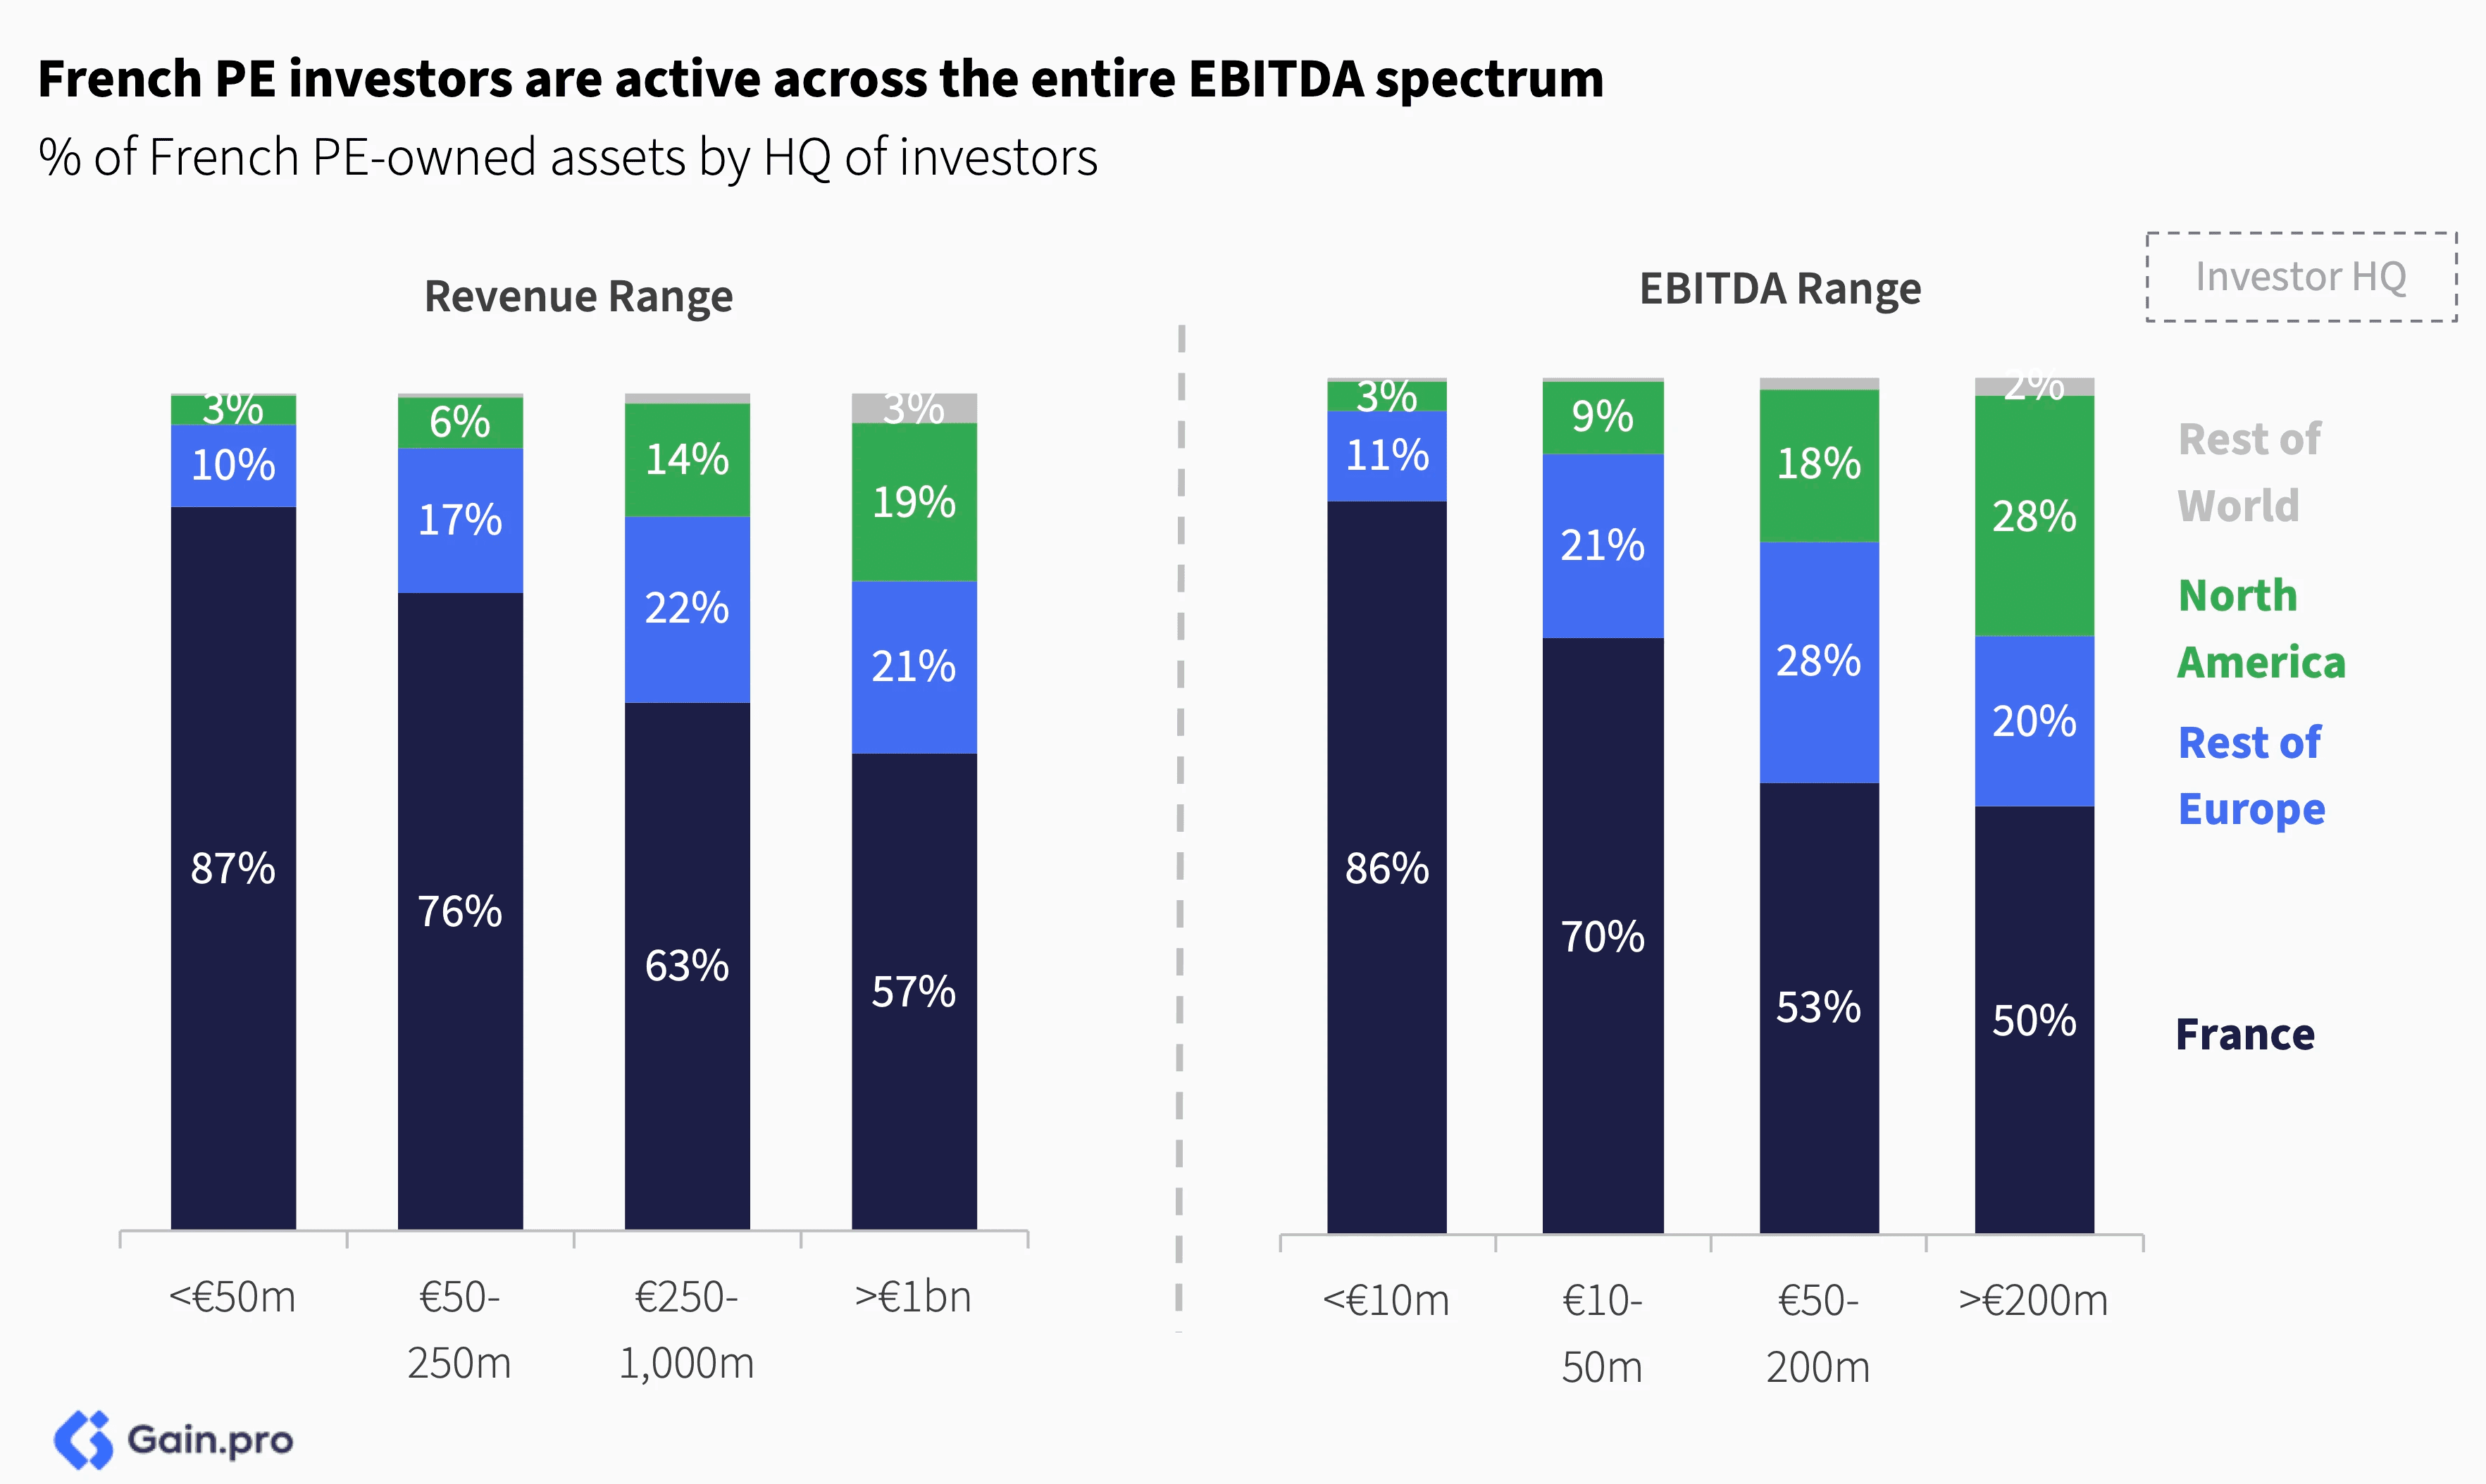
French PE investors are active across the entire EBITDA spectrum. This is unlike the DACH region where we see local investment significantly drop-off at higher EBITDA ranges.
The French PE market is one of the most domestic in Europe. 78% of PE-owned assets in France are owned by domestic investors. Even global players like Ardian have a strong domestic focus, with 54% of their European PE investments in France. On the other hand, DACH and Iberian markets are much less local with over a third of PE assets in those regions owned by international investors.
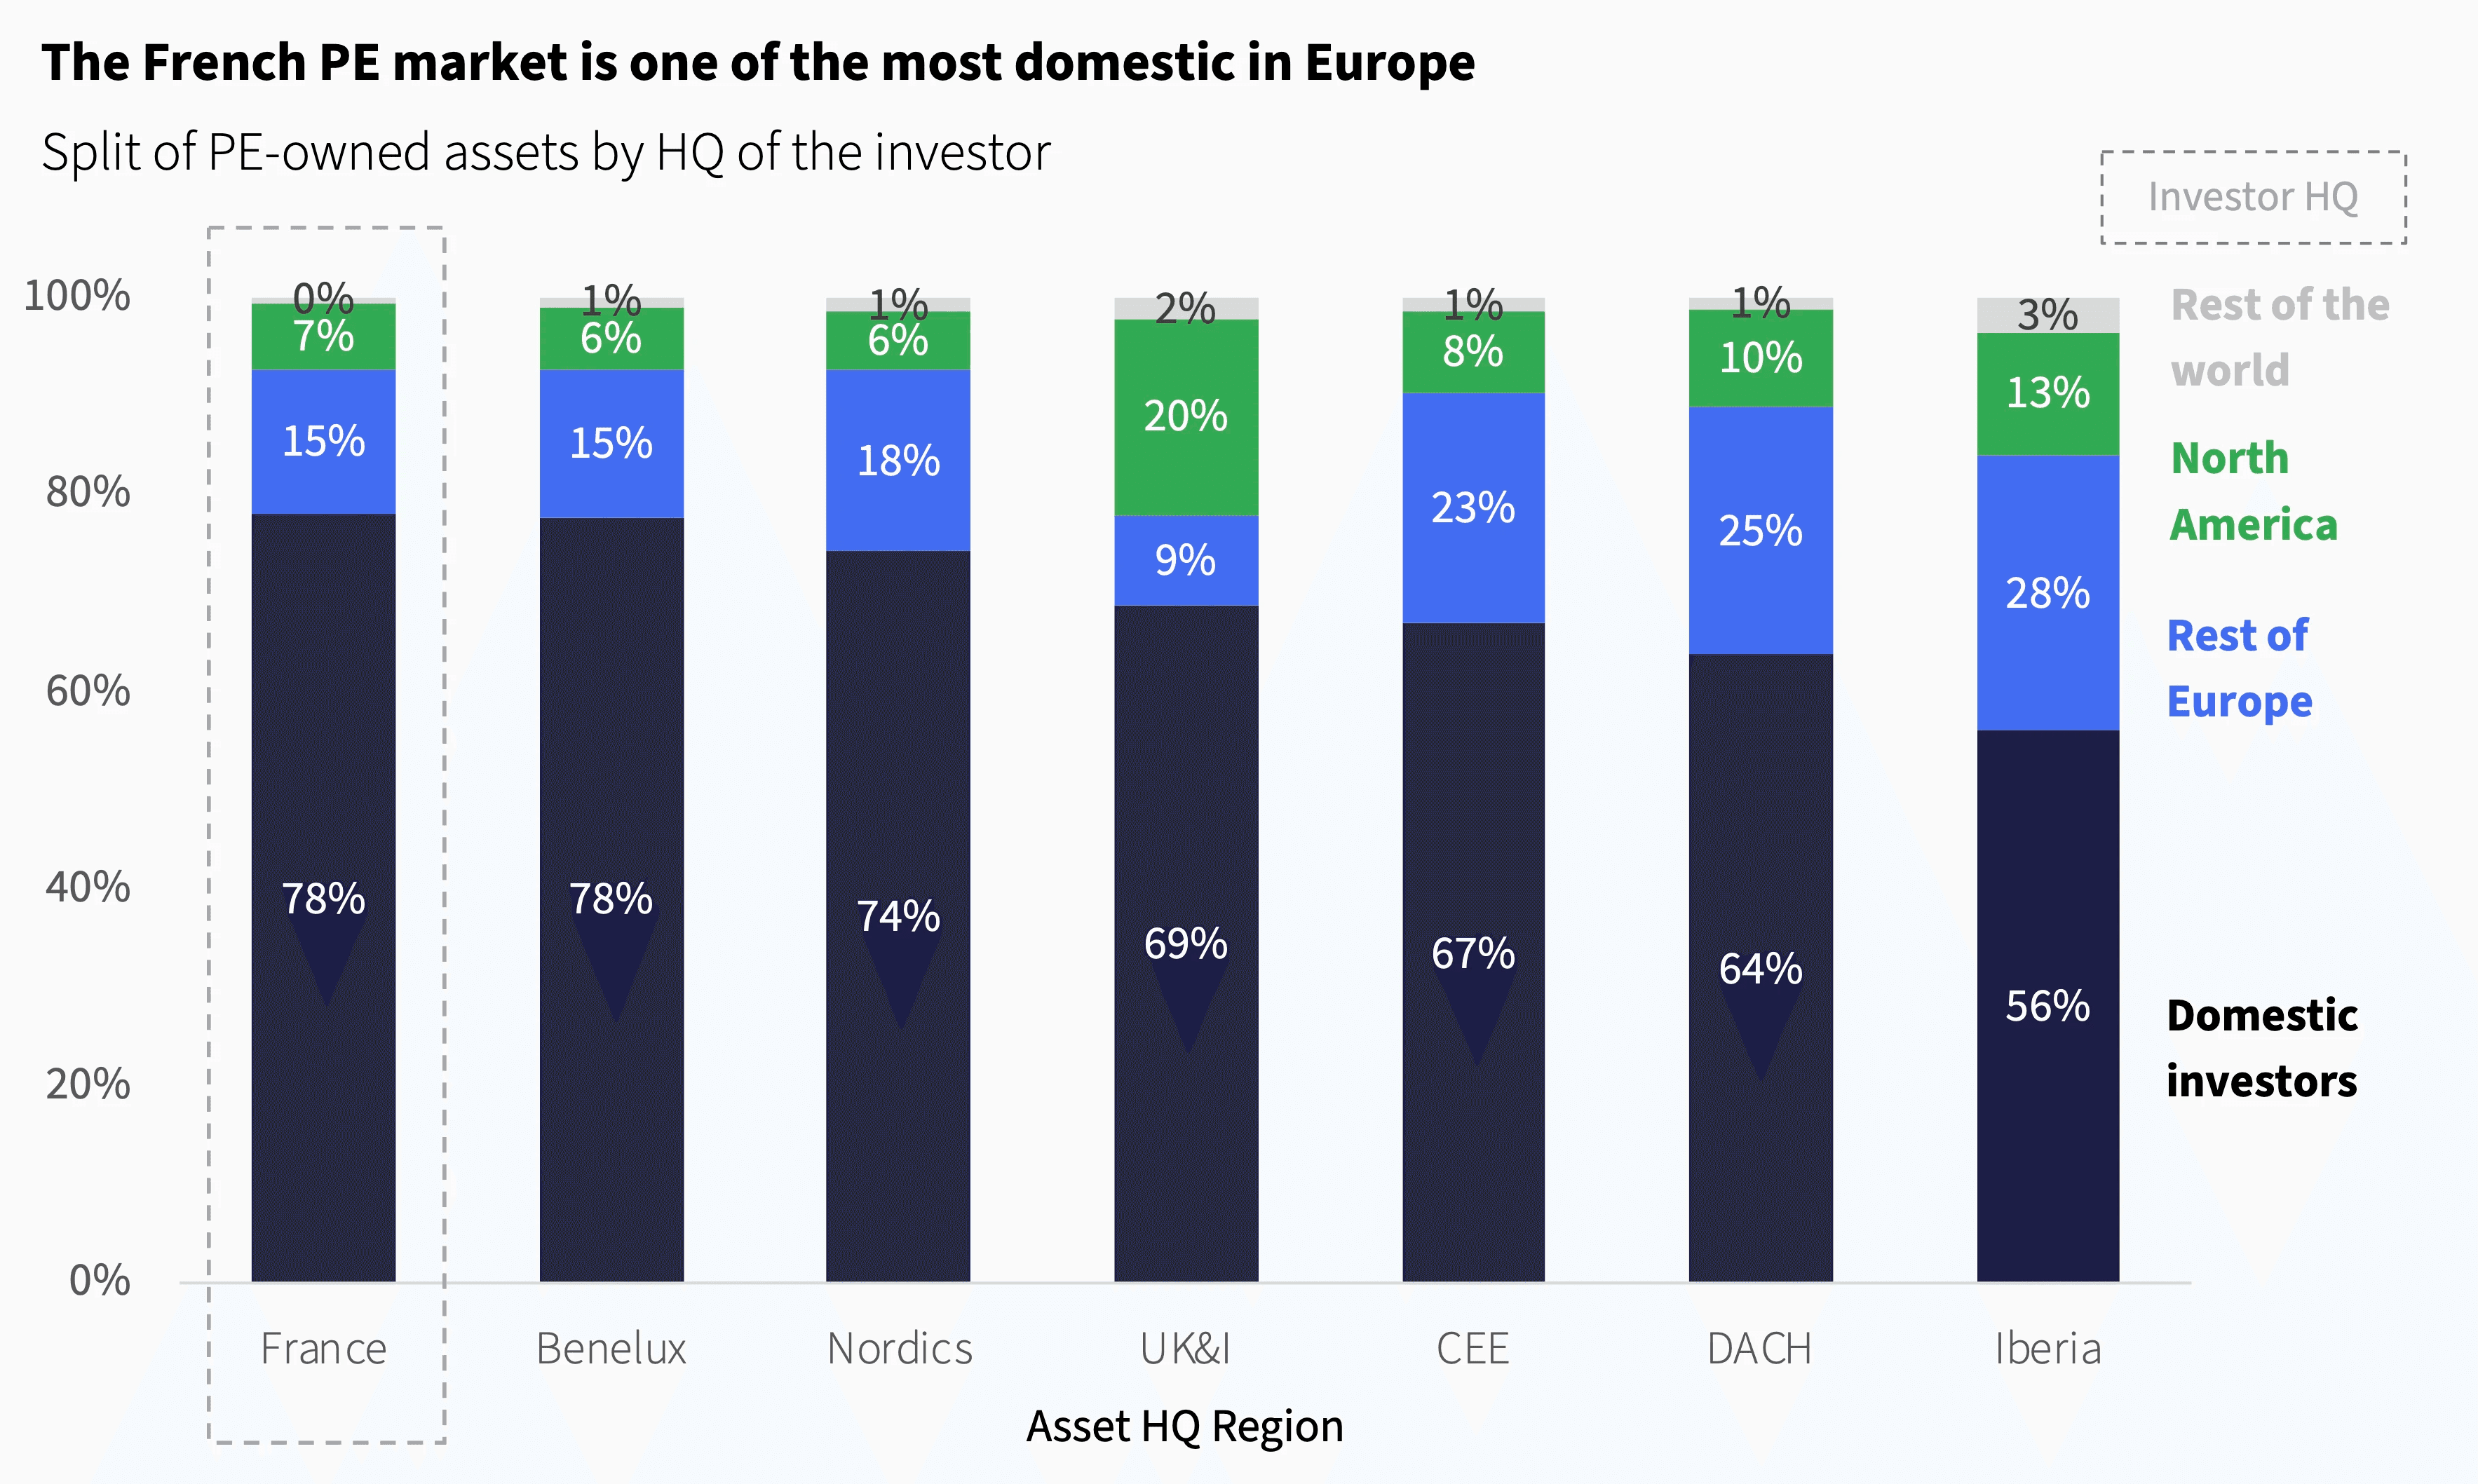
Domestic investors own 58% of the total managed EV in France, just behind Nordics’ 62%. Note how North American investors hold only 18% of EV share in France, in contrast to UK&I, Italy and DACH where they hold over 40% of the EV. It’s hard to "win" the deals against well-established French investors and obvious acquirers like Ardian and PAI Partners.

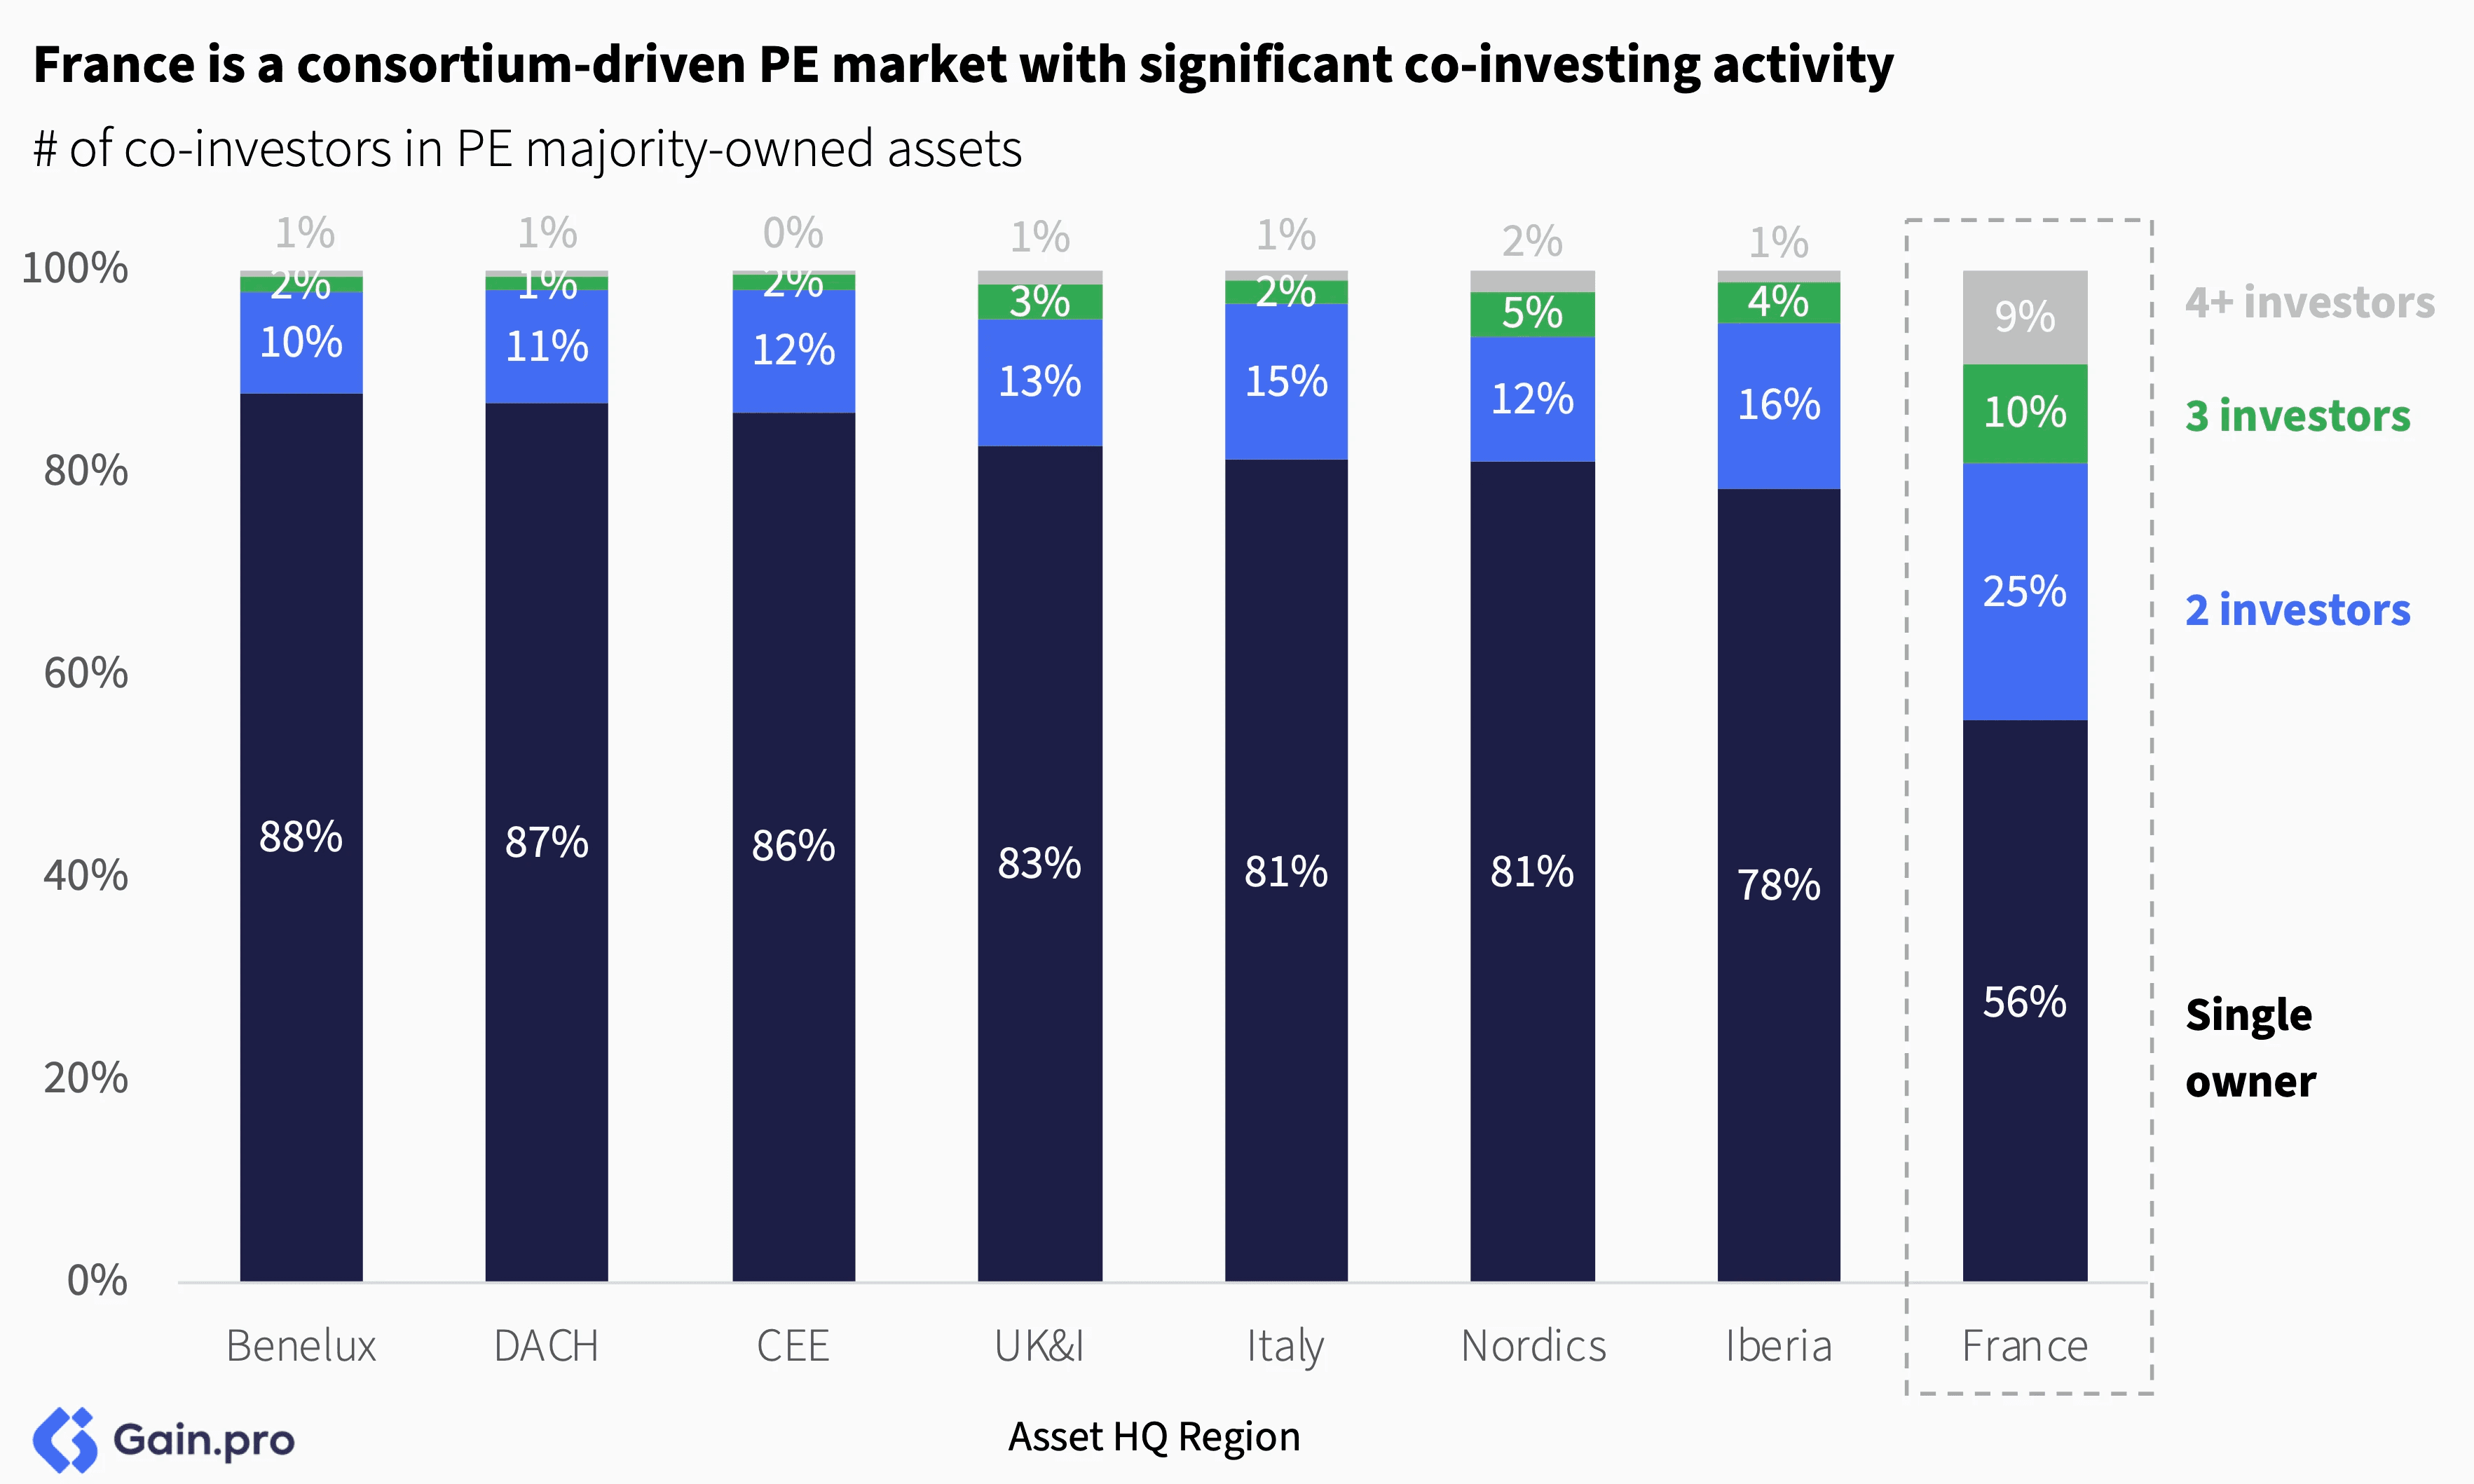
France is a consortium-driven PE market with significant co-investing activity. 44% of the majority PE-backed assets in France have 2 or more co-owners, with 19% having 3 or more.
Largest French Investors Investing in Europe
Ardian has emerged as the leading French investor, managing a total estimated EV of €30.9bn in Europe (including France). Closely following it are PAI Partners (managing an EV of €21.6bn) and Astorg (€12bn).
Other investors in the top 10 include Groupe Crédit Agricole (€11.3bn), Bpifrance (€11.2bn), Antin (€7.5bn), Naxicap (€6.3bn), Eurazeo (€6.2bn), Caisse des Dépôts et Consignations (CDC) Groupe (€5.2bn) and AXA Investment (€4.8bn). Collectively, the largest 50 French investors manage an estimated EV of €193bn in Europe with the top 10 alone managing €117bn (61%).
The largest French investors have a median portfolio EBITDA of €28.7m and manage 39 companies each. Over the last 6 years, they have bought nearly twice as many assets than they have sold. Specifically, there have been 1,911 new investments and 1,063 exits.
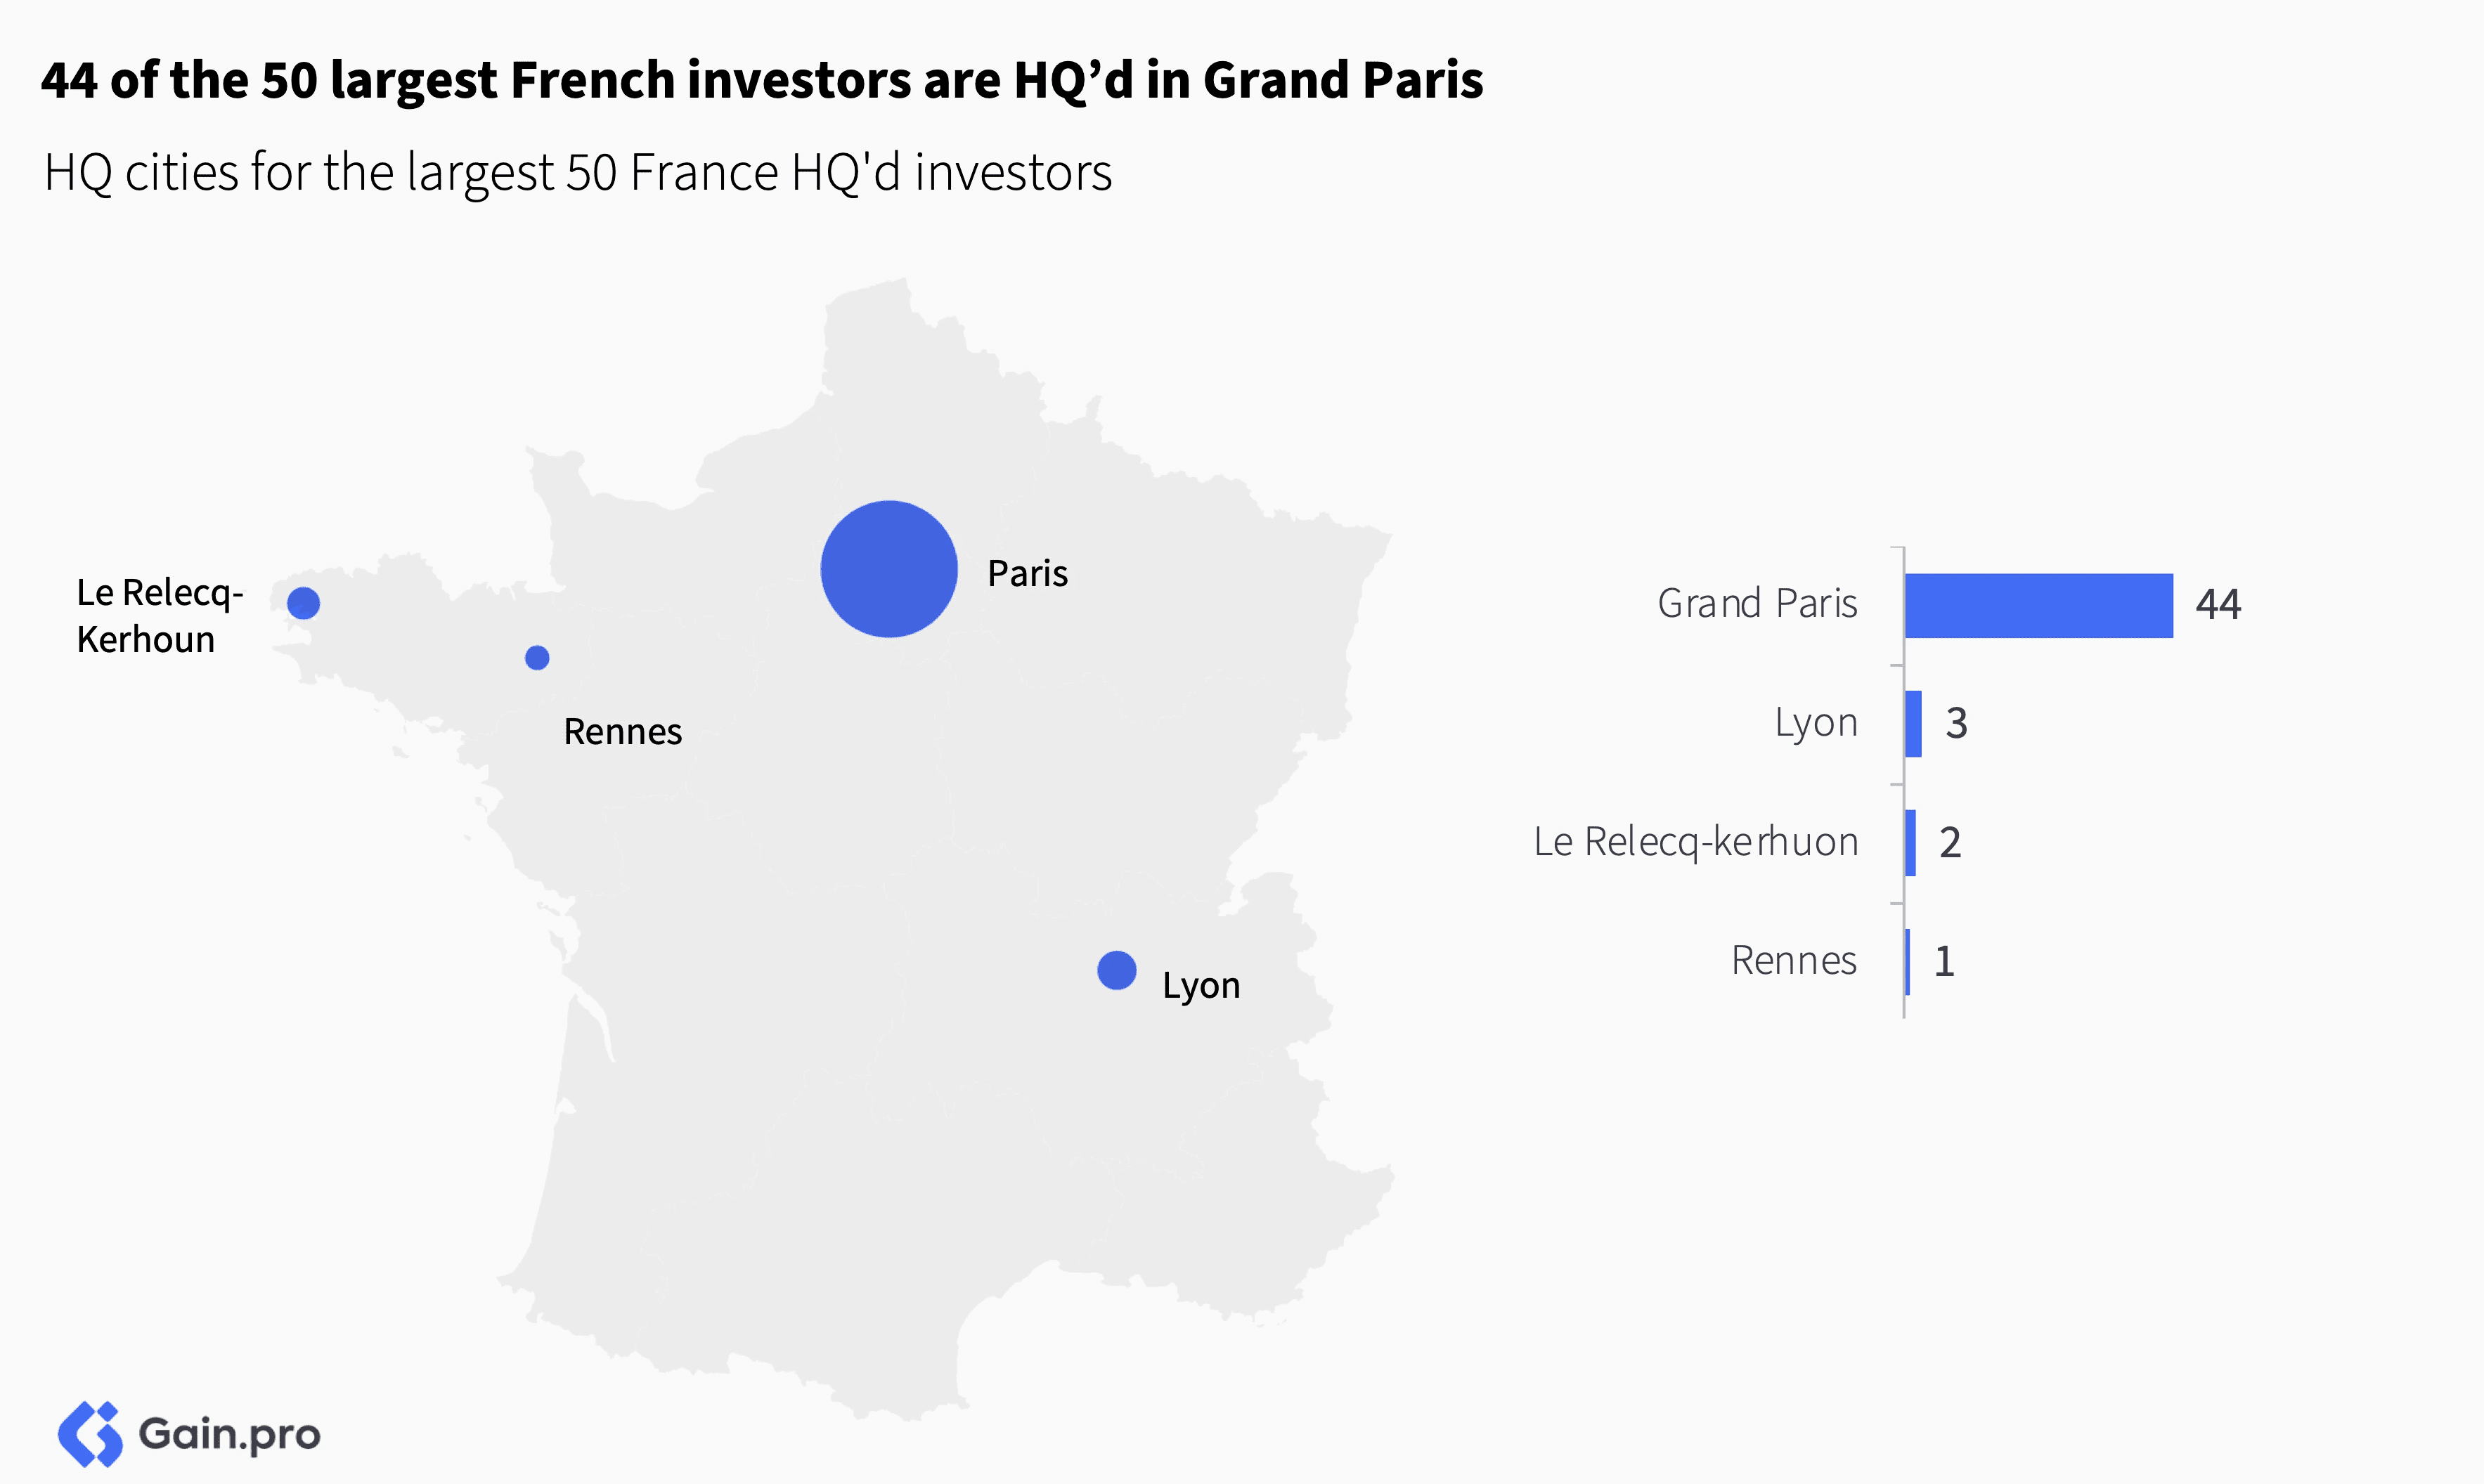
44 of the 50 largest French investors are HQ’d in Grand Paris. Those outside include ARCHIMED, Merieux Equity Partners and Evolem who are HQ’d in Lyon; Arkéa Capital and Crédit Mutuel Arkéa in Le Relecq-Kerhuon and Unexo in Rennes.
The portfolio of French investors is largely concentrated within France, with only a handful investing abroad meaningfully. Those with >50% of their portfolio abroad include PAI Partners (#2), Astorg (#3), Antin (#6), Rothschild Five Arrows (#12), InfraVia Capital Partners (#19), Keensight Capital (#23) and Chequers Capital (#26). Astorg, Antin and Rothschild jump out as those focused more on the UK (>30% of their portfolio).
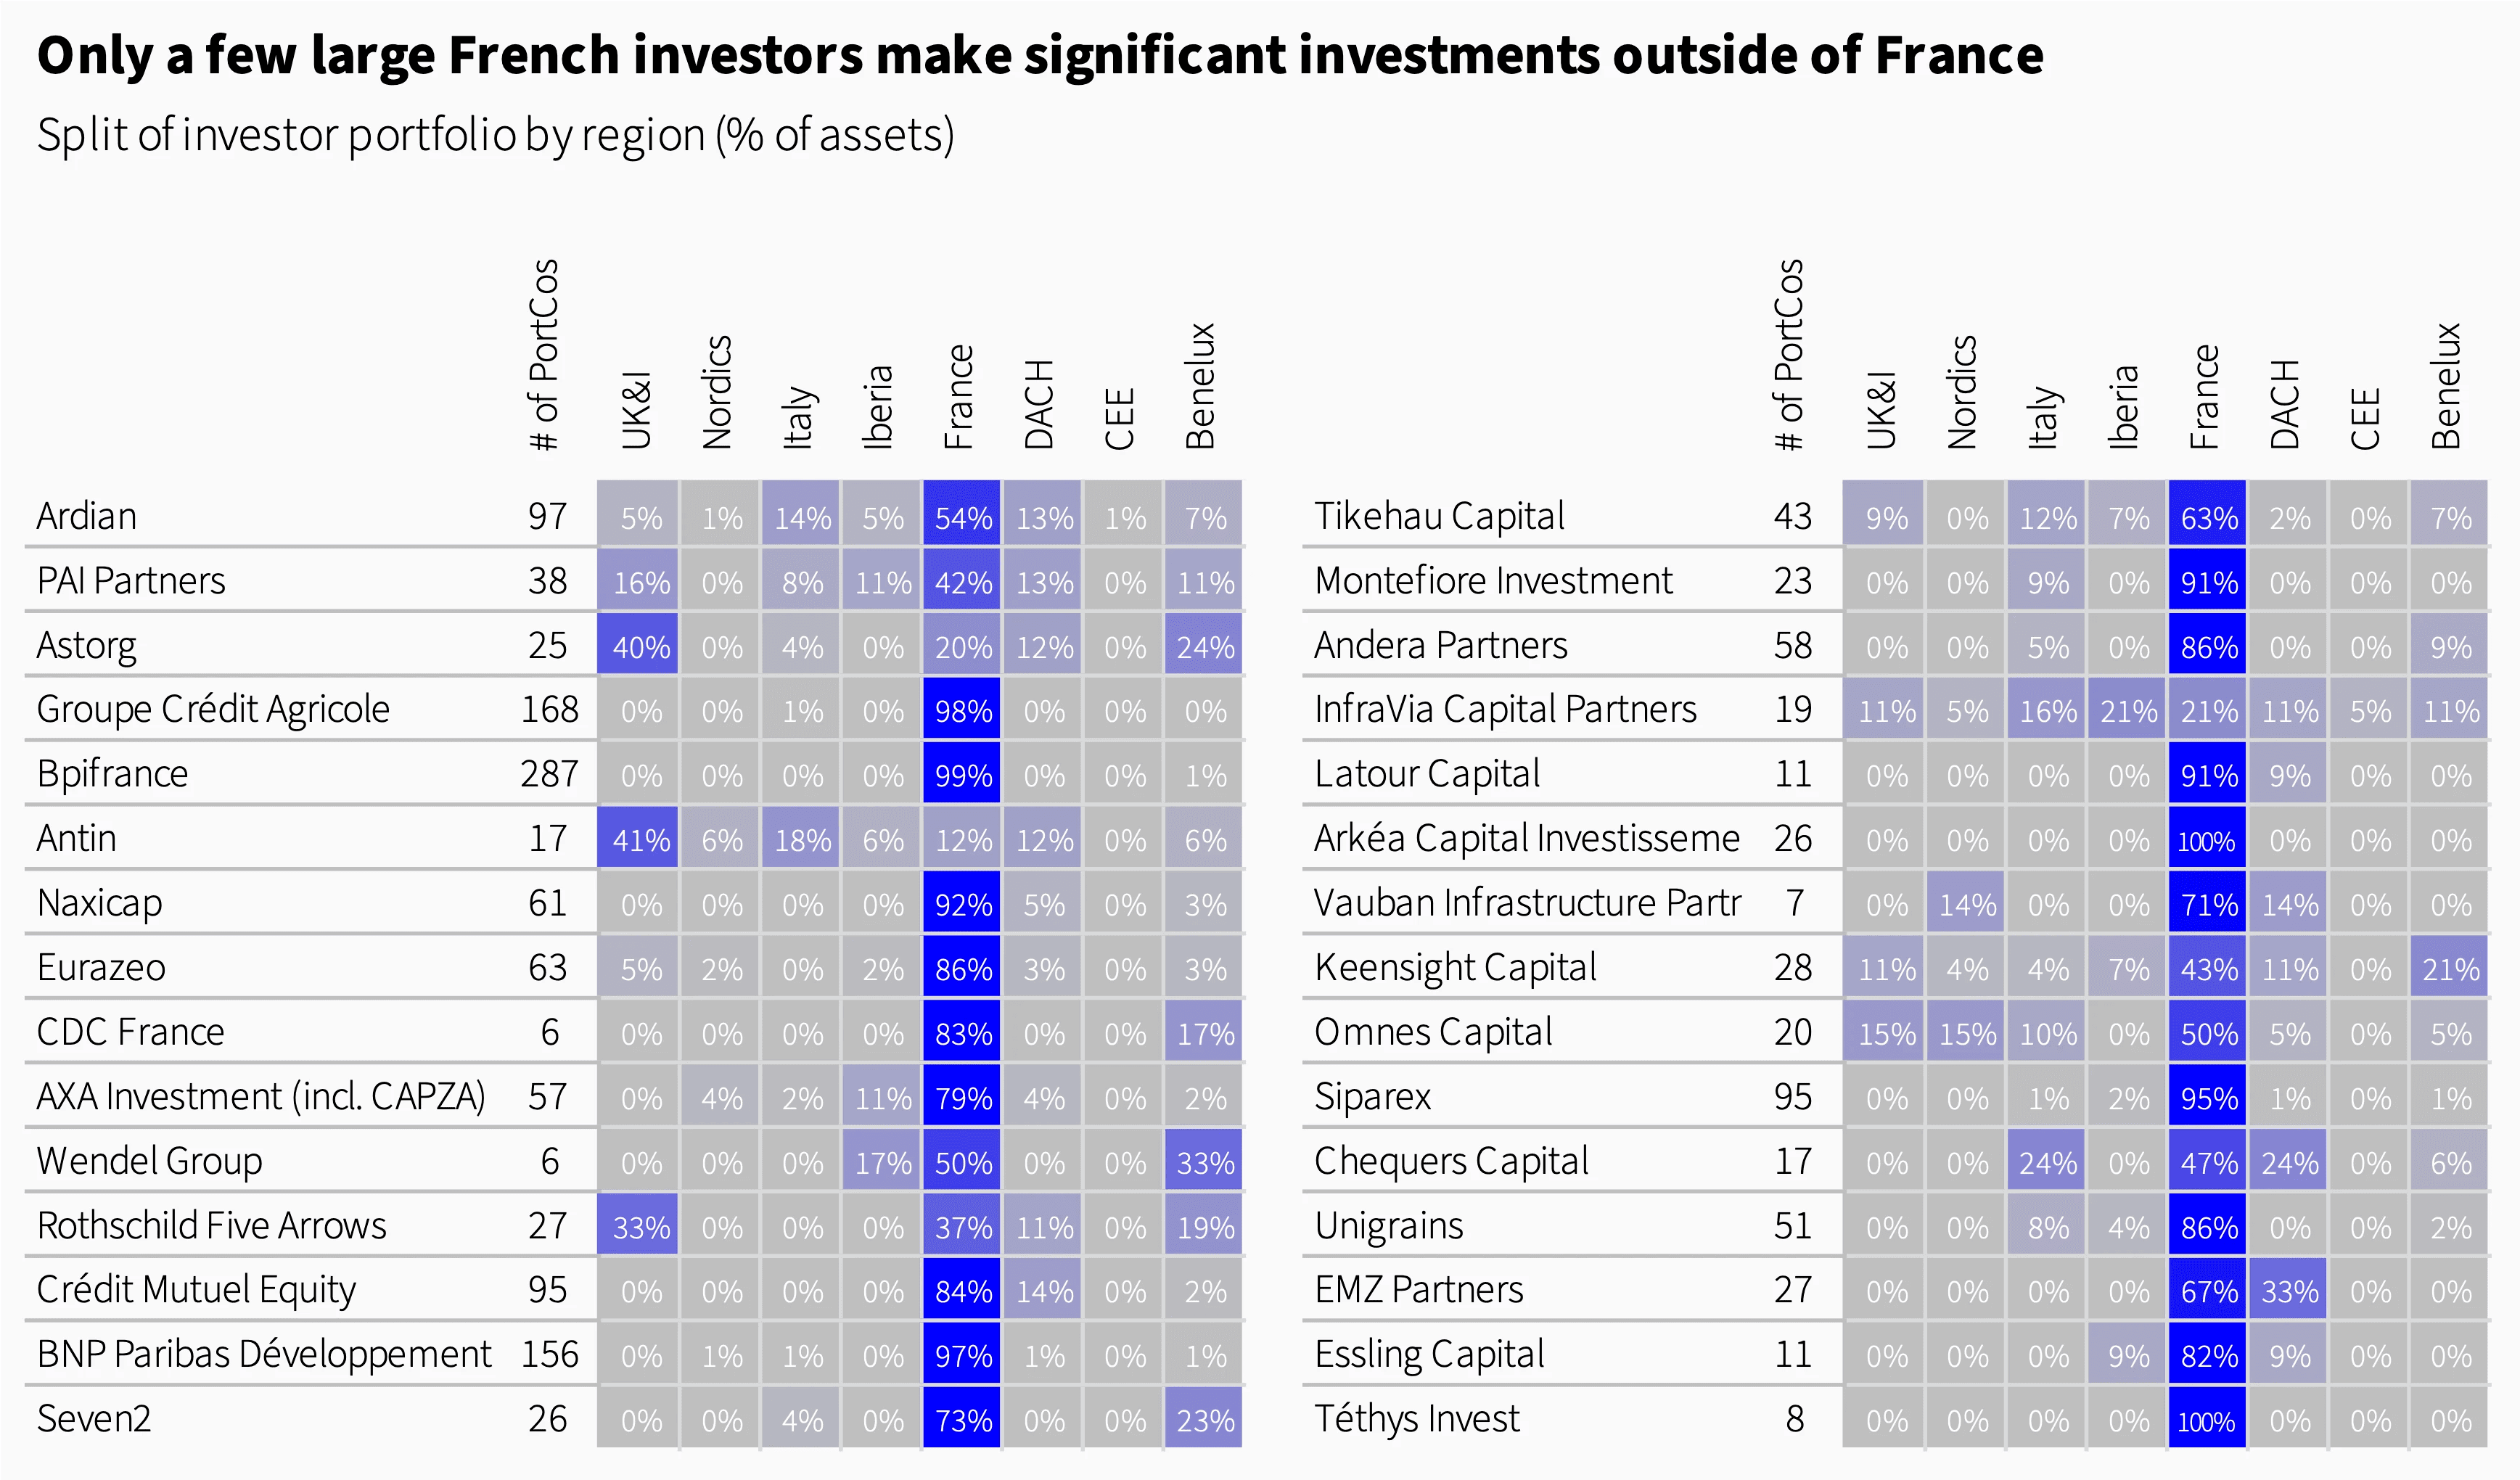
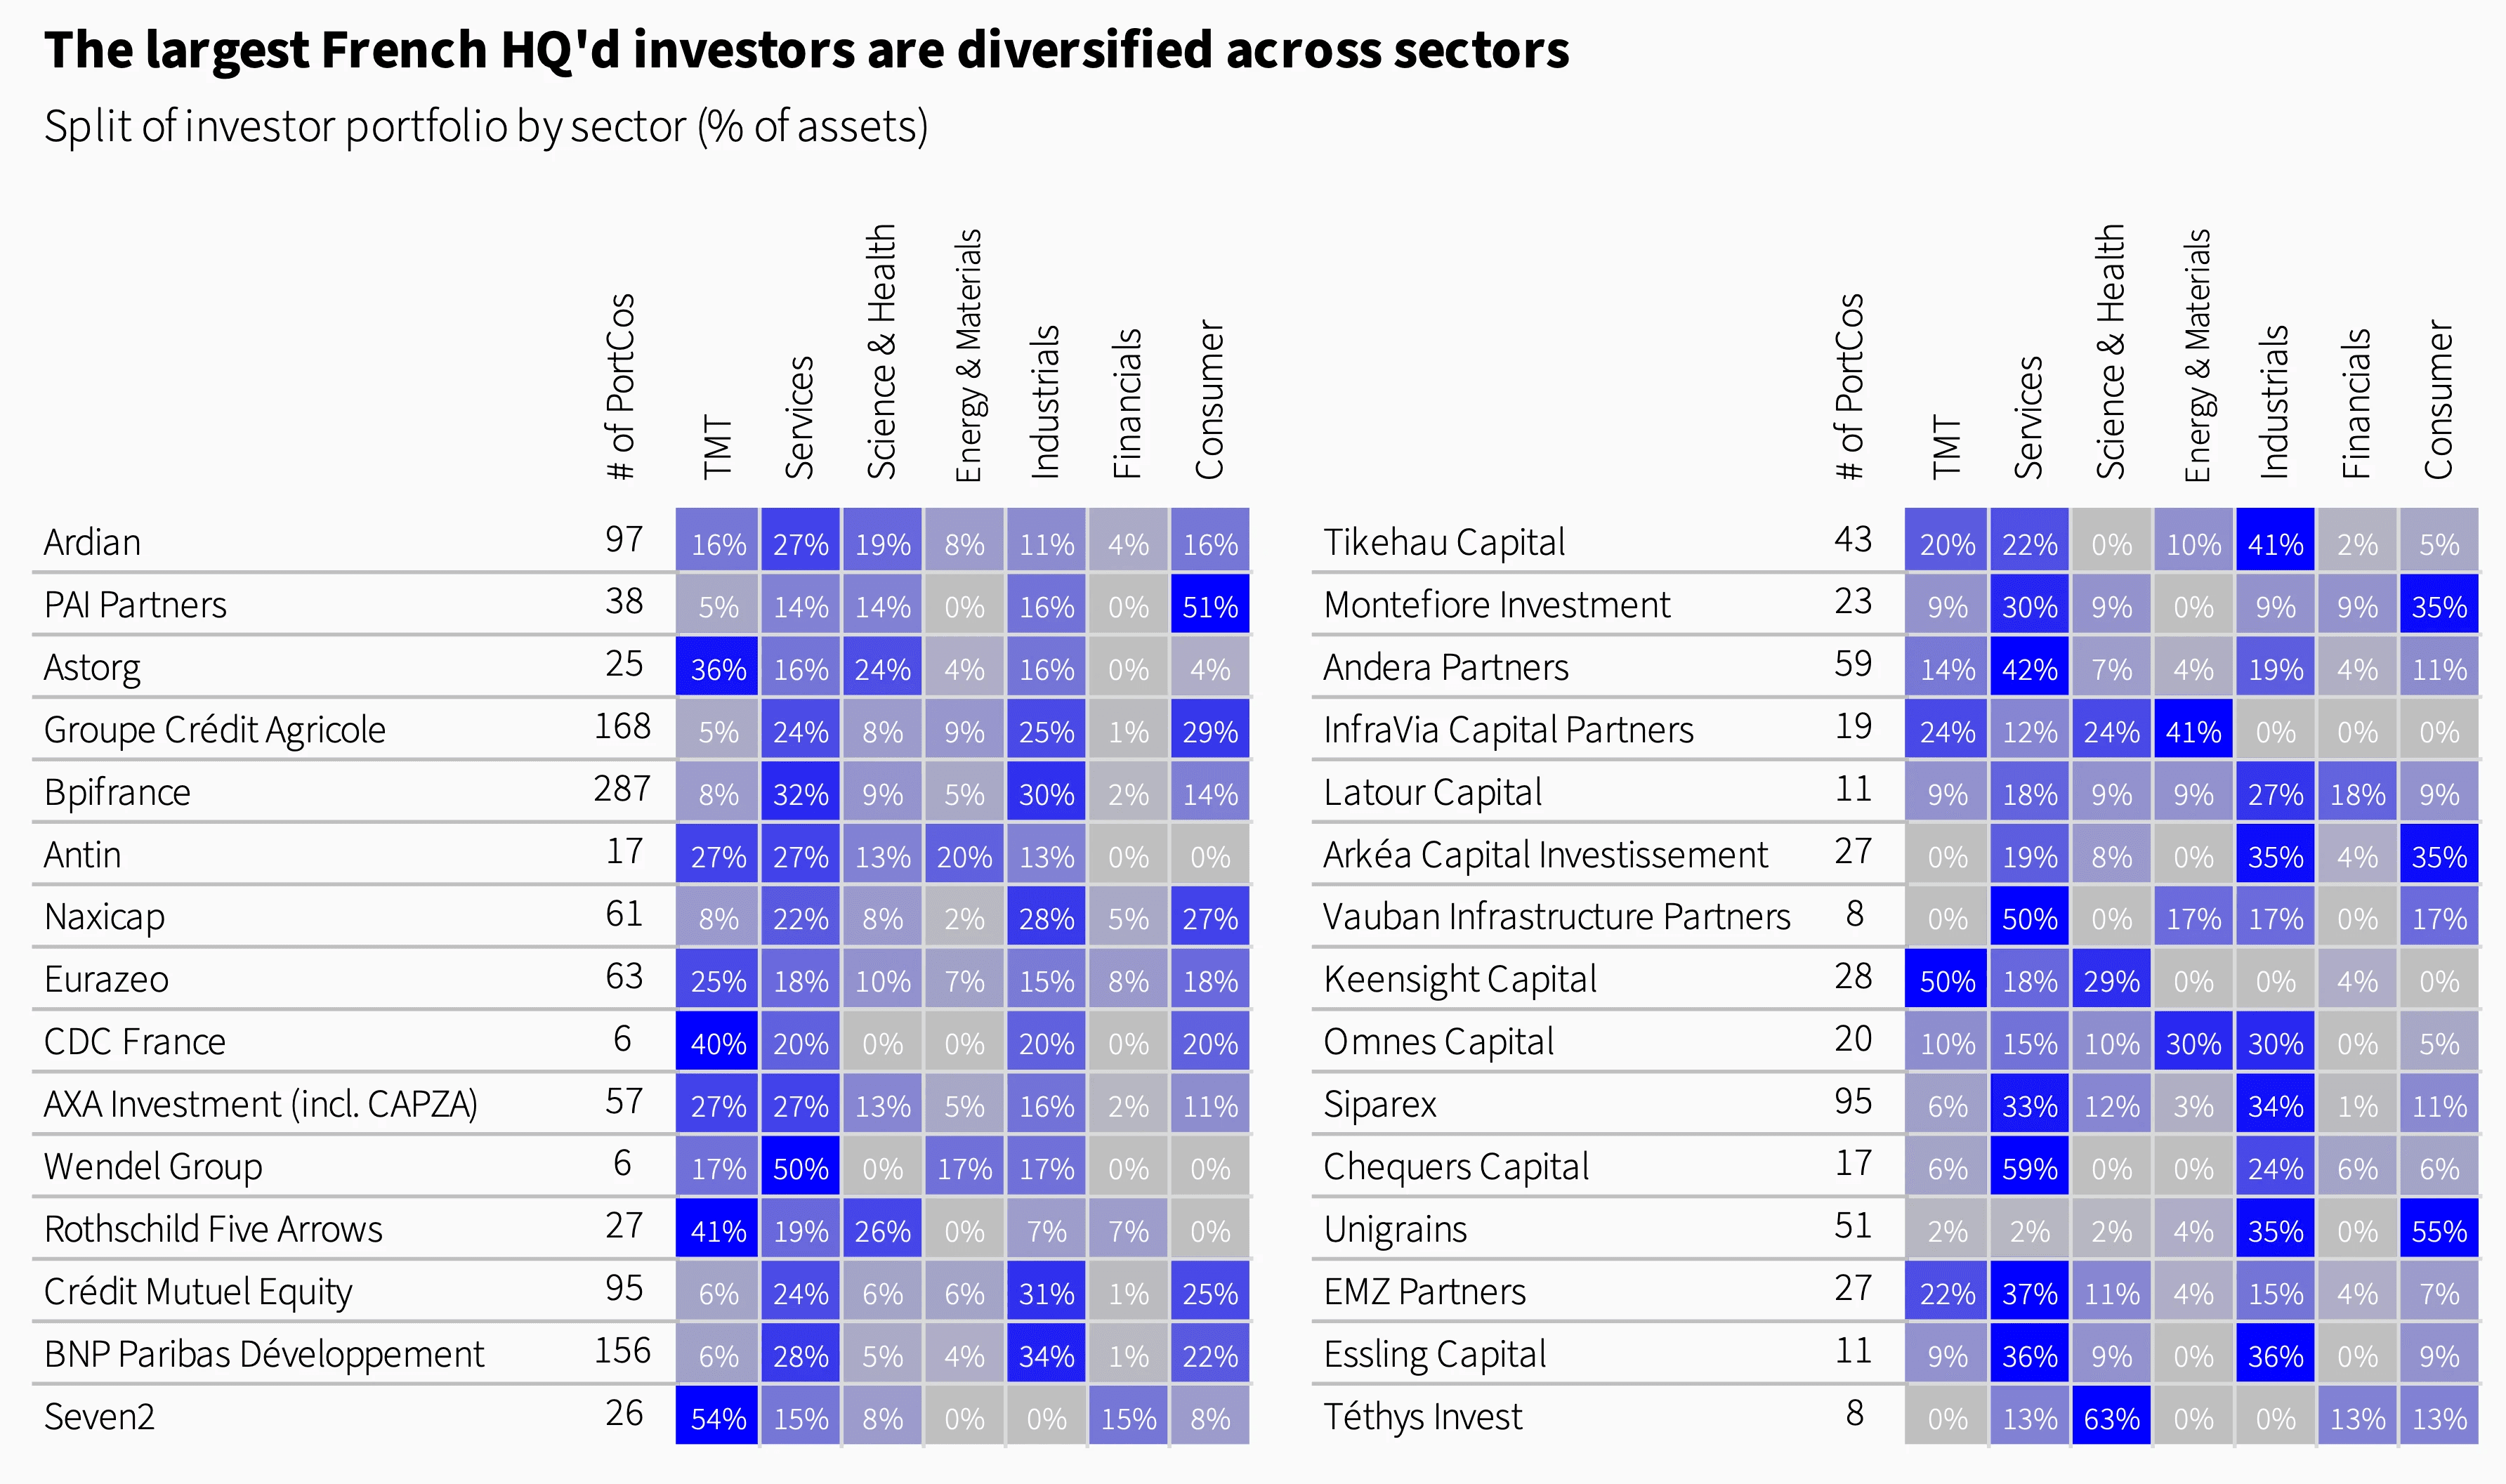
By sector, the portfolio of the largest French investors is quite diversified. On average, they allocate 26% of their portfolio to Services, followed by 20% to Industrials and 17% to TMT. Only 5 investors have >50% of their portfolio in one sector: PAI Partners (51% in Consumer), Seven2 (54% in TMT), Chequers Capital (59% in Services), Unigrains (55% in Consumer) and Téthys Invest (63% in Science & Health).
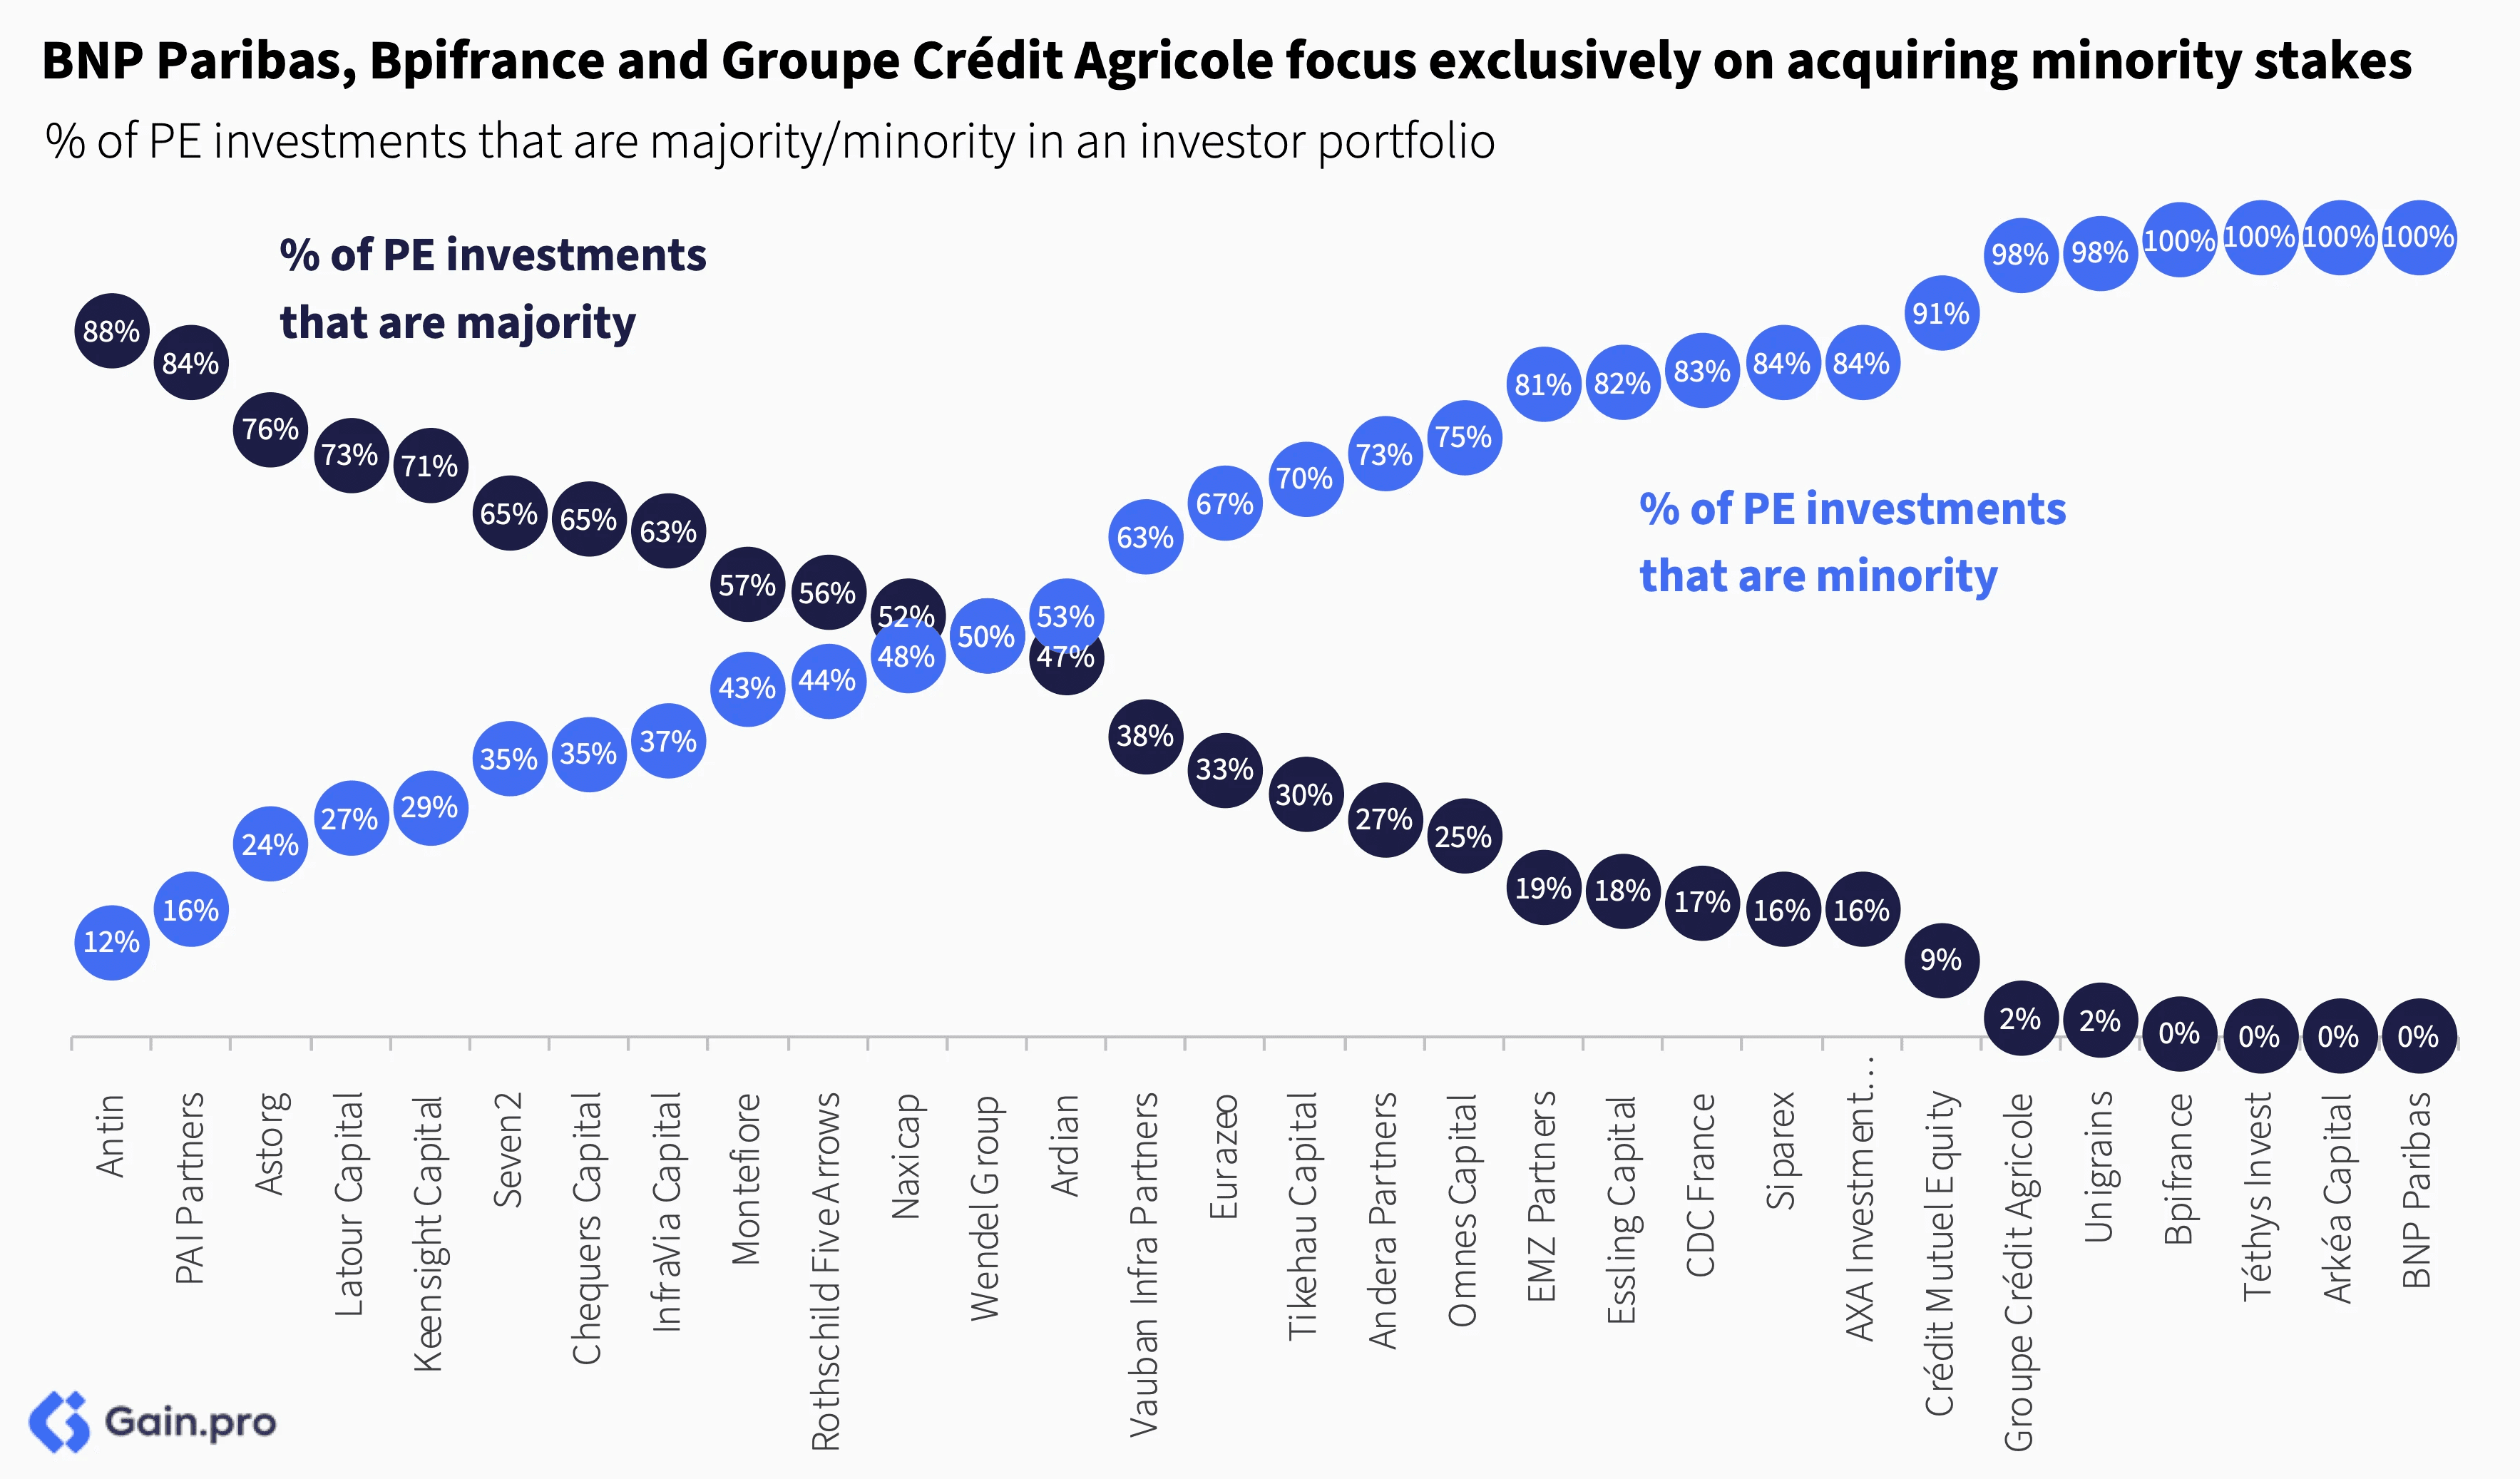
The preference for minority versus majority stakes differs significantly across investors. BNP Paribas, Bpifrance and Groupe Crédit Agricole focus almost exclusively on acquiring minority stakes. On the other hand, Antin, PAI Partners and Astorg are more majority-focused.
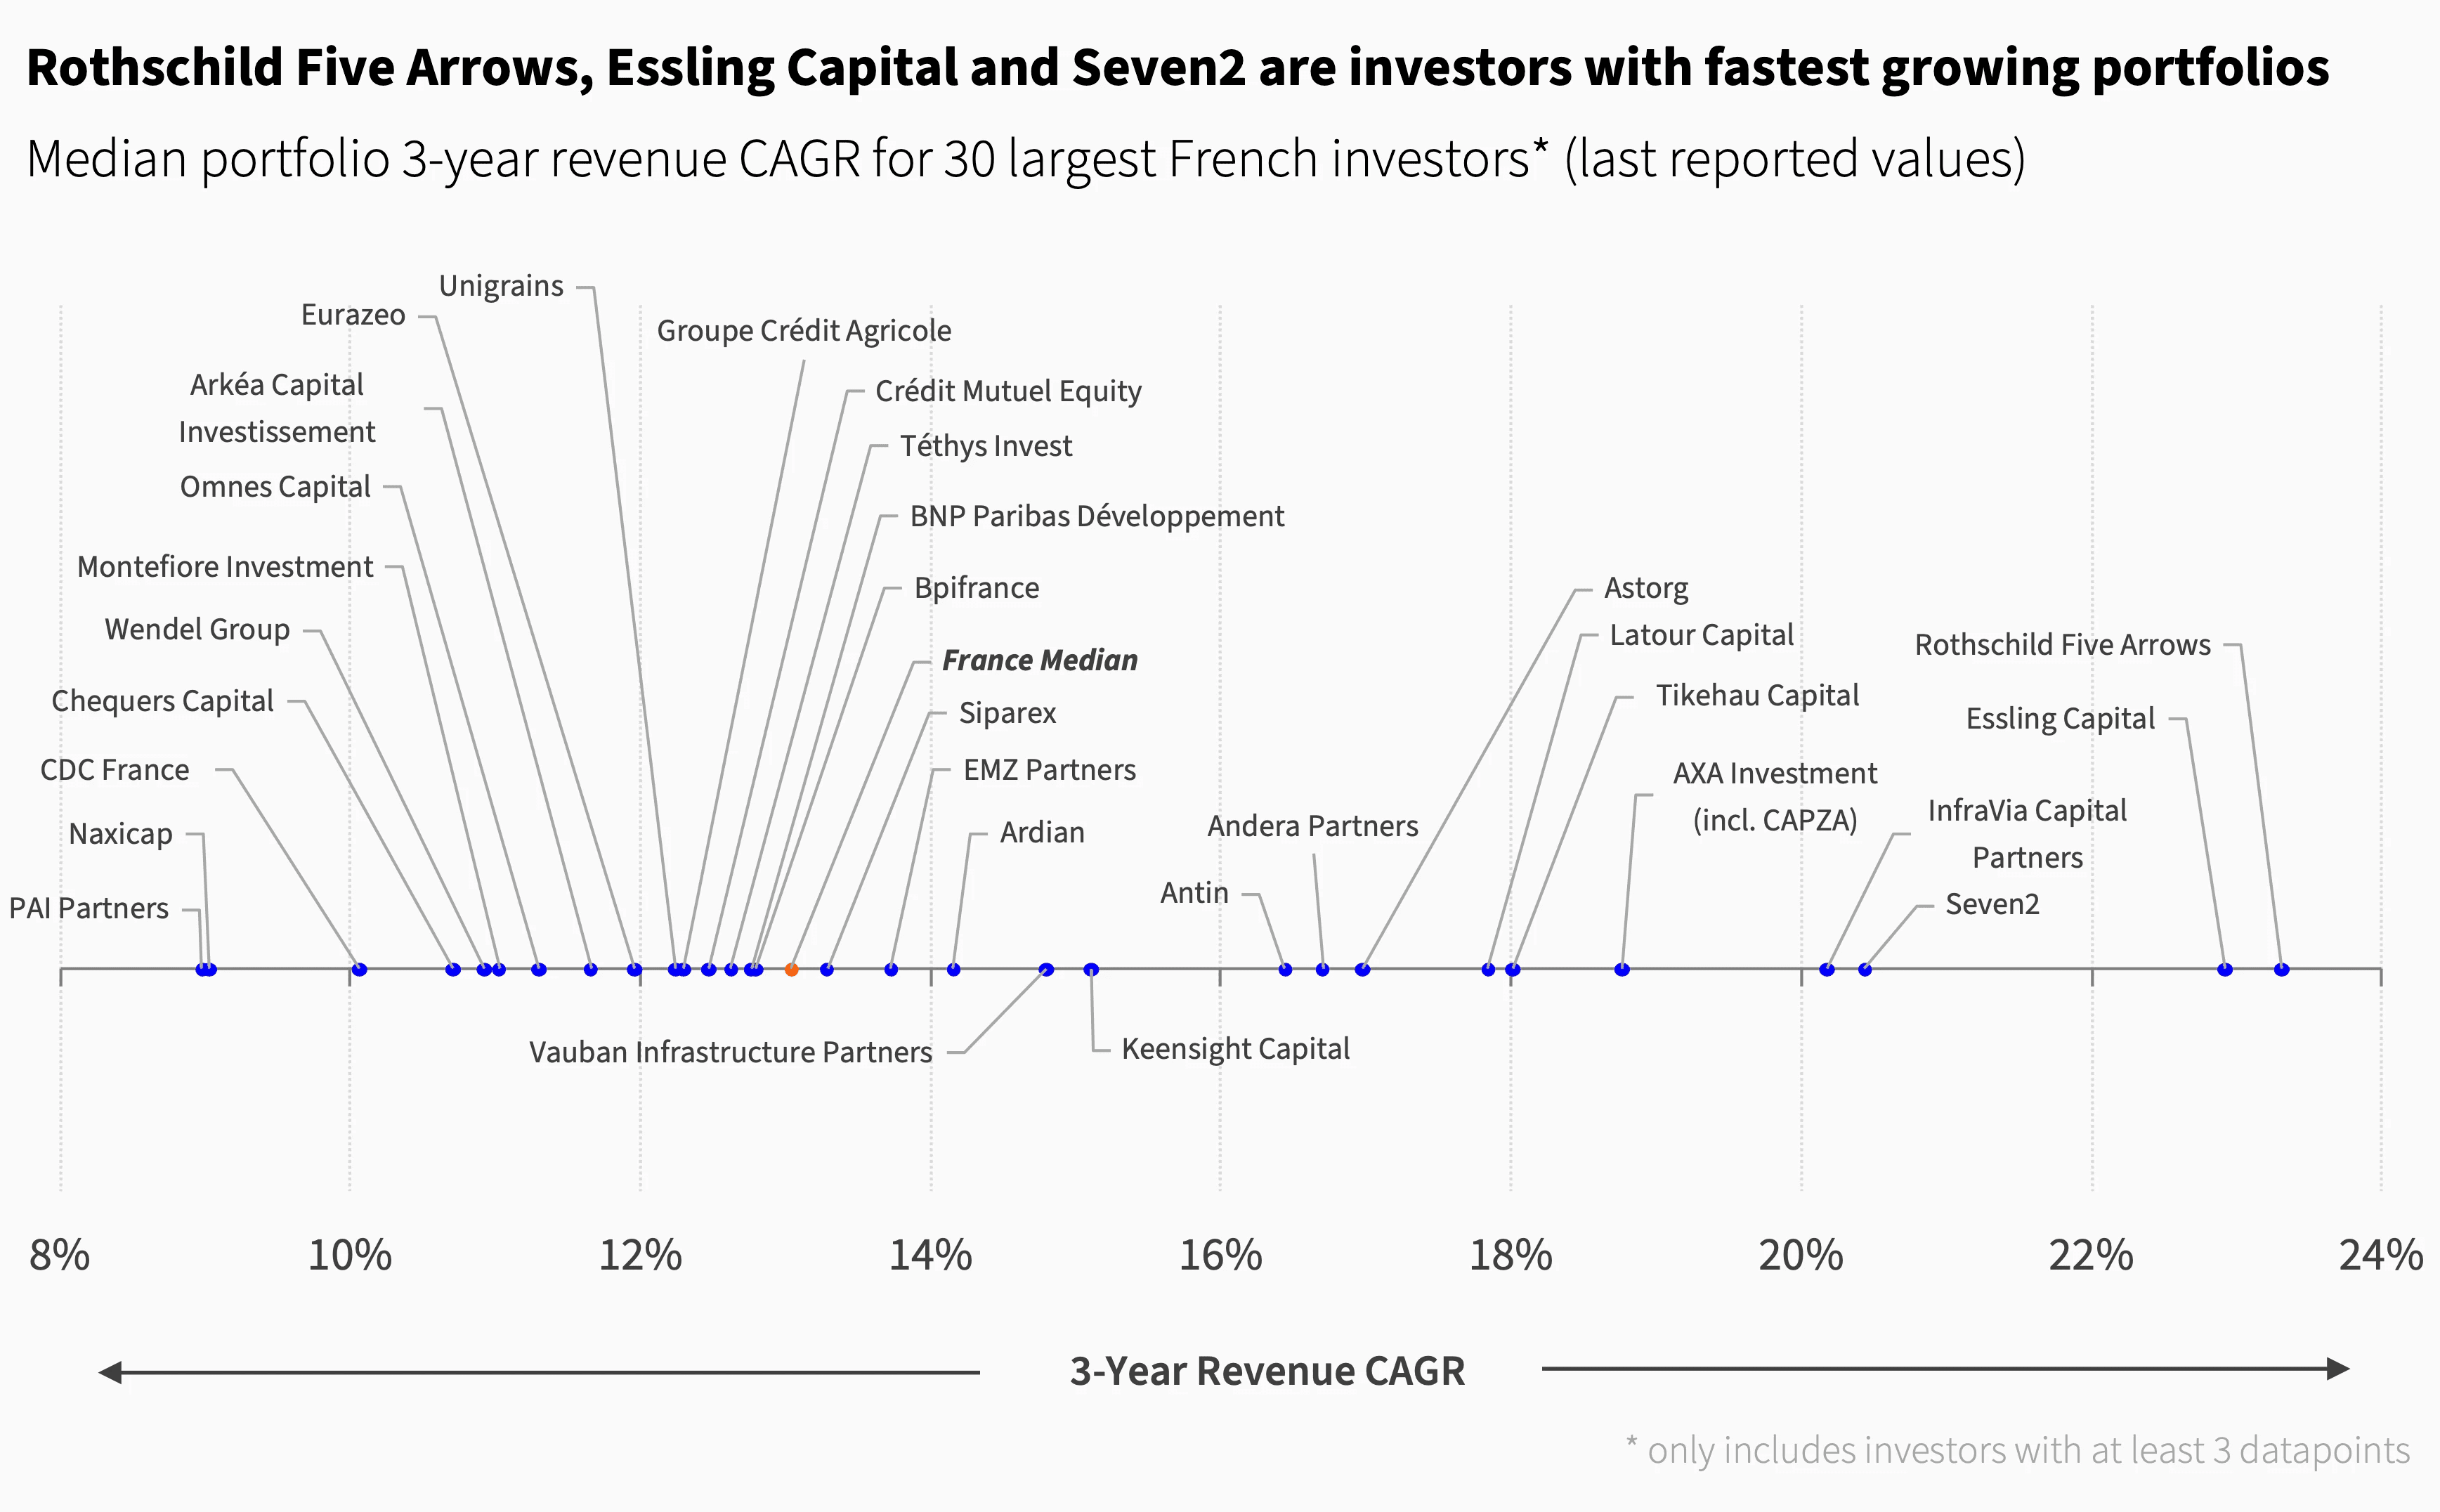
Rothschild Five Arrows, Essling Capital, Seven2, InfraVia Capital Partners and AXA Investment are investors with the fastest-growing portfolios. Essling Capital and Rothschild Five Arrows have one of the most acquisitive portfolios, while Seven2 is titled more toward the fast-growing TMT sector.
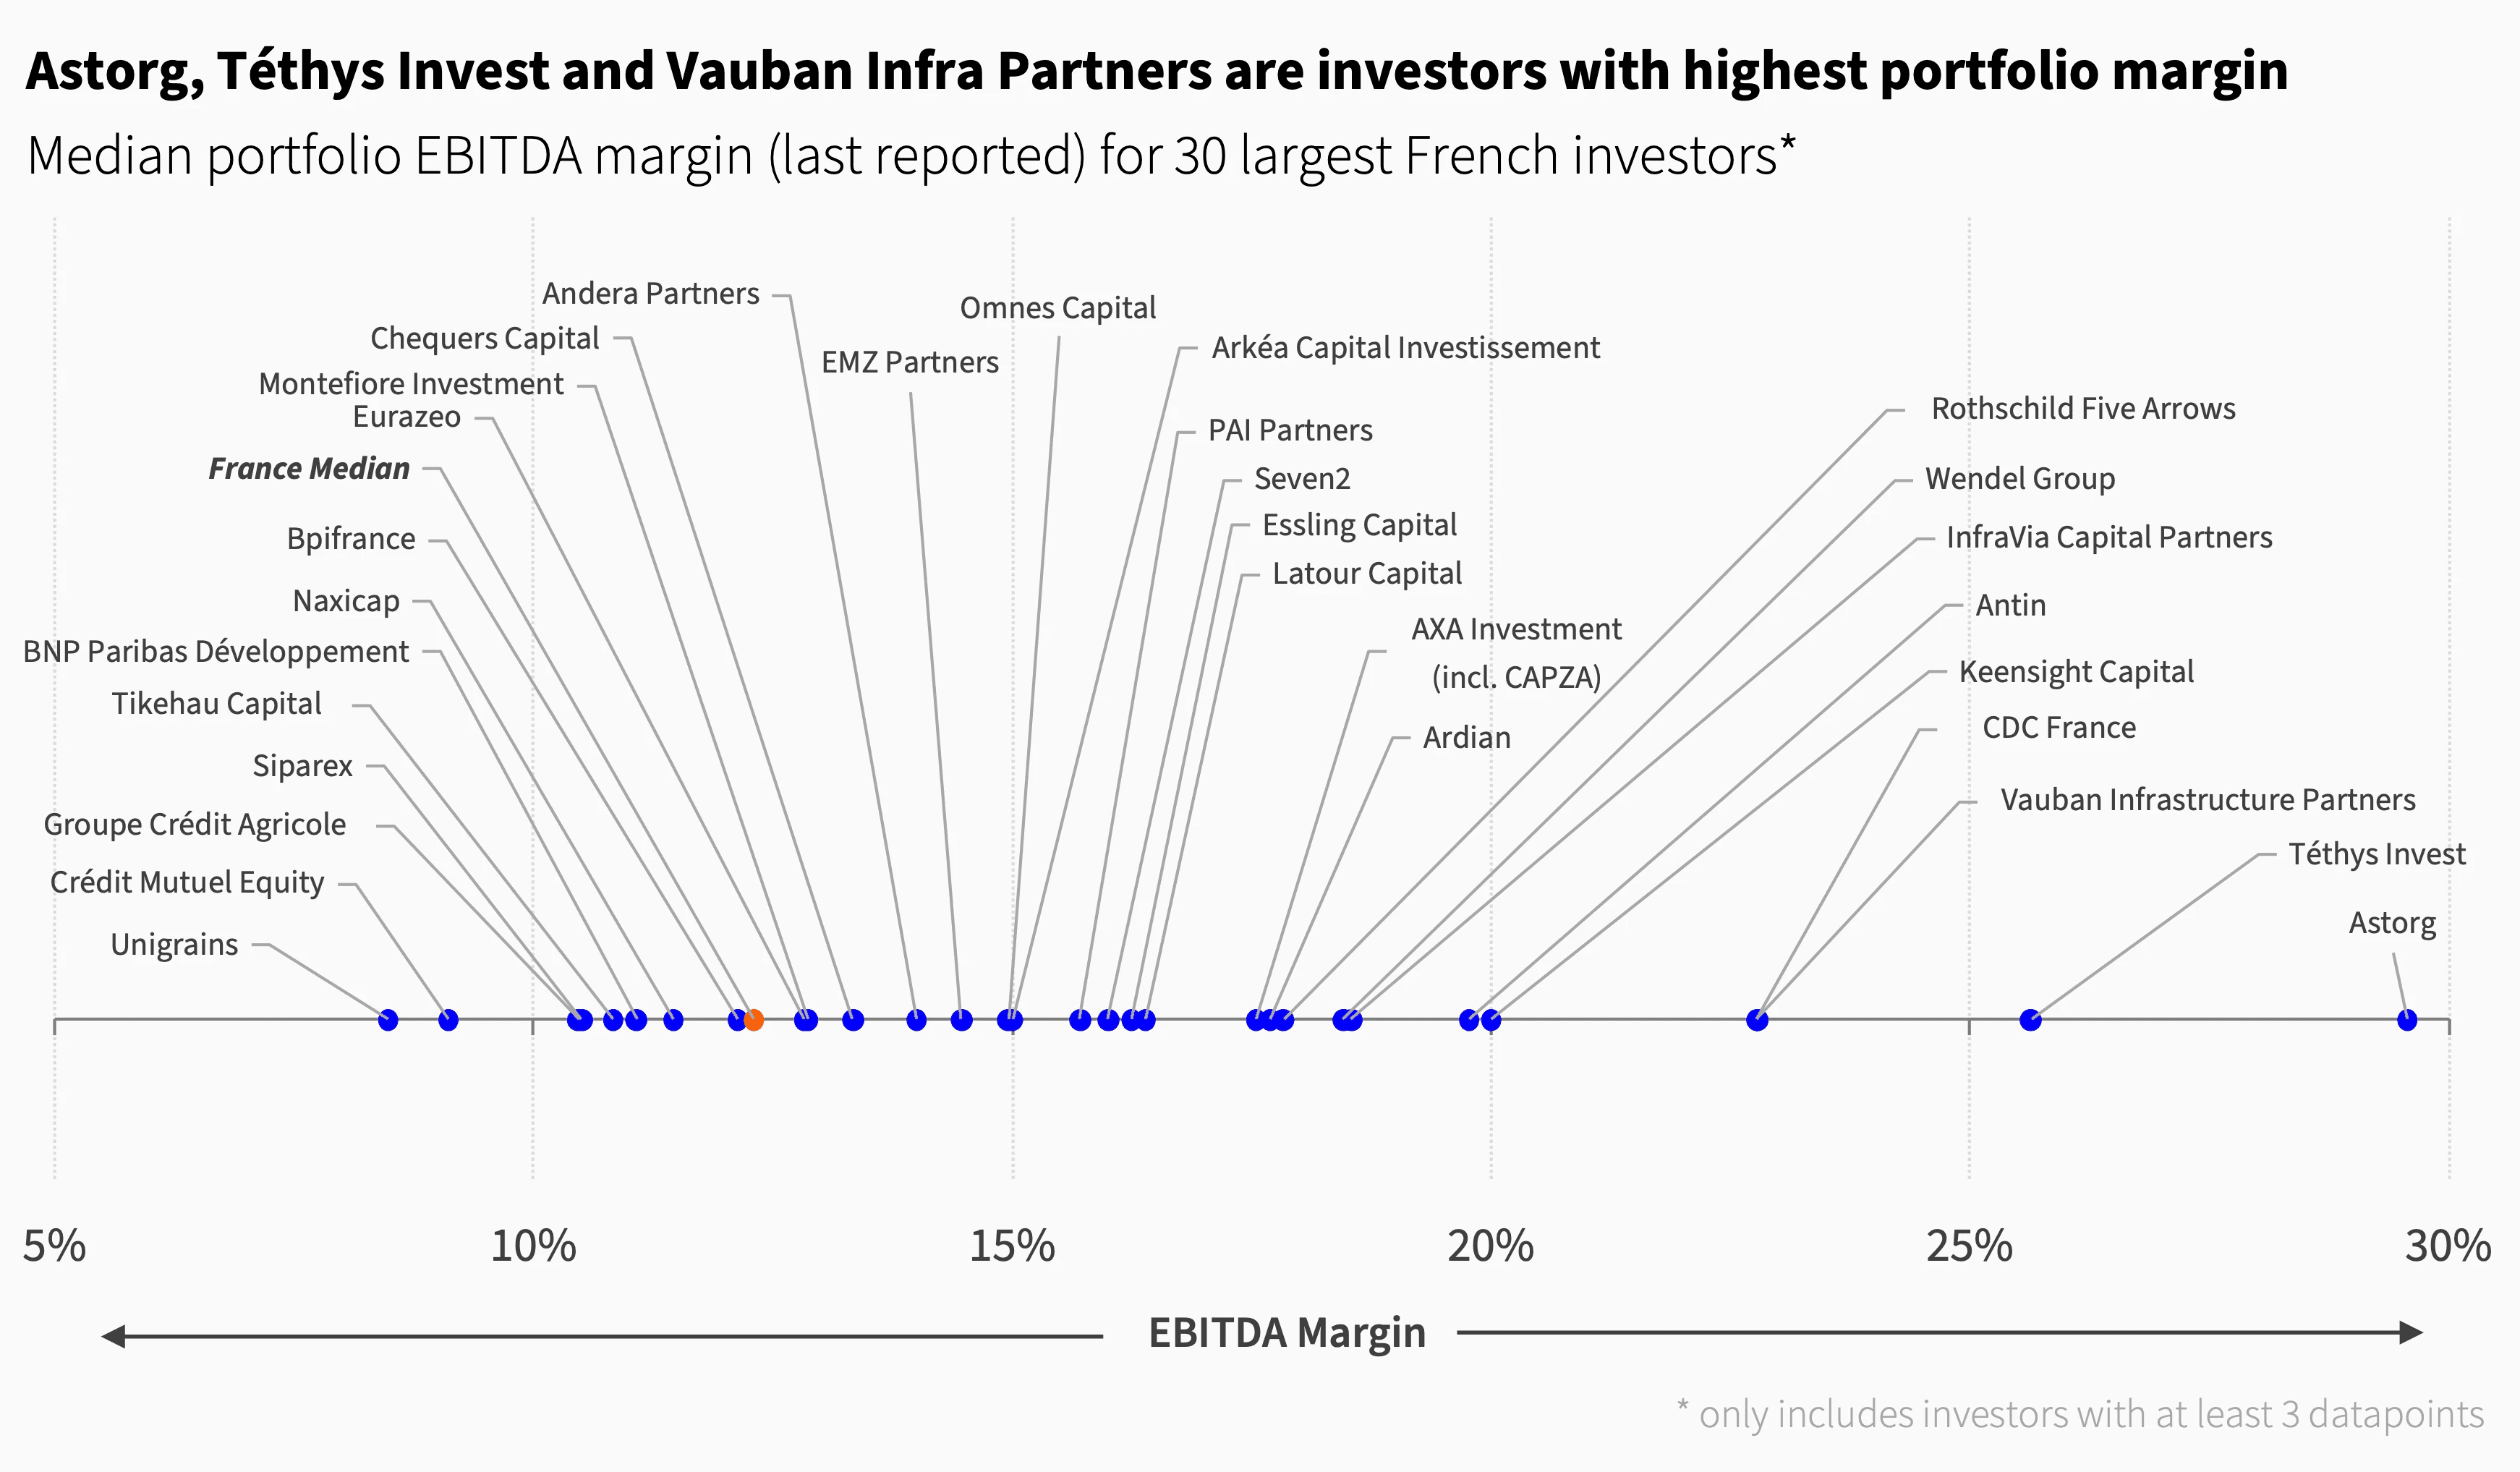
Astorg, Téthys Invest and Vauban Infrastructure Partners are investors with the highest median portfolio EBITDA margin. It’s interesting to note that almost all large French investors have a median EBITDA margin of 10% or more.
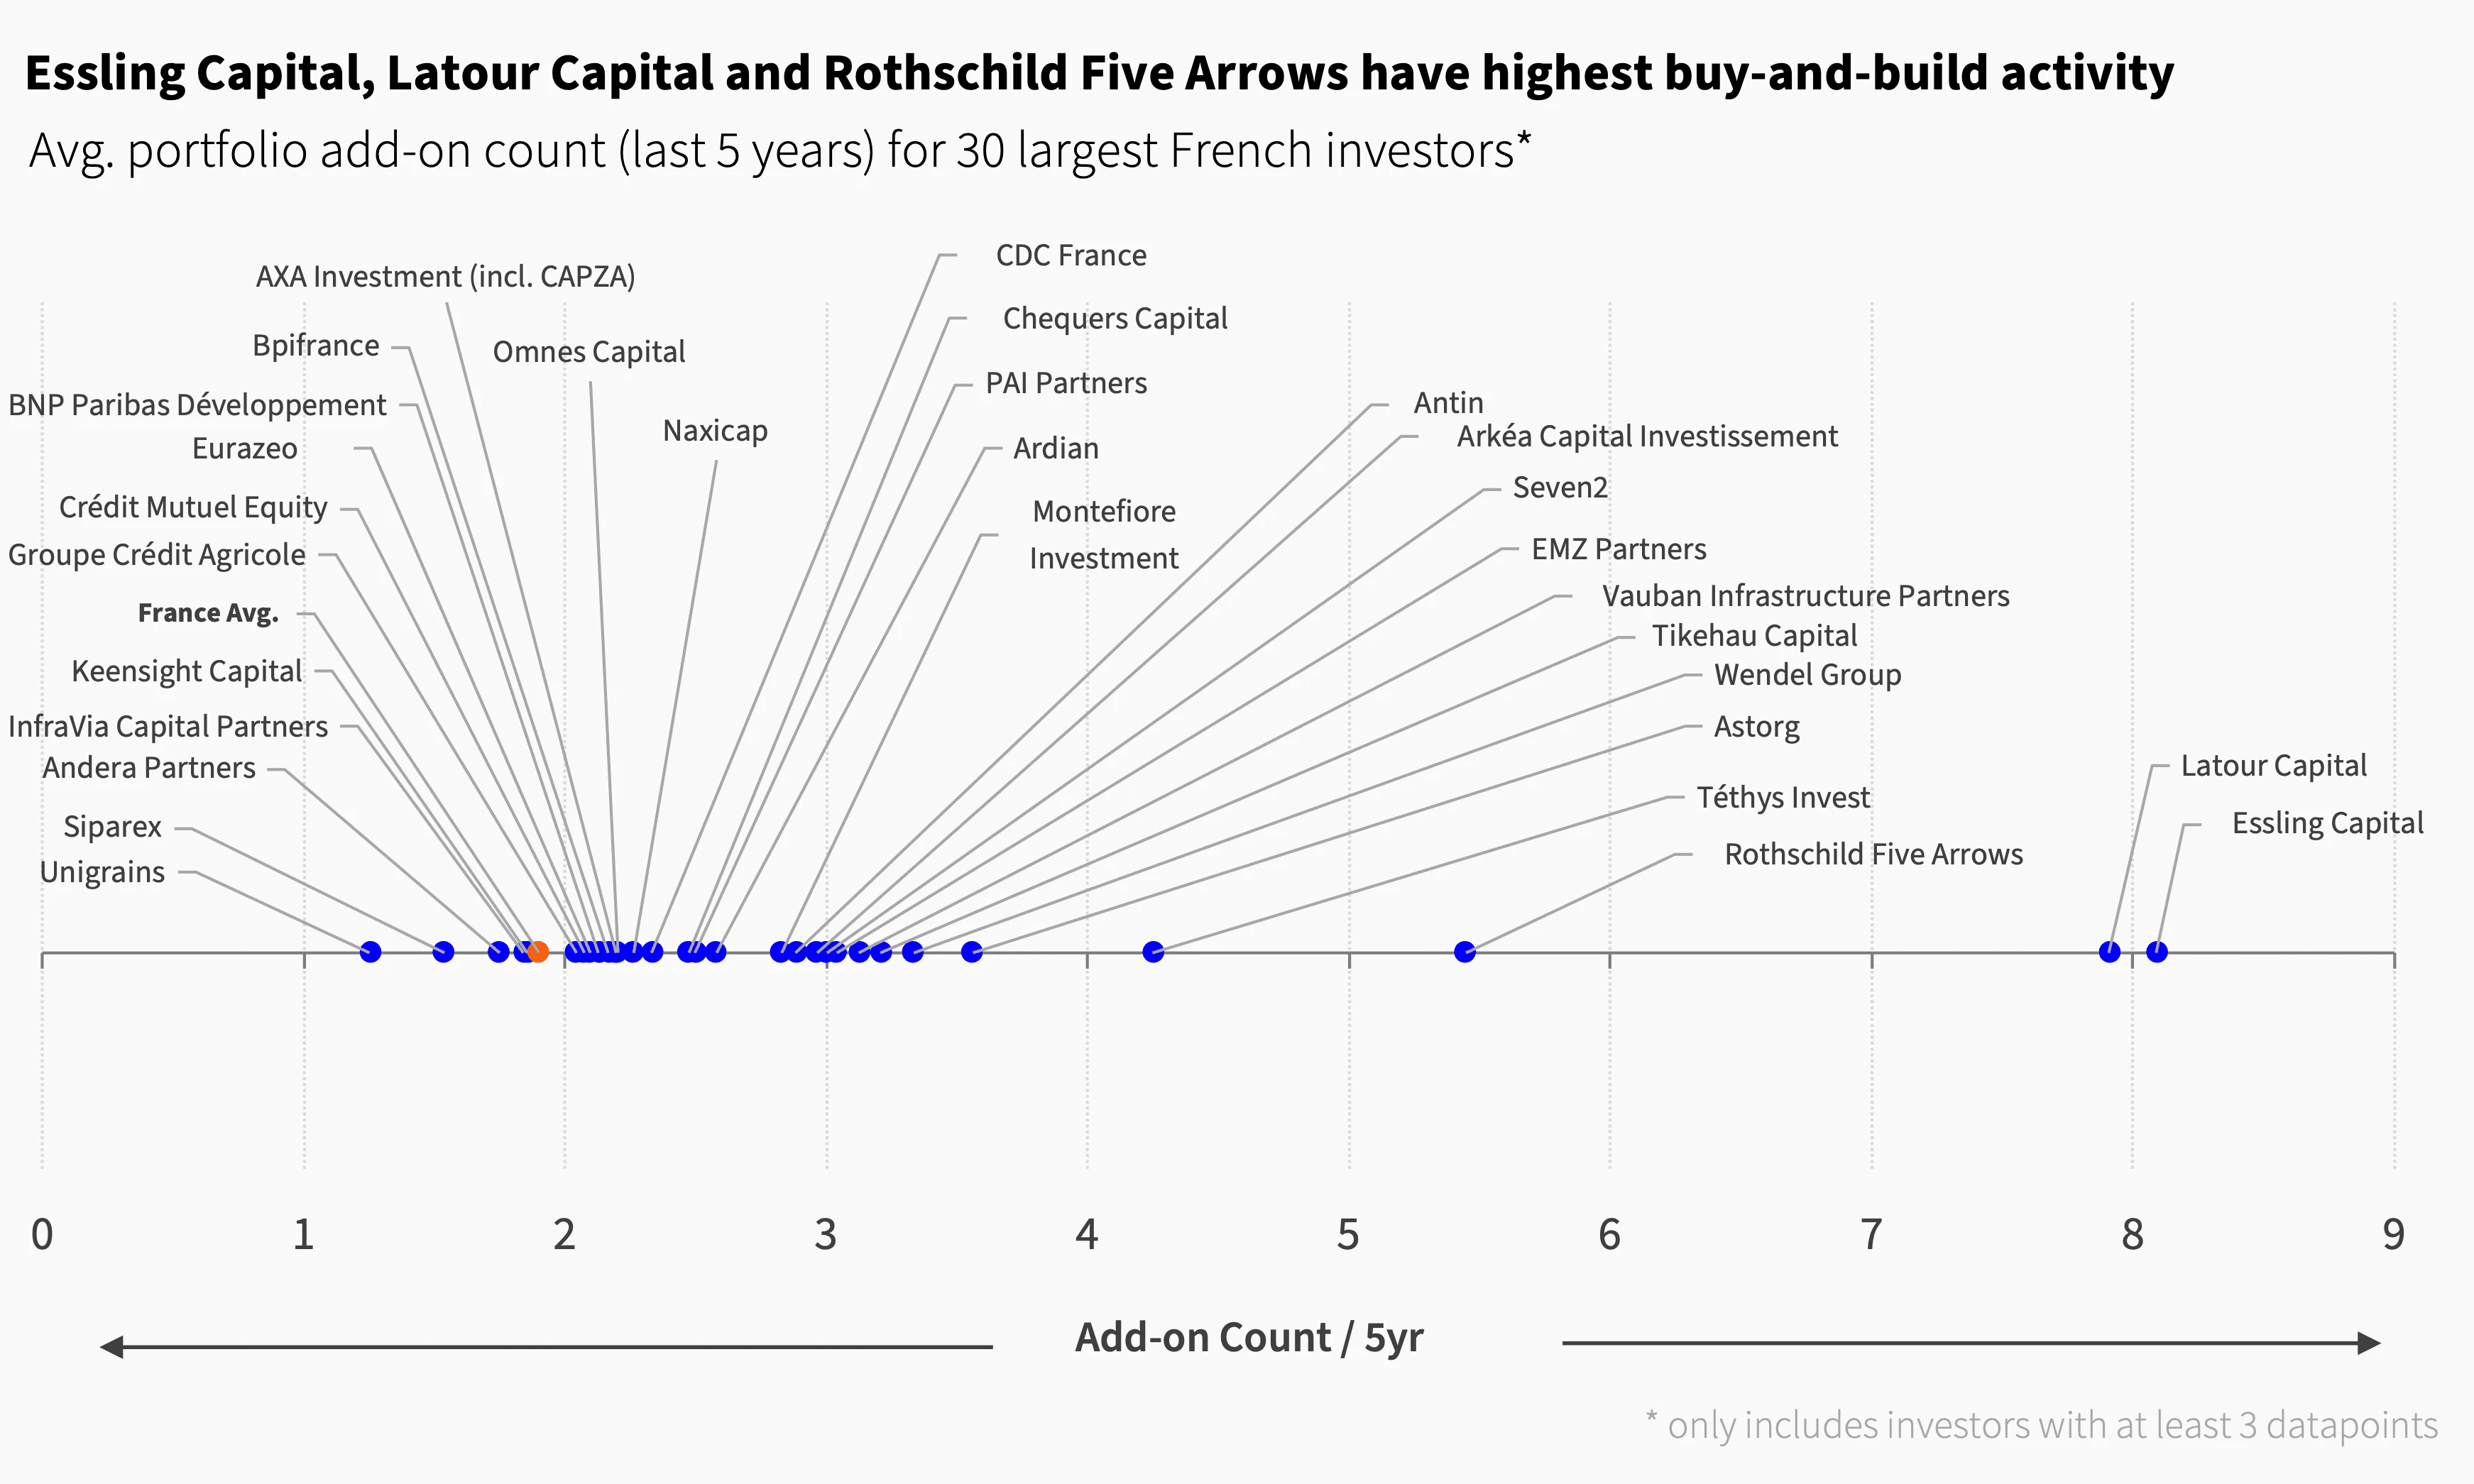
Essling Capital, Latour Capital, Rothschild Five Arrows, Téthys Invest and Astorg are investors with the highest buy-and-build activity in their portfolios. Most large French investors employ a buy-and-build strategy as a value-creation tool to varying degrees.
Chapter 04: PE Portfolio Insights
Sector Stats
Services is the largest sector in France accounting for 27% of PE assets, followed by Industrials (23%) and Consumer (20%). Notably, France remains underrepresented in TMT compared to the Rest of Europe, both in terms of PE-owned assets and current PE deal activity.
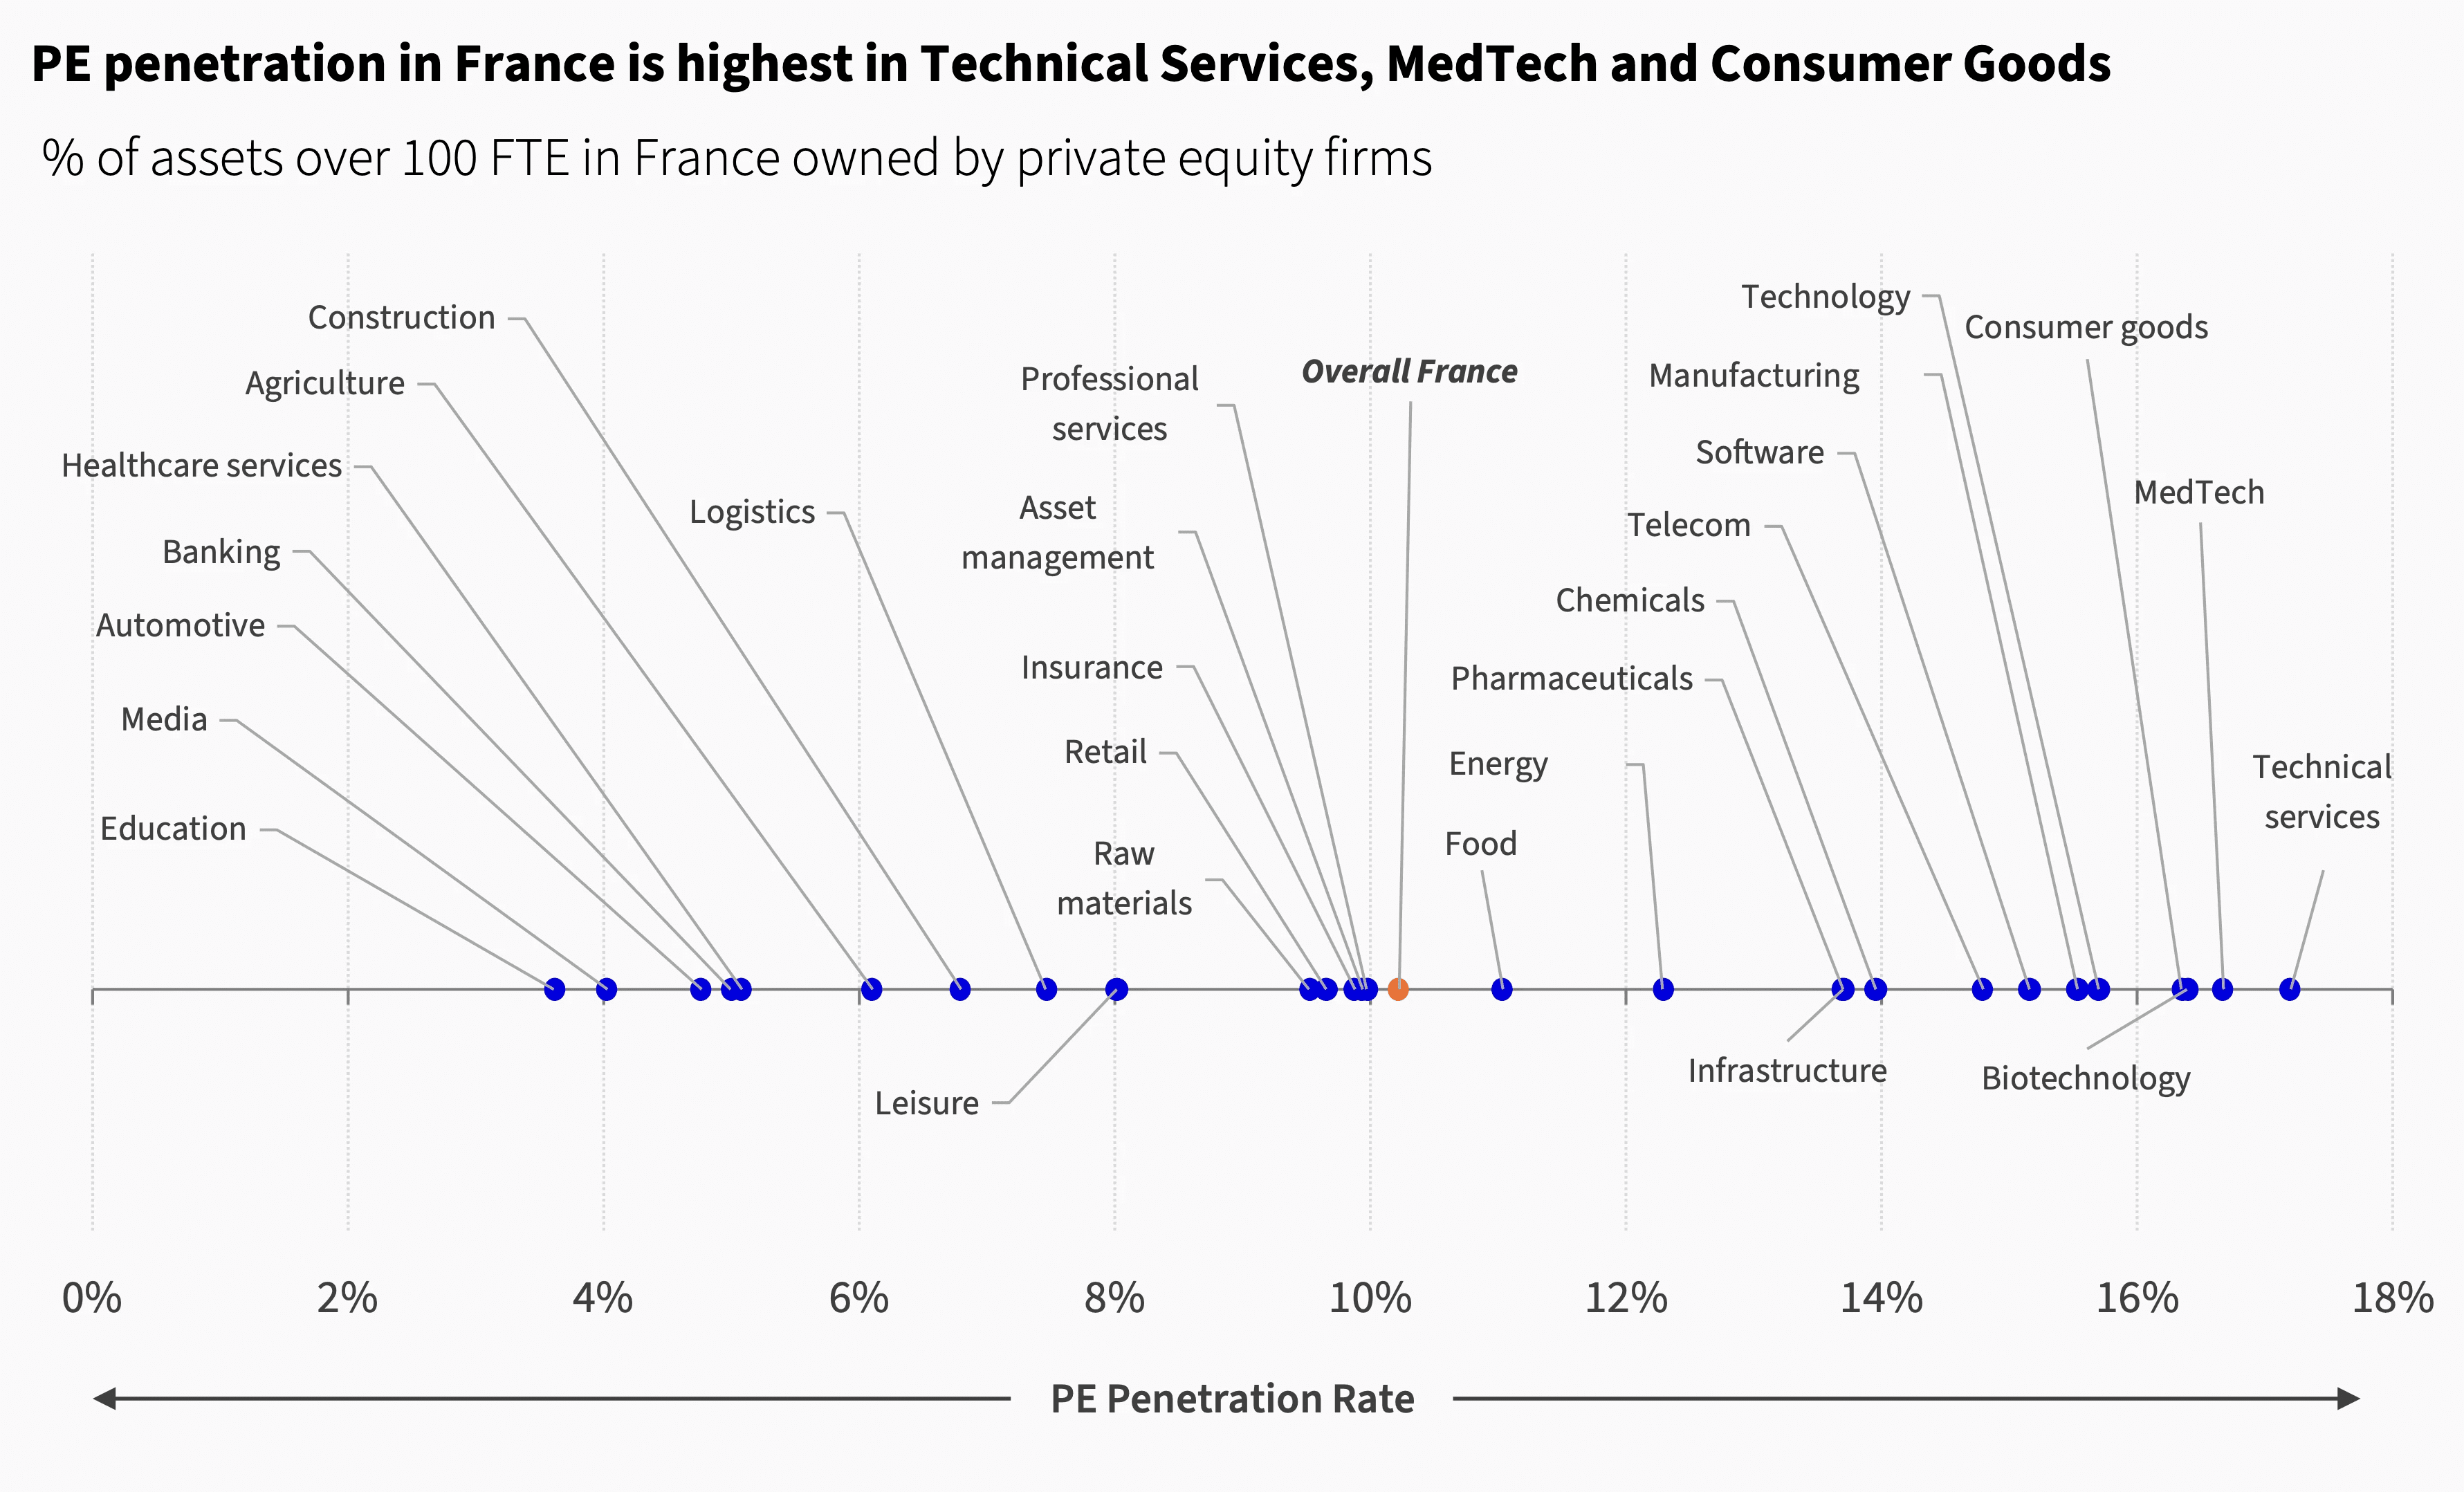
PE penetration in France is highest in Technical Services, MedTech and Consumer Goods. Software and Technology, which aren’t far behind, are the ones to look out for, especially as more deal activity shifts into those sectors.
Regional Stats
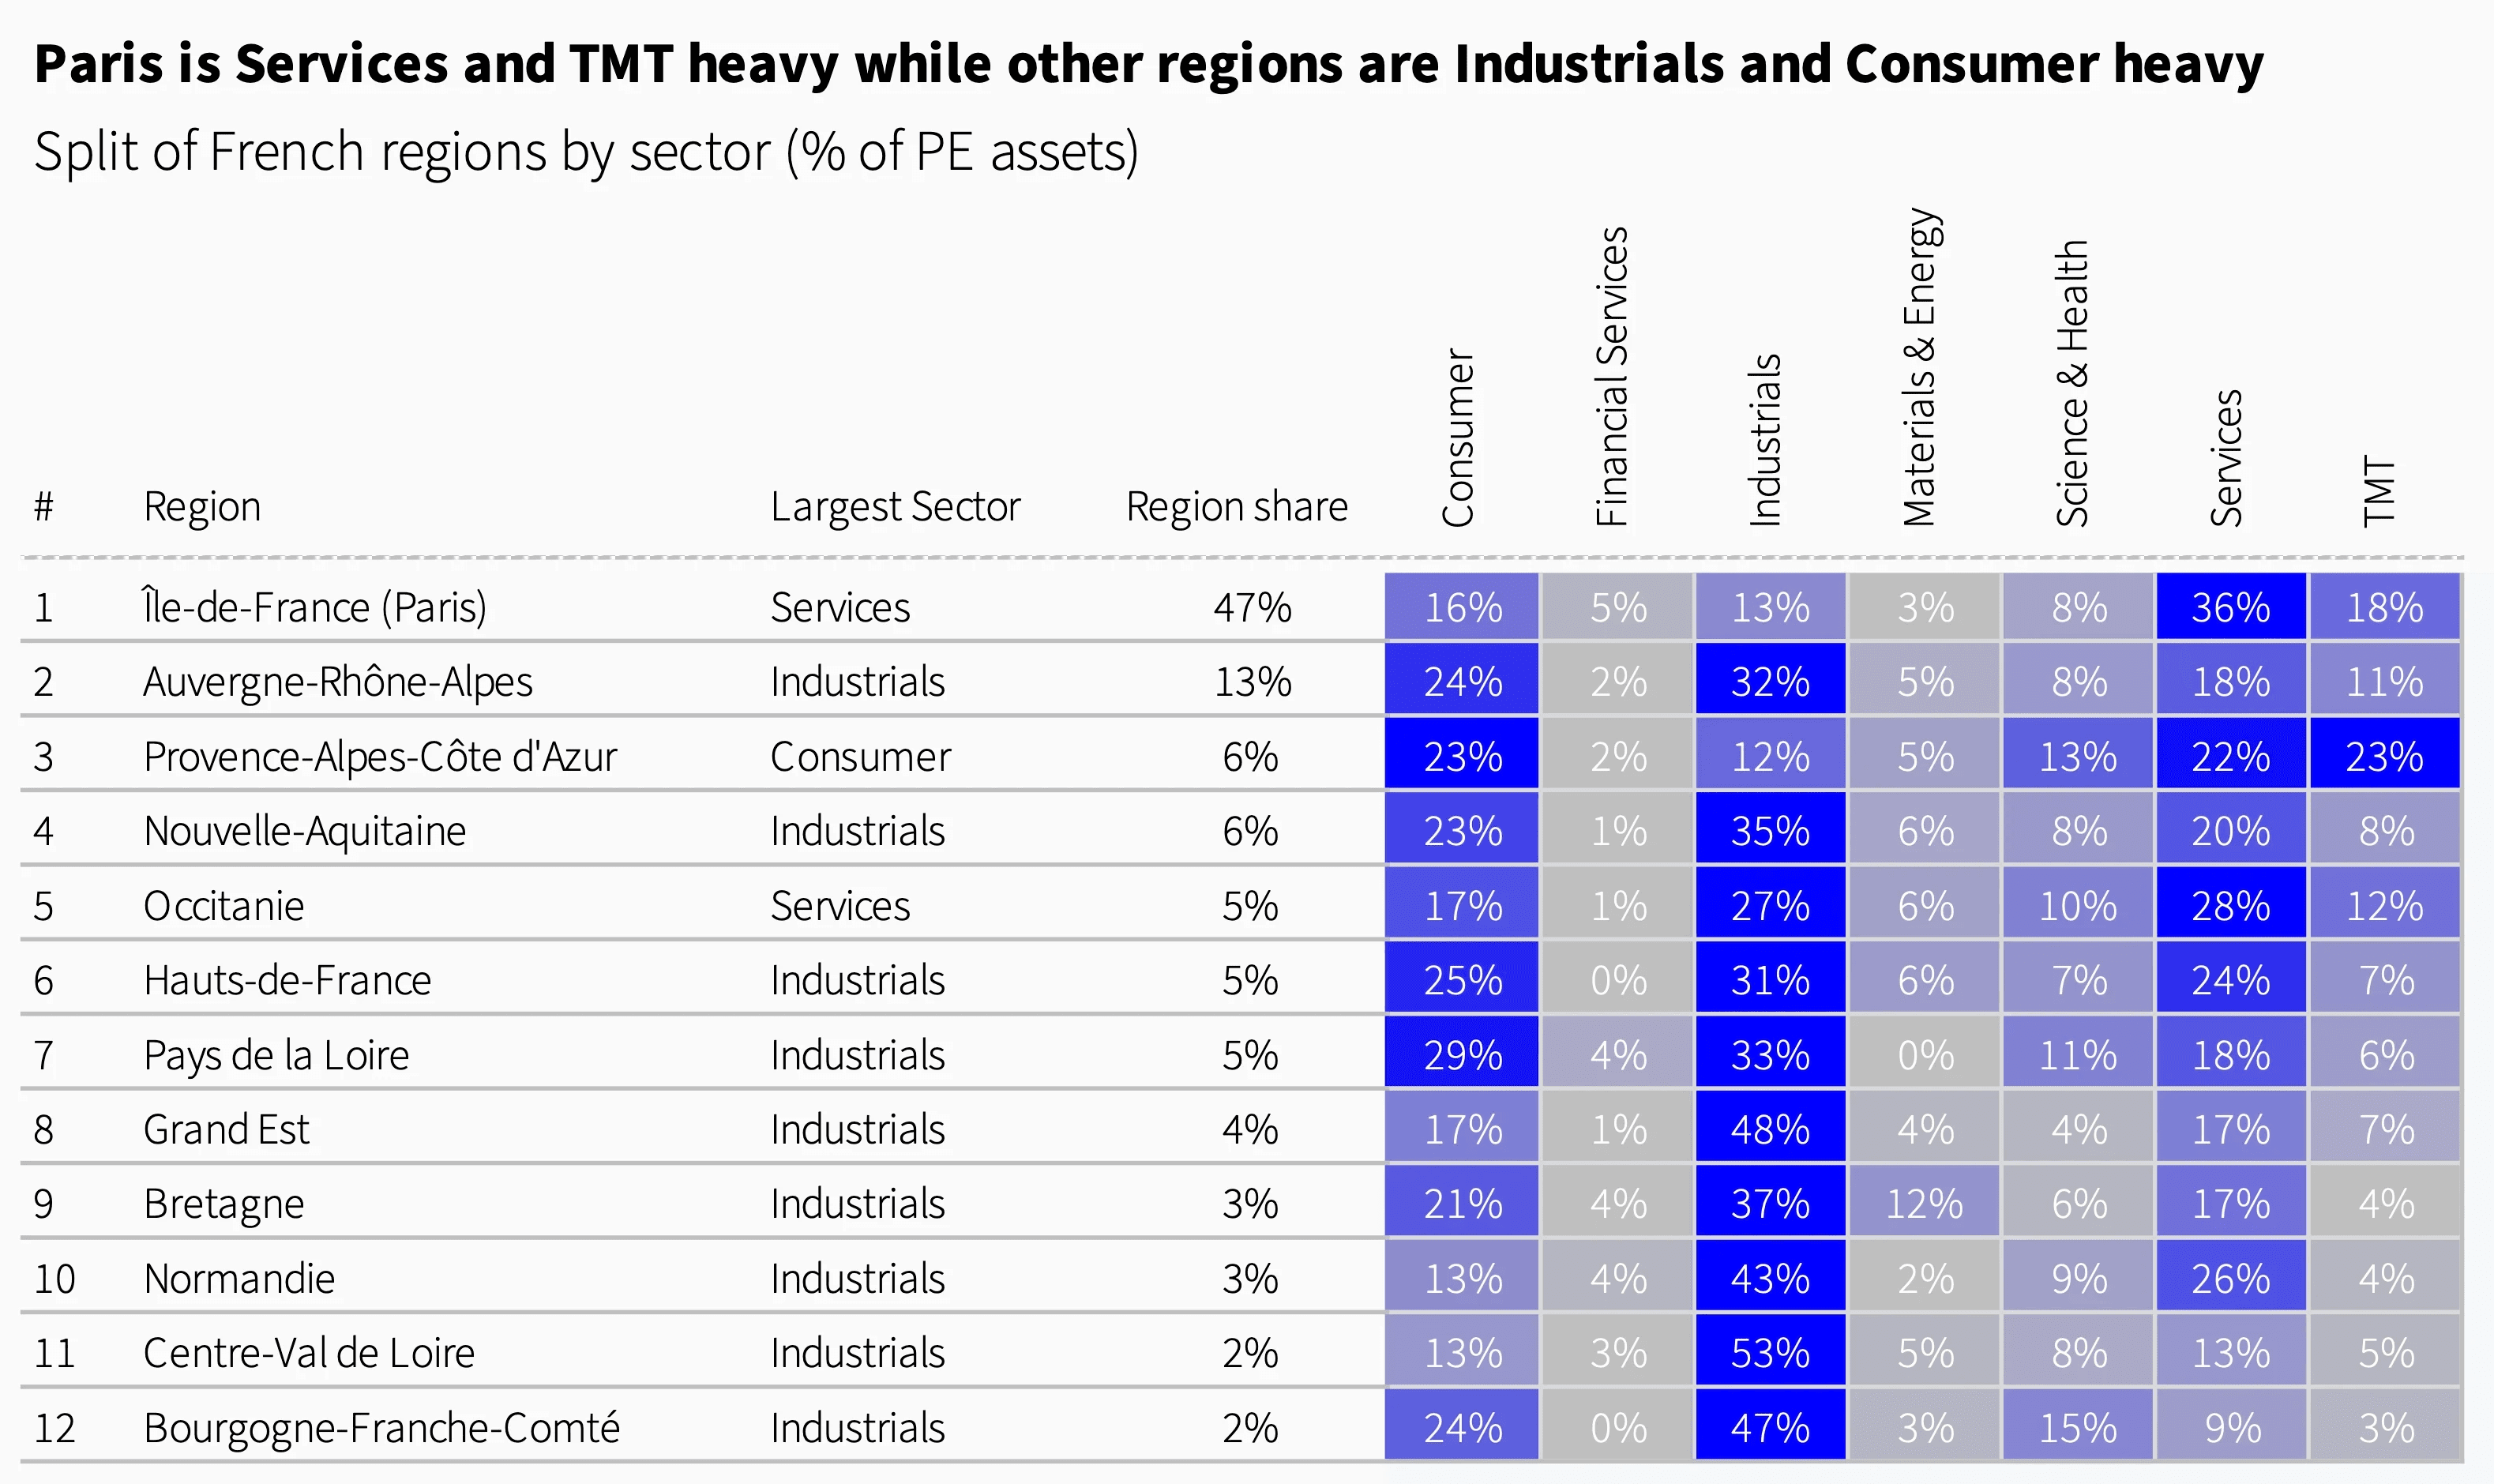
French PE assets are predominantly based in the Île-de-France region (Paris). The region accounts for 47% of the country’s PE assets, followed by Auvergne-Rhône-Alpes at 13% and Provence-Alpes-Côte-d’Azur at 6%.
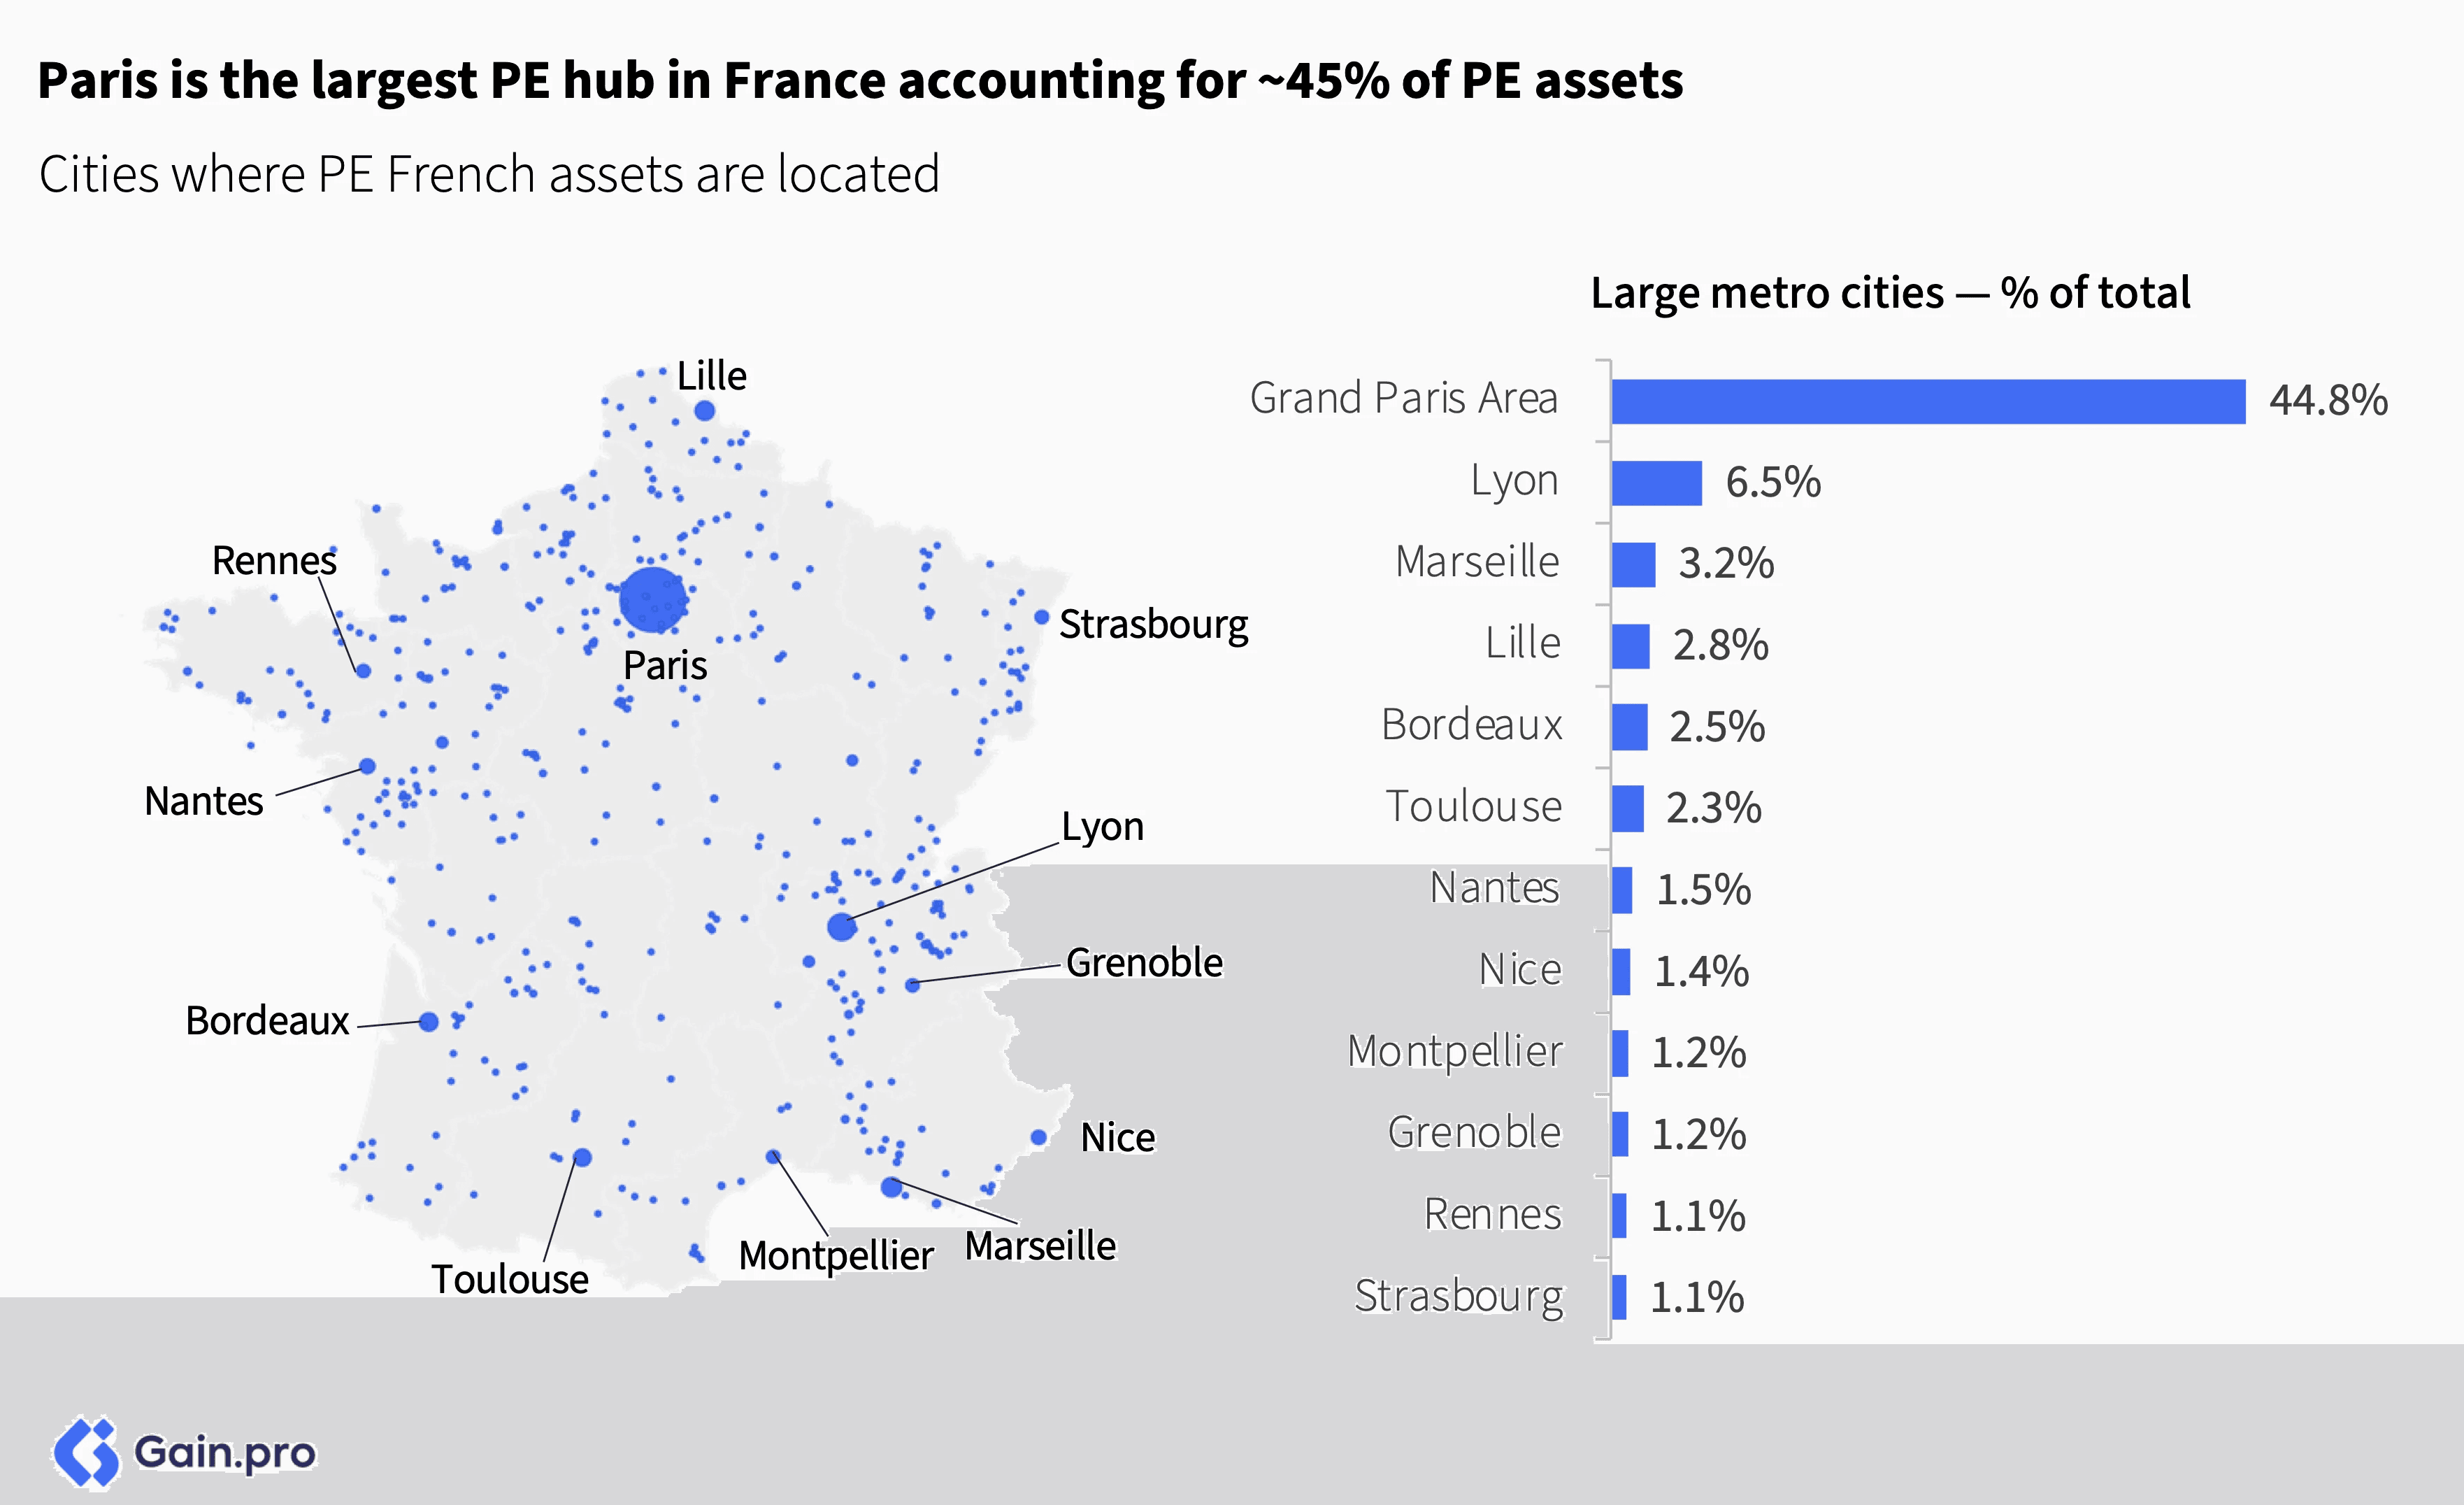
Paris is the largest PE hub in France. 45% of French PE assets are HQ’d there. Other smaller hubs include Lyon (6.5% of PE assets), Marseille (3.2%), Lille (2.8%) and Bordeaux (2.5%). Assets outside of Paris are spread widely, with key clusters located on the western and southern coasts.
Sector-wise, Paris (Île-de-France) leans towards Services and TMT. 36% of PE-owned assets in Paris are in Services, 18% in TMT and 16% in Consumer. Other French regions are more focused on Industrials and Consumer sectors.
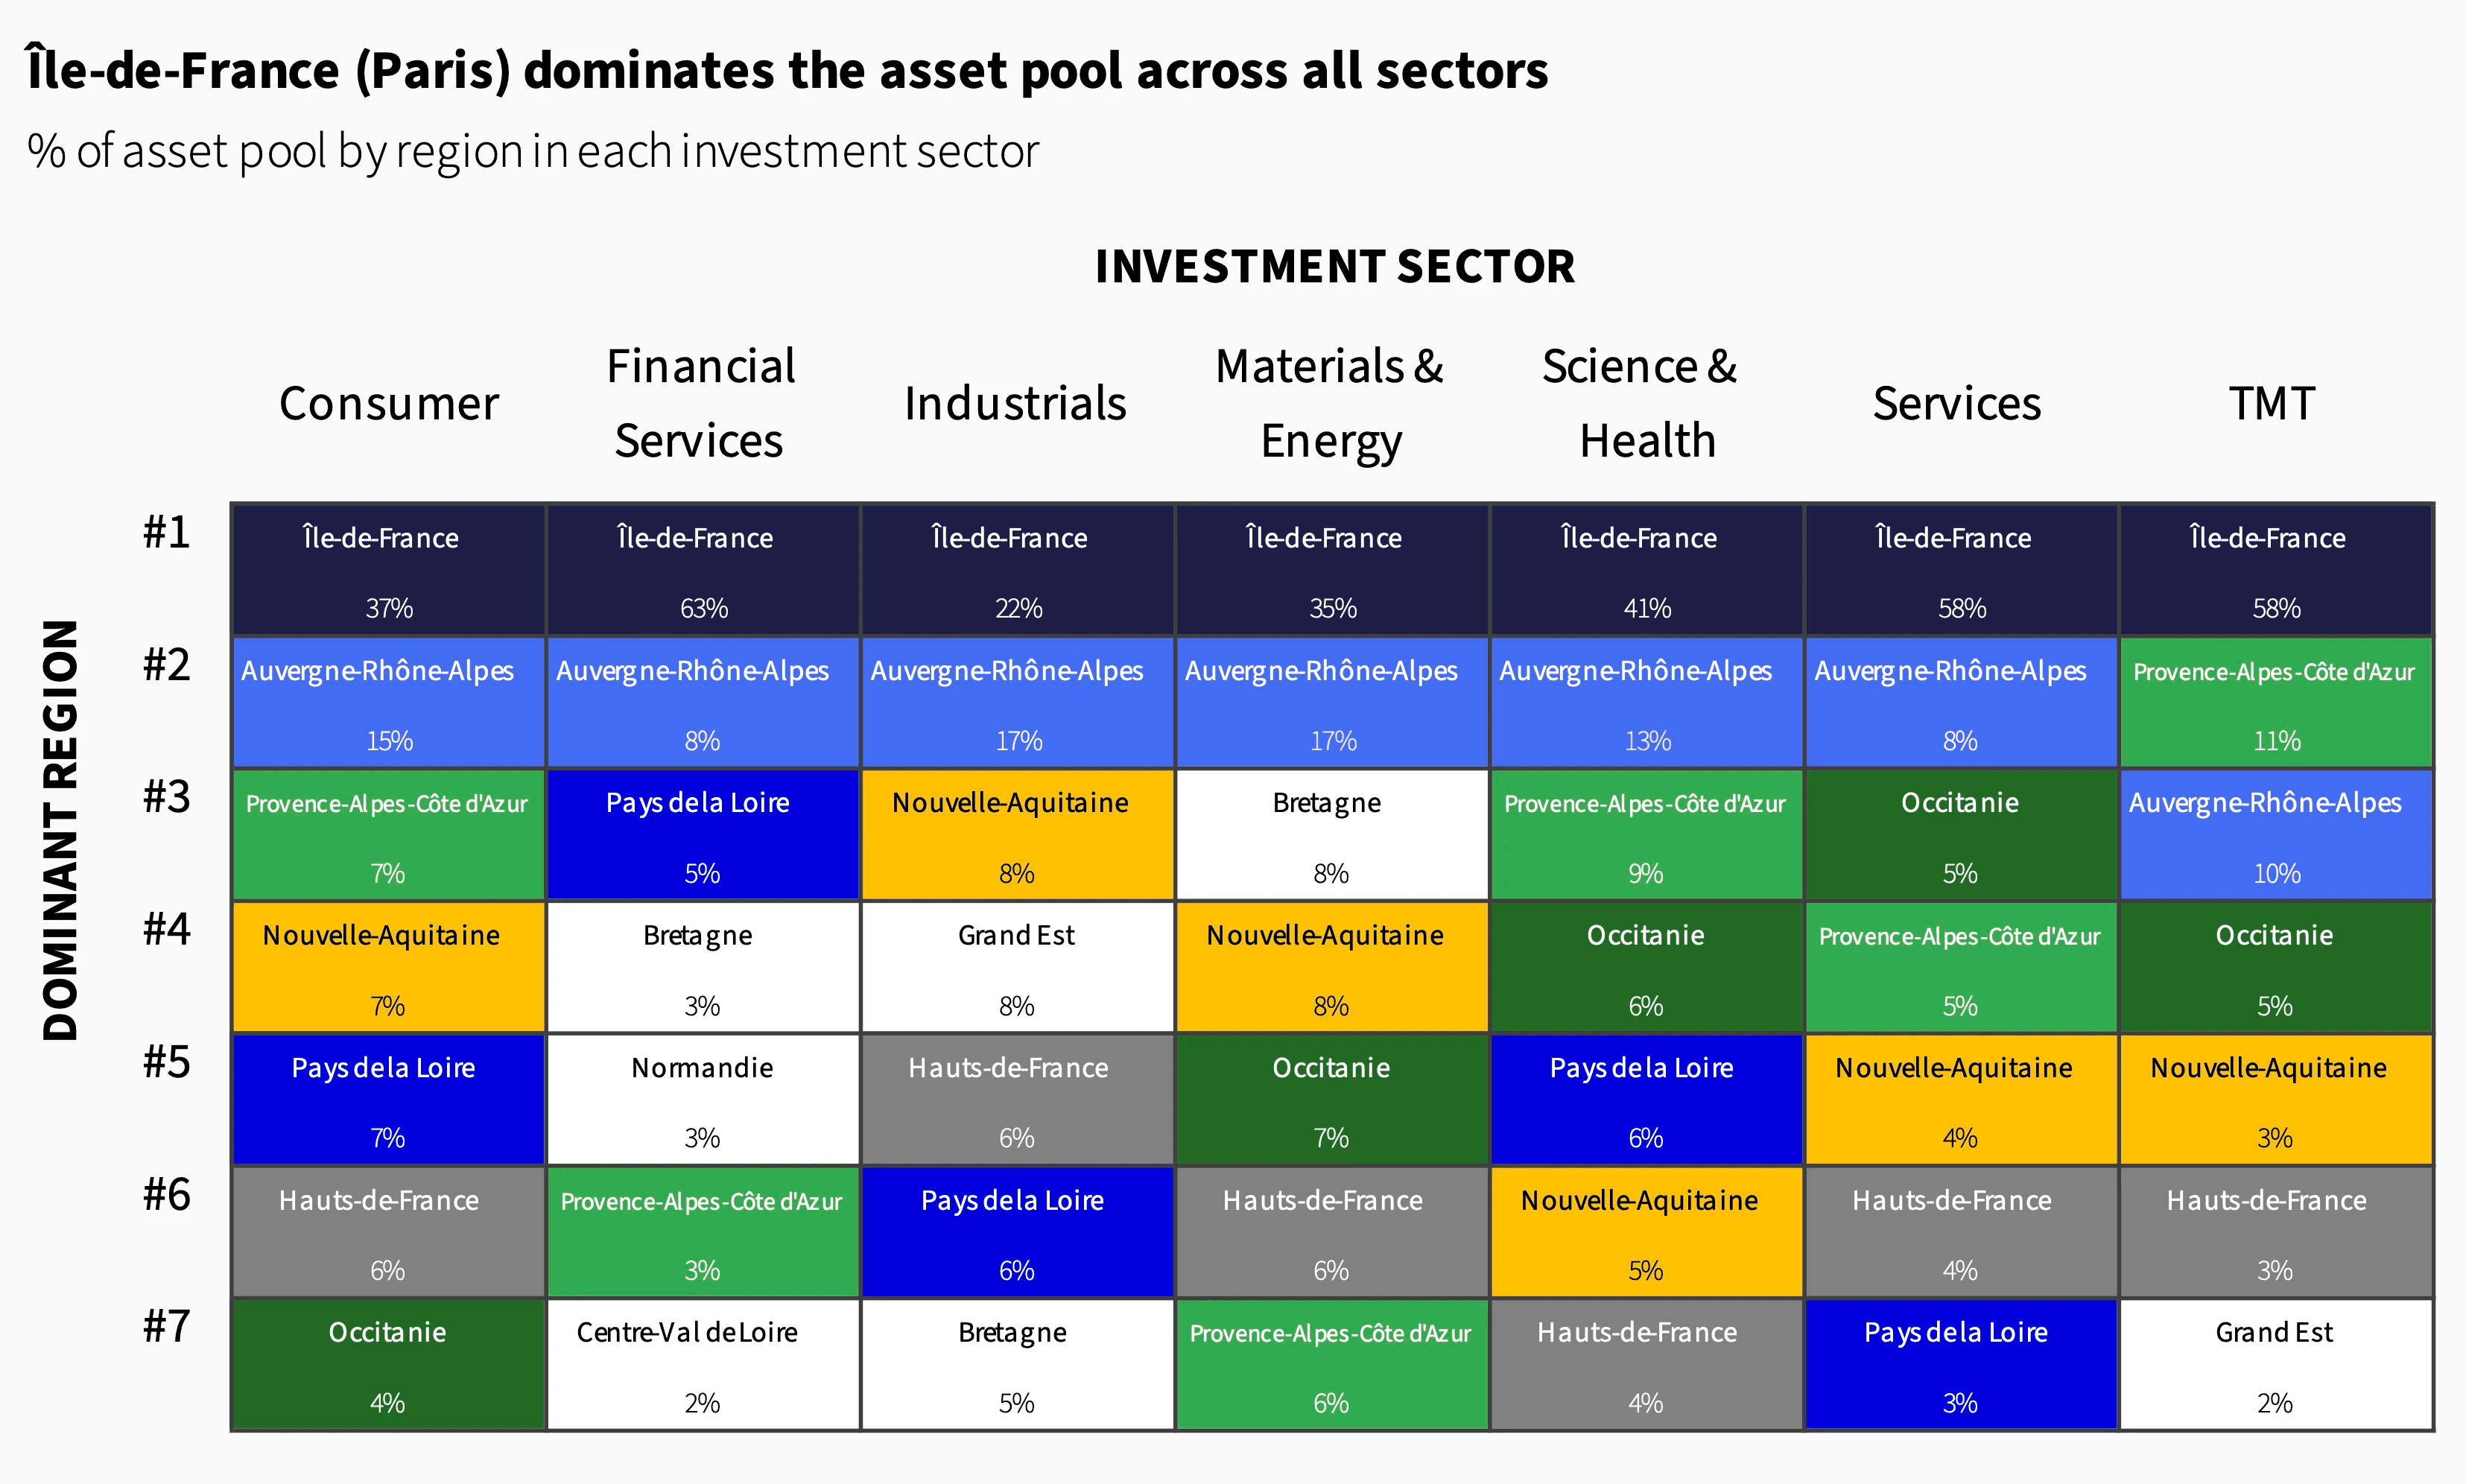
Île-de-France (Paris) dominates the asset pool across all sectors. The dominance is especially visible in Financial Services (63% share), TMT (58%) and Services (58%). Auvergne-Rhône-Alpes ranks second in most sectors, with the smallest gap seen in Industrials (22% vs. 17%).
Growth and Margin
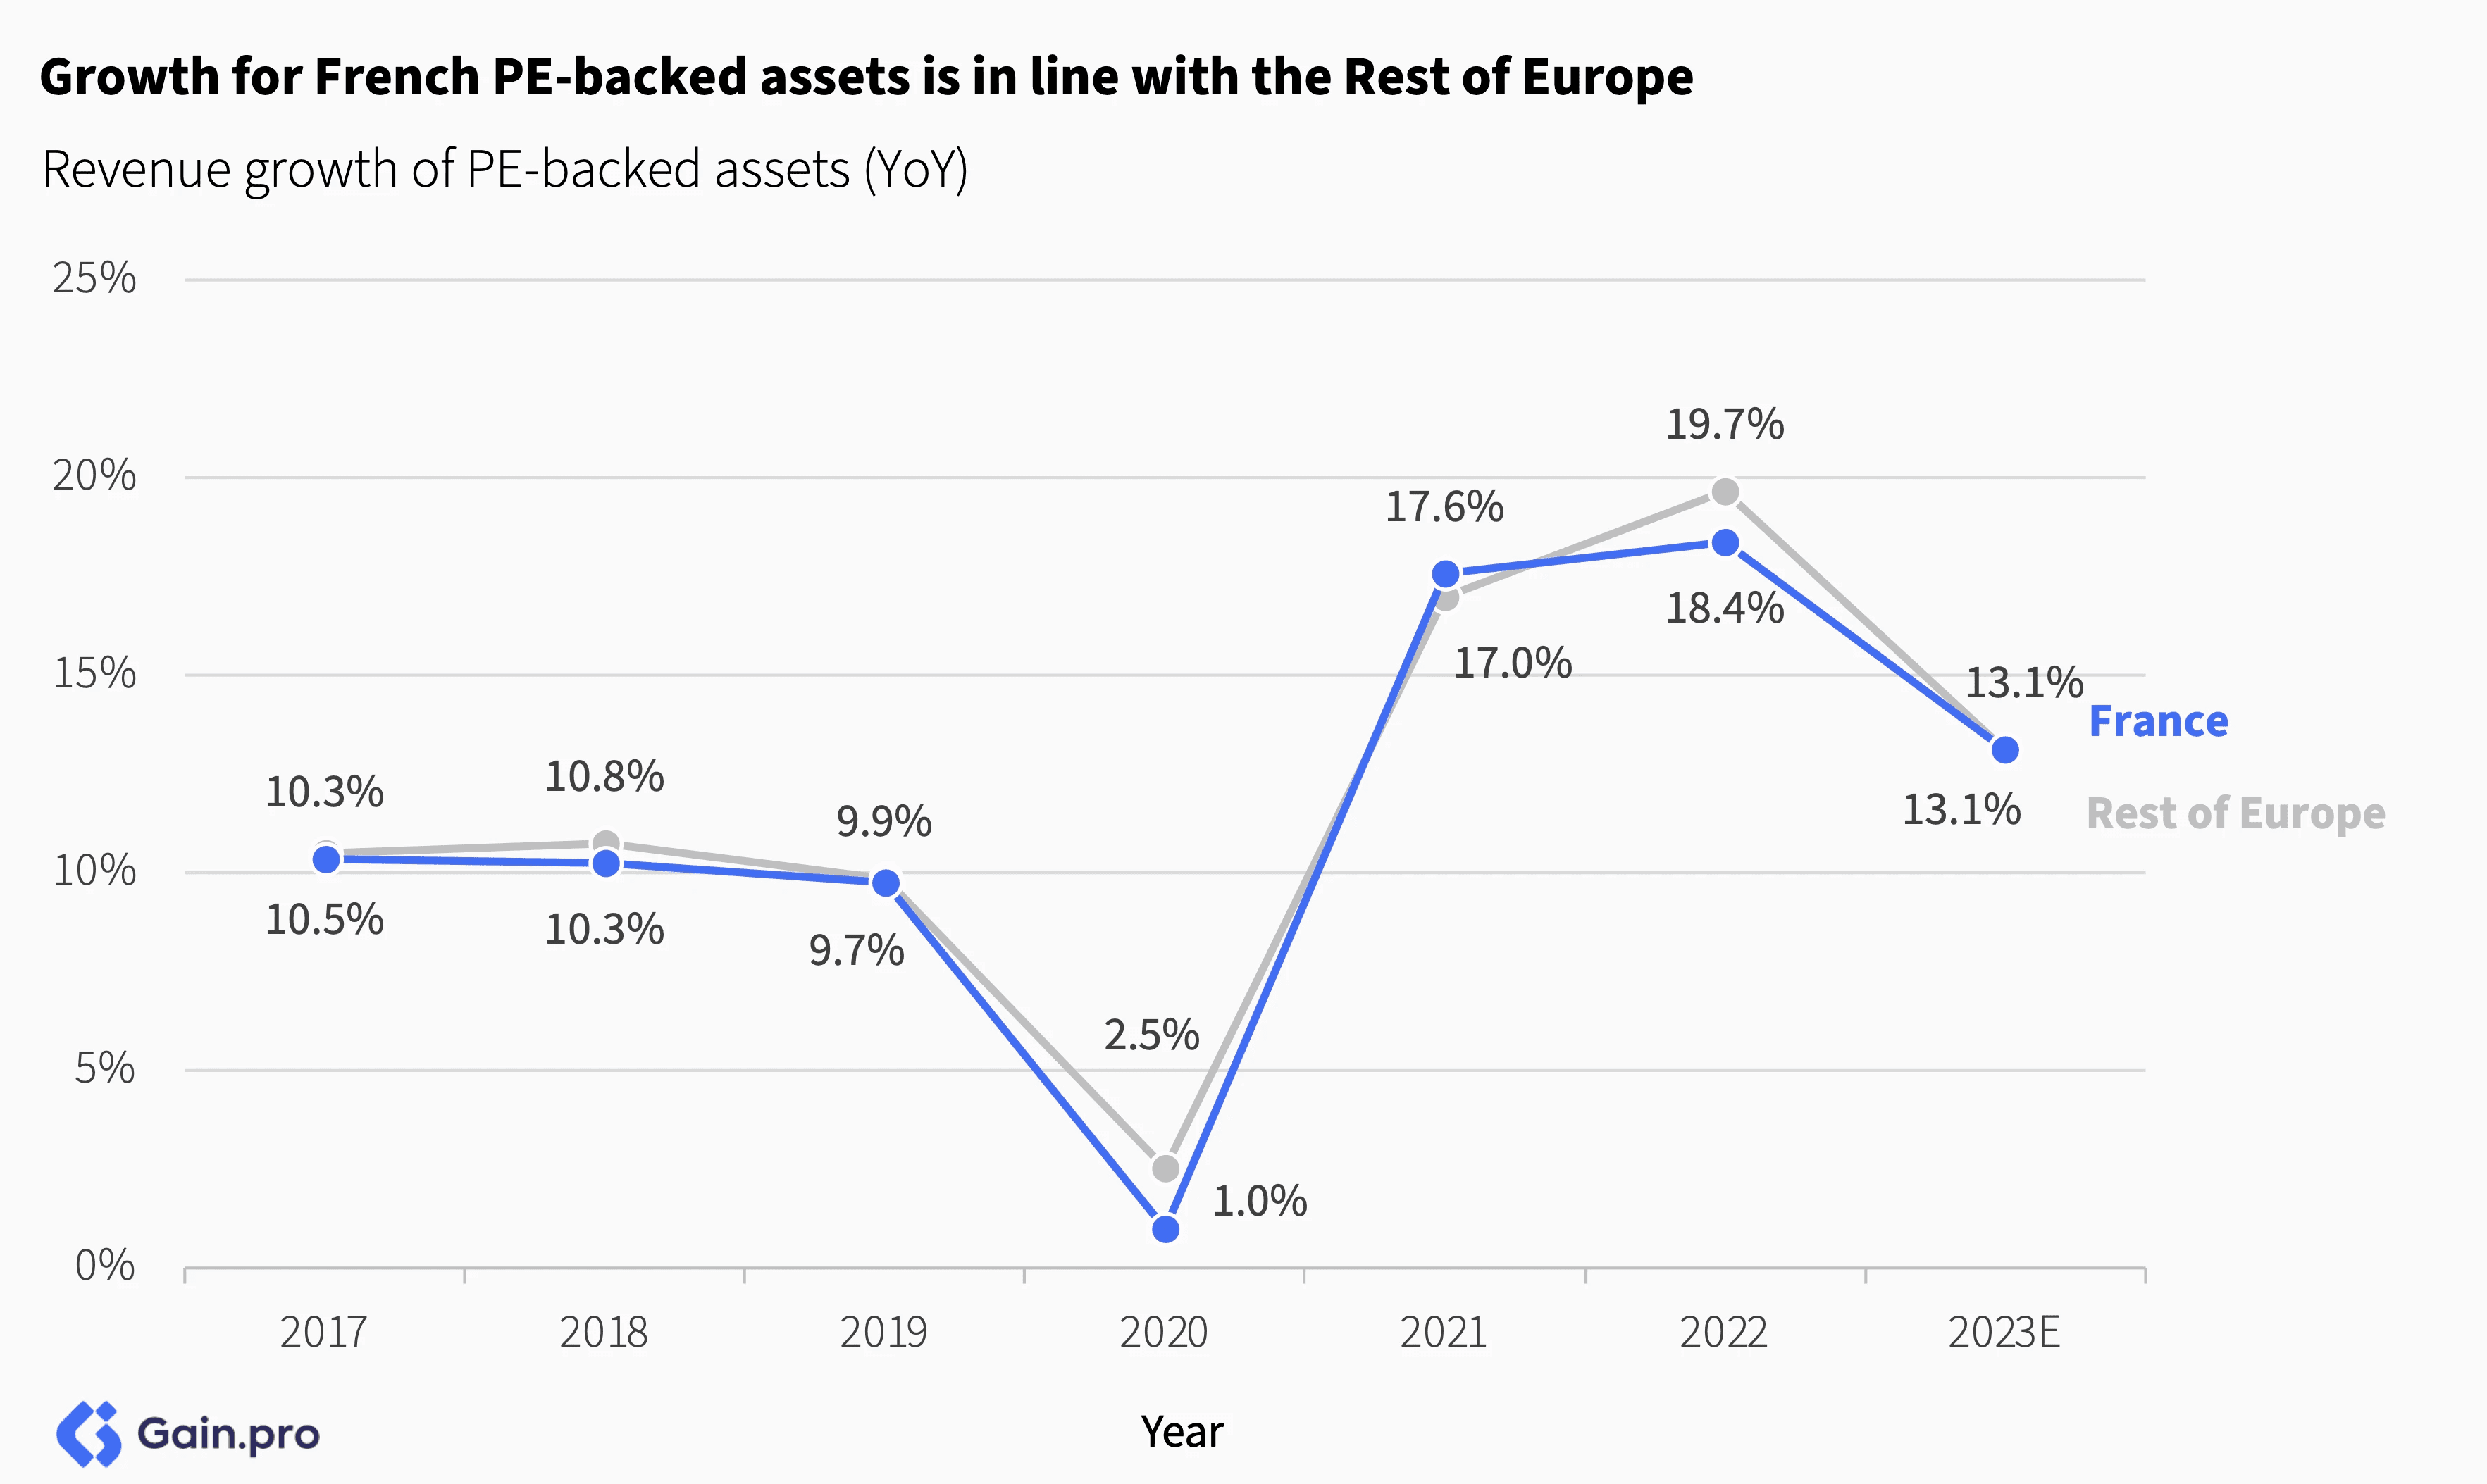
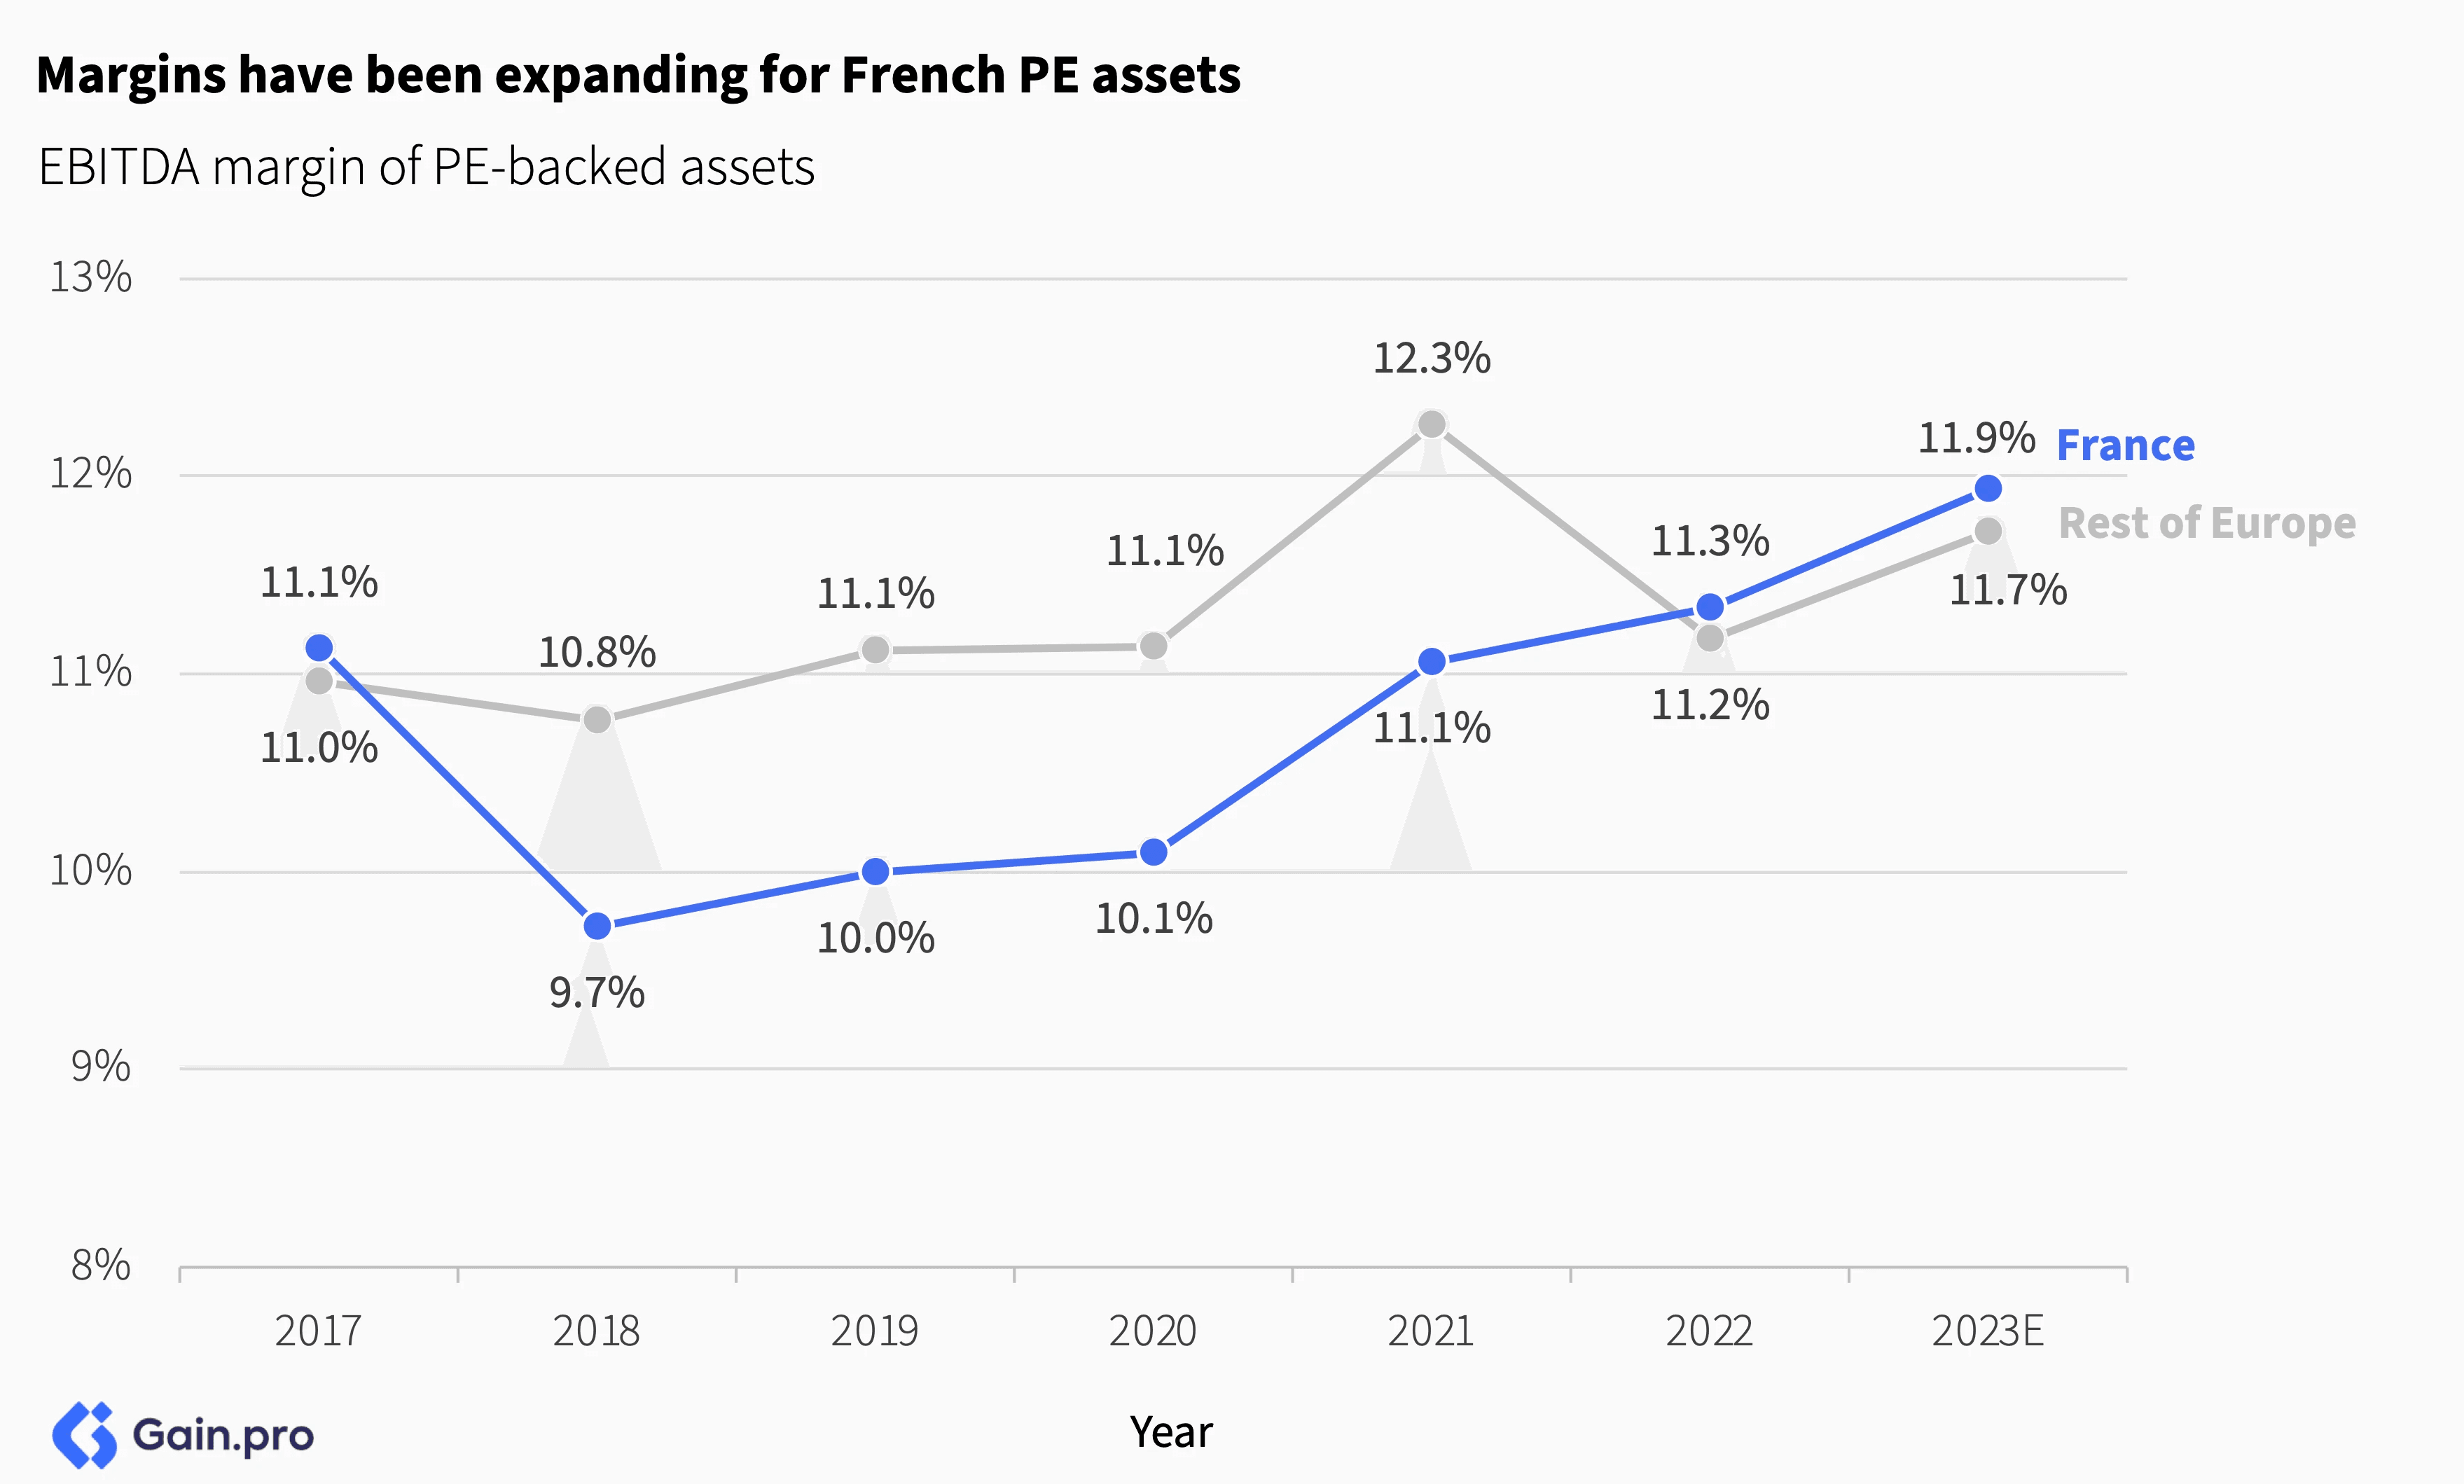
Growth for PE-backed assets in France mirrors that of the Rest of Europe. Although growth remains strong and in double digit territory, we are starting to see moderation in growth rates vs. 2021 and 2022.
Margins for French PE assets have been expanding. They are up 220 bps since 2018, standing at 11.9% vs. 11.7% in the Rest of Europe.
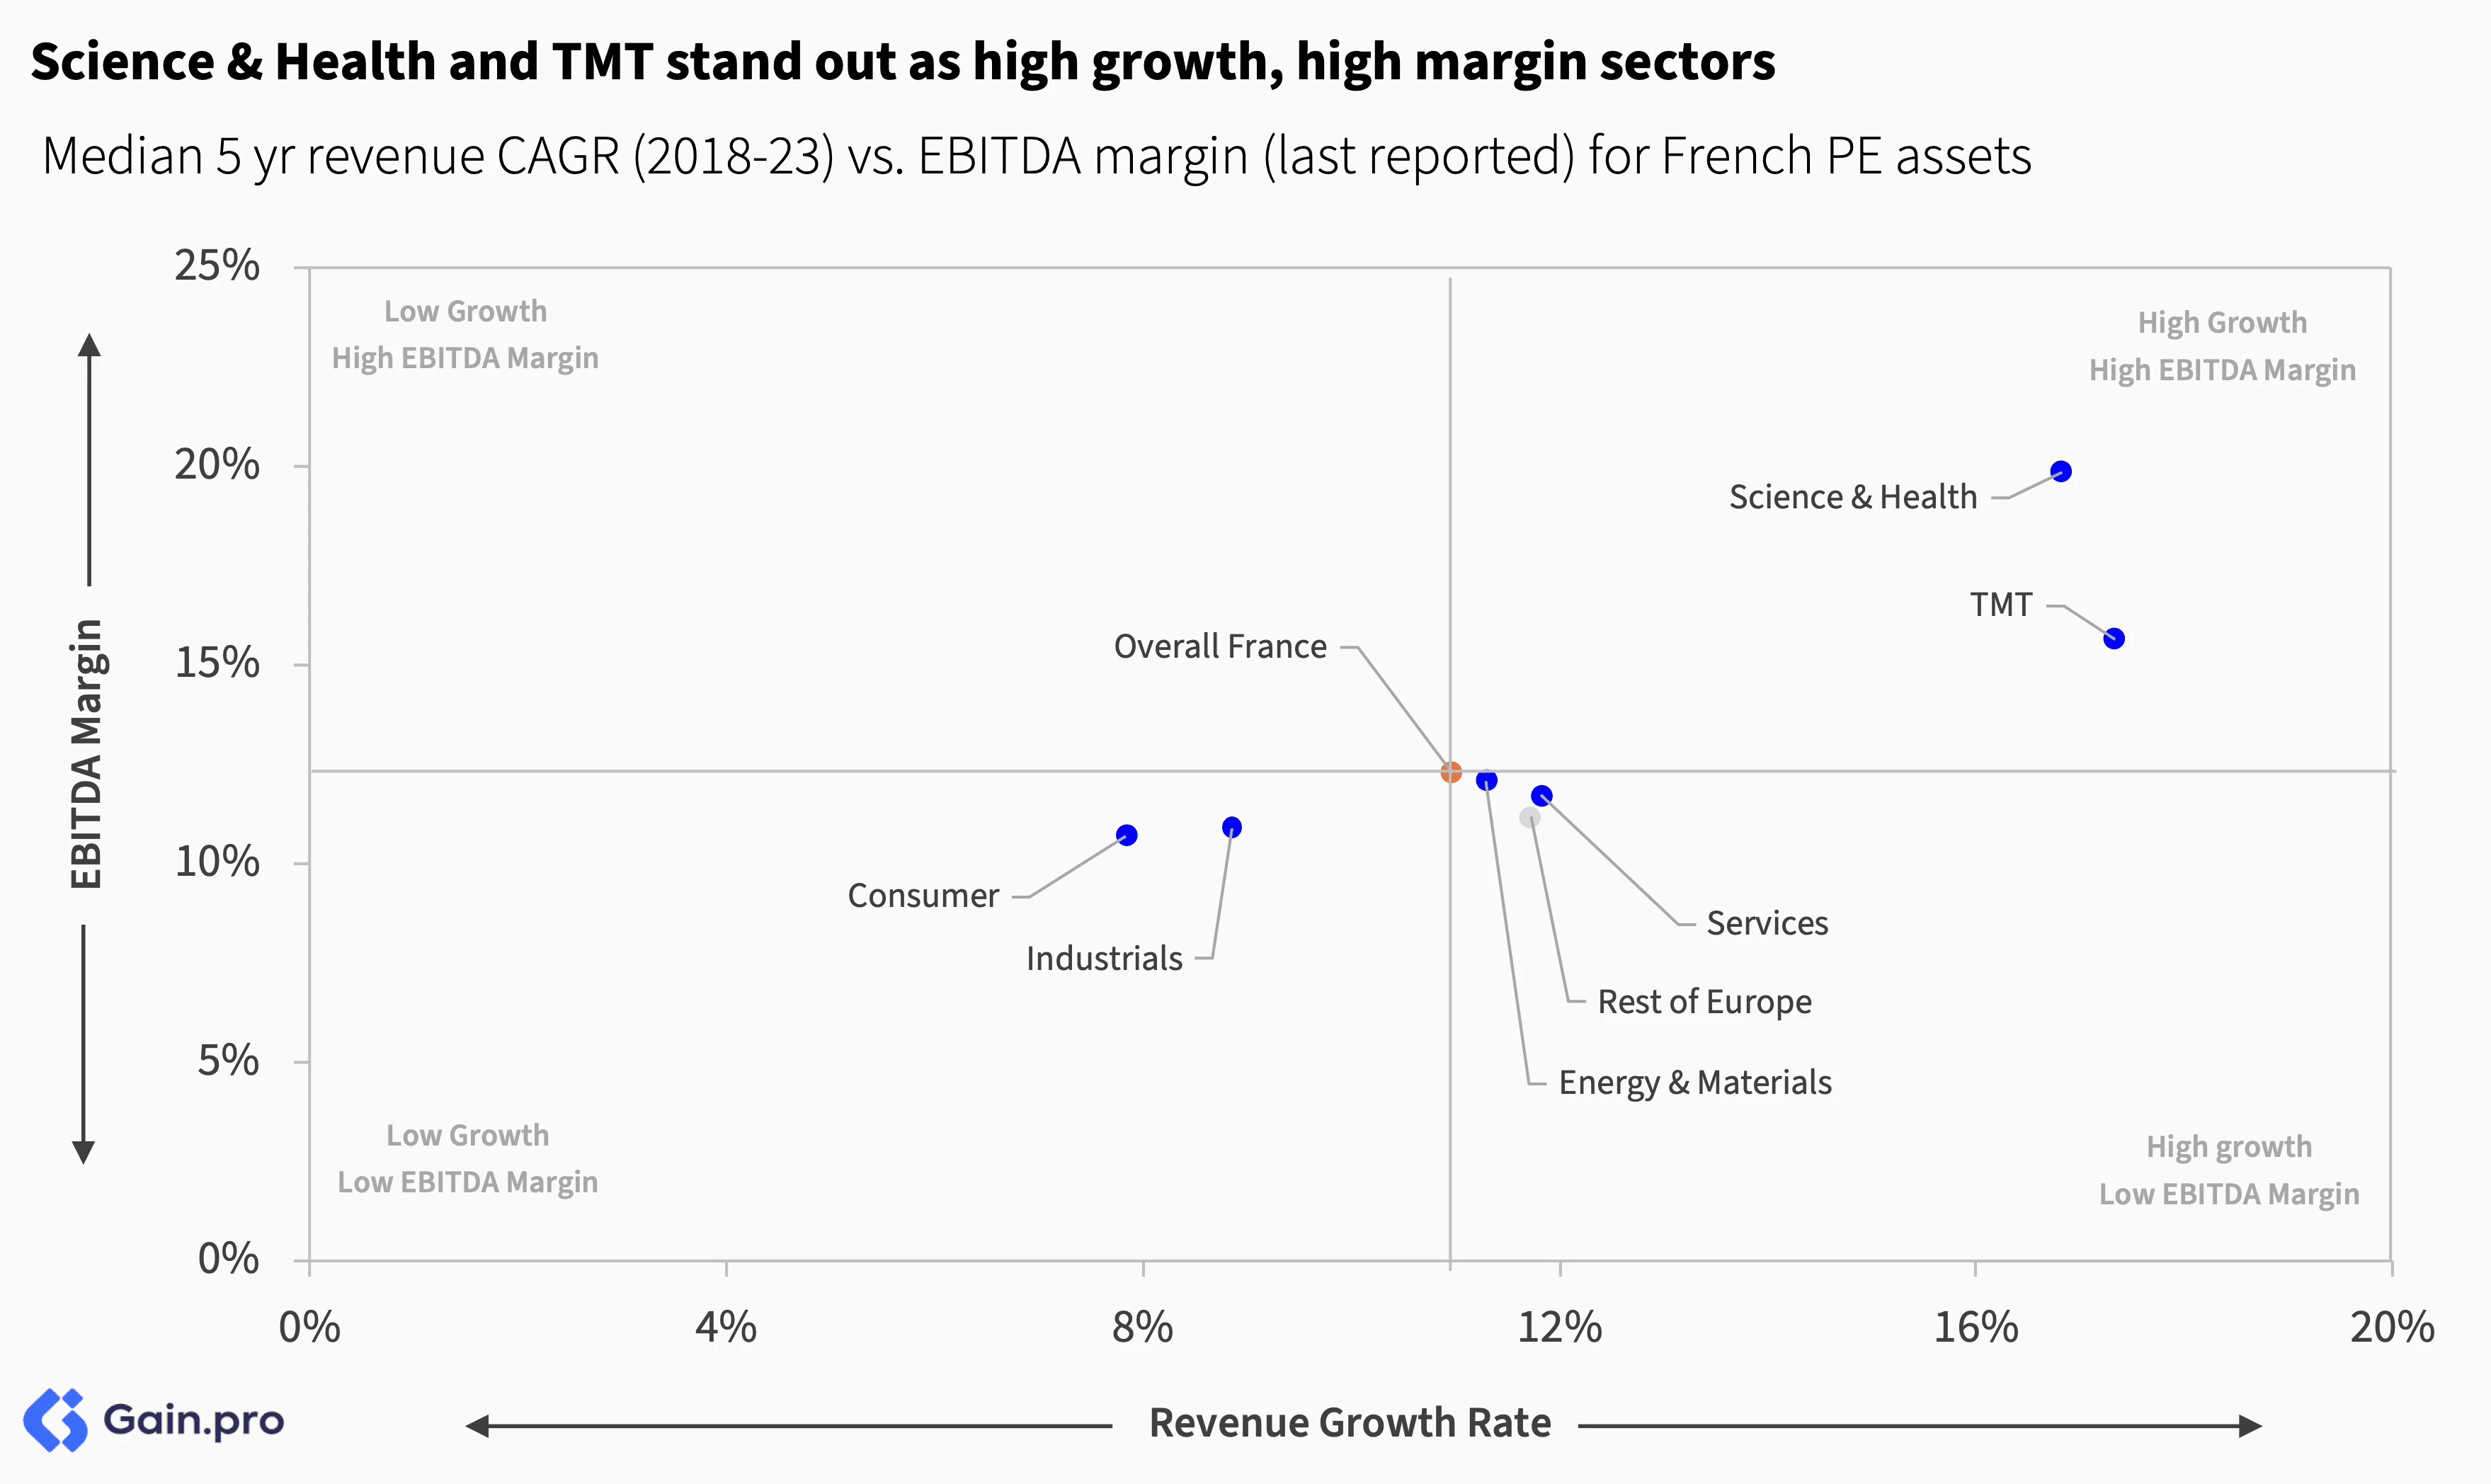
Science & Health and TMT stand out as high growth, high margin sectors. Industrials and Consumer assets have both lower growth rates and margins, as was also the case with DACH PE assets.
Methodology
The data for this report comes from Gain.pro.
Entries & Exits
We define PE-backed entries as those in which a PE firm took a minority or majority stake. We define PE-backed exits as those in which a PE firm sold a minority or majority stake. We exclude any VC rounds from our analysis. Both entries and exits exclude live (pre-2023) and aborted deals.
Unless otherwise stated, we only focused our analysis on assets HQ’d in France.
We estimate the deal count based on prior deal history and the percentage of deals that are announced or added post-quarter close.
Financials
Unless stated otherwise, the financial metrics in the report are last reported. Where possible, we have used 2023 metrics. In cases where 2023 numbers are still being reported, we have relied on 2022 metrics.
For metric calculations, we only included assets that had a hand-curated profile on Gain.pro (12-14+ hours of primary research).
Rankings
We take a novel approach to our ranking, which is based on total managed enterprise value (EV) in Europe.
At Gain.pro, we track over 12,900 investor portfolios in detail. We calculate EV for each asset in the investors portfolio by multiplying the assets’ EBITDA by a predicted exit multiple, and sum it up. Where EBITDA numbers are not available, we estimate it based on assets revenue and investors’ other holdings.
We only consider majority buyout and minority-owned PE assets for our rankings. We exclude any VC investments and publicly listed stakes. We also adjust for ownership share.
We leverage the assets’ sector, size, growth rate, margin profile and cash generation to predict its exit multiple.
Further, we exclude any inactive investors from the largest global investors in France ranking with: i) <3 portfolio companies in France; ii) <2 entries in France since 2018 and iii) <2 positive portfolio EBITDA values.
For the largest French investors rankings, we exclude investors with: i) <5 portfolio companies in Europe; ii) <5 entries since 2018 in Europe and iii) <3 positive portfolio EBITDA values.


