The State of DACH Private Equity


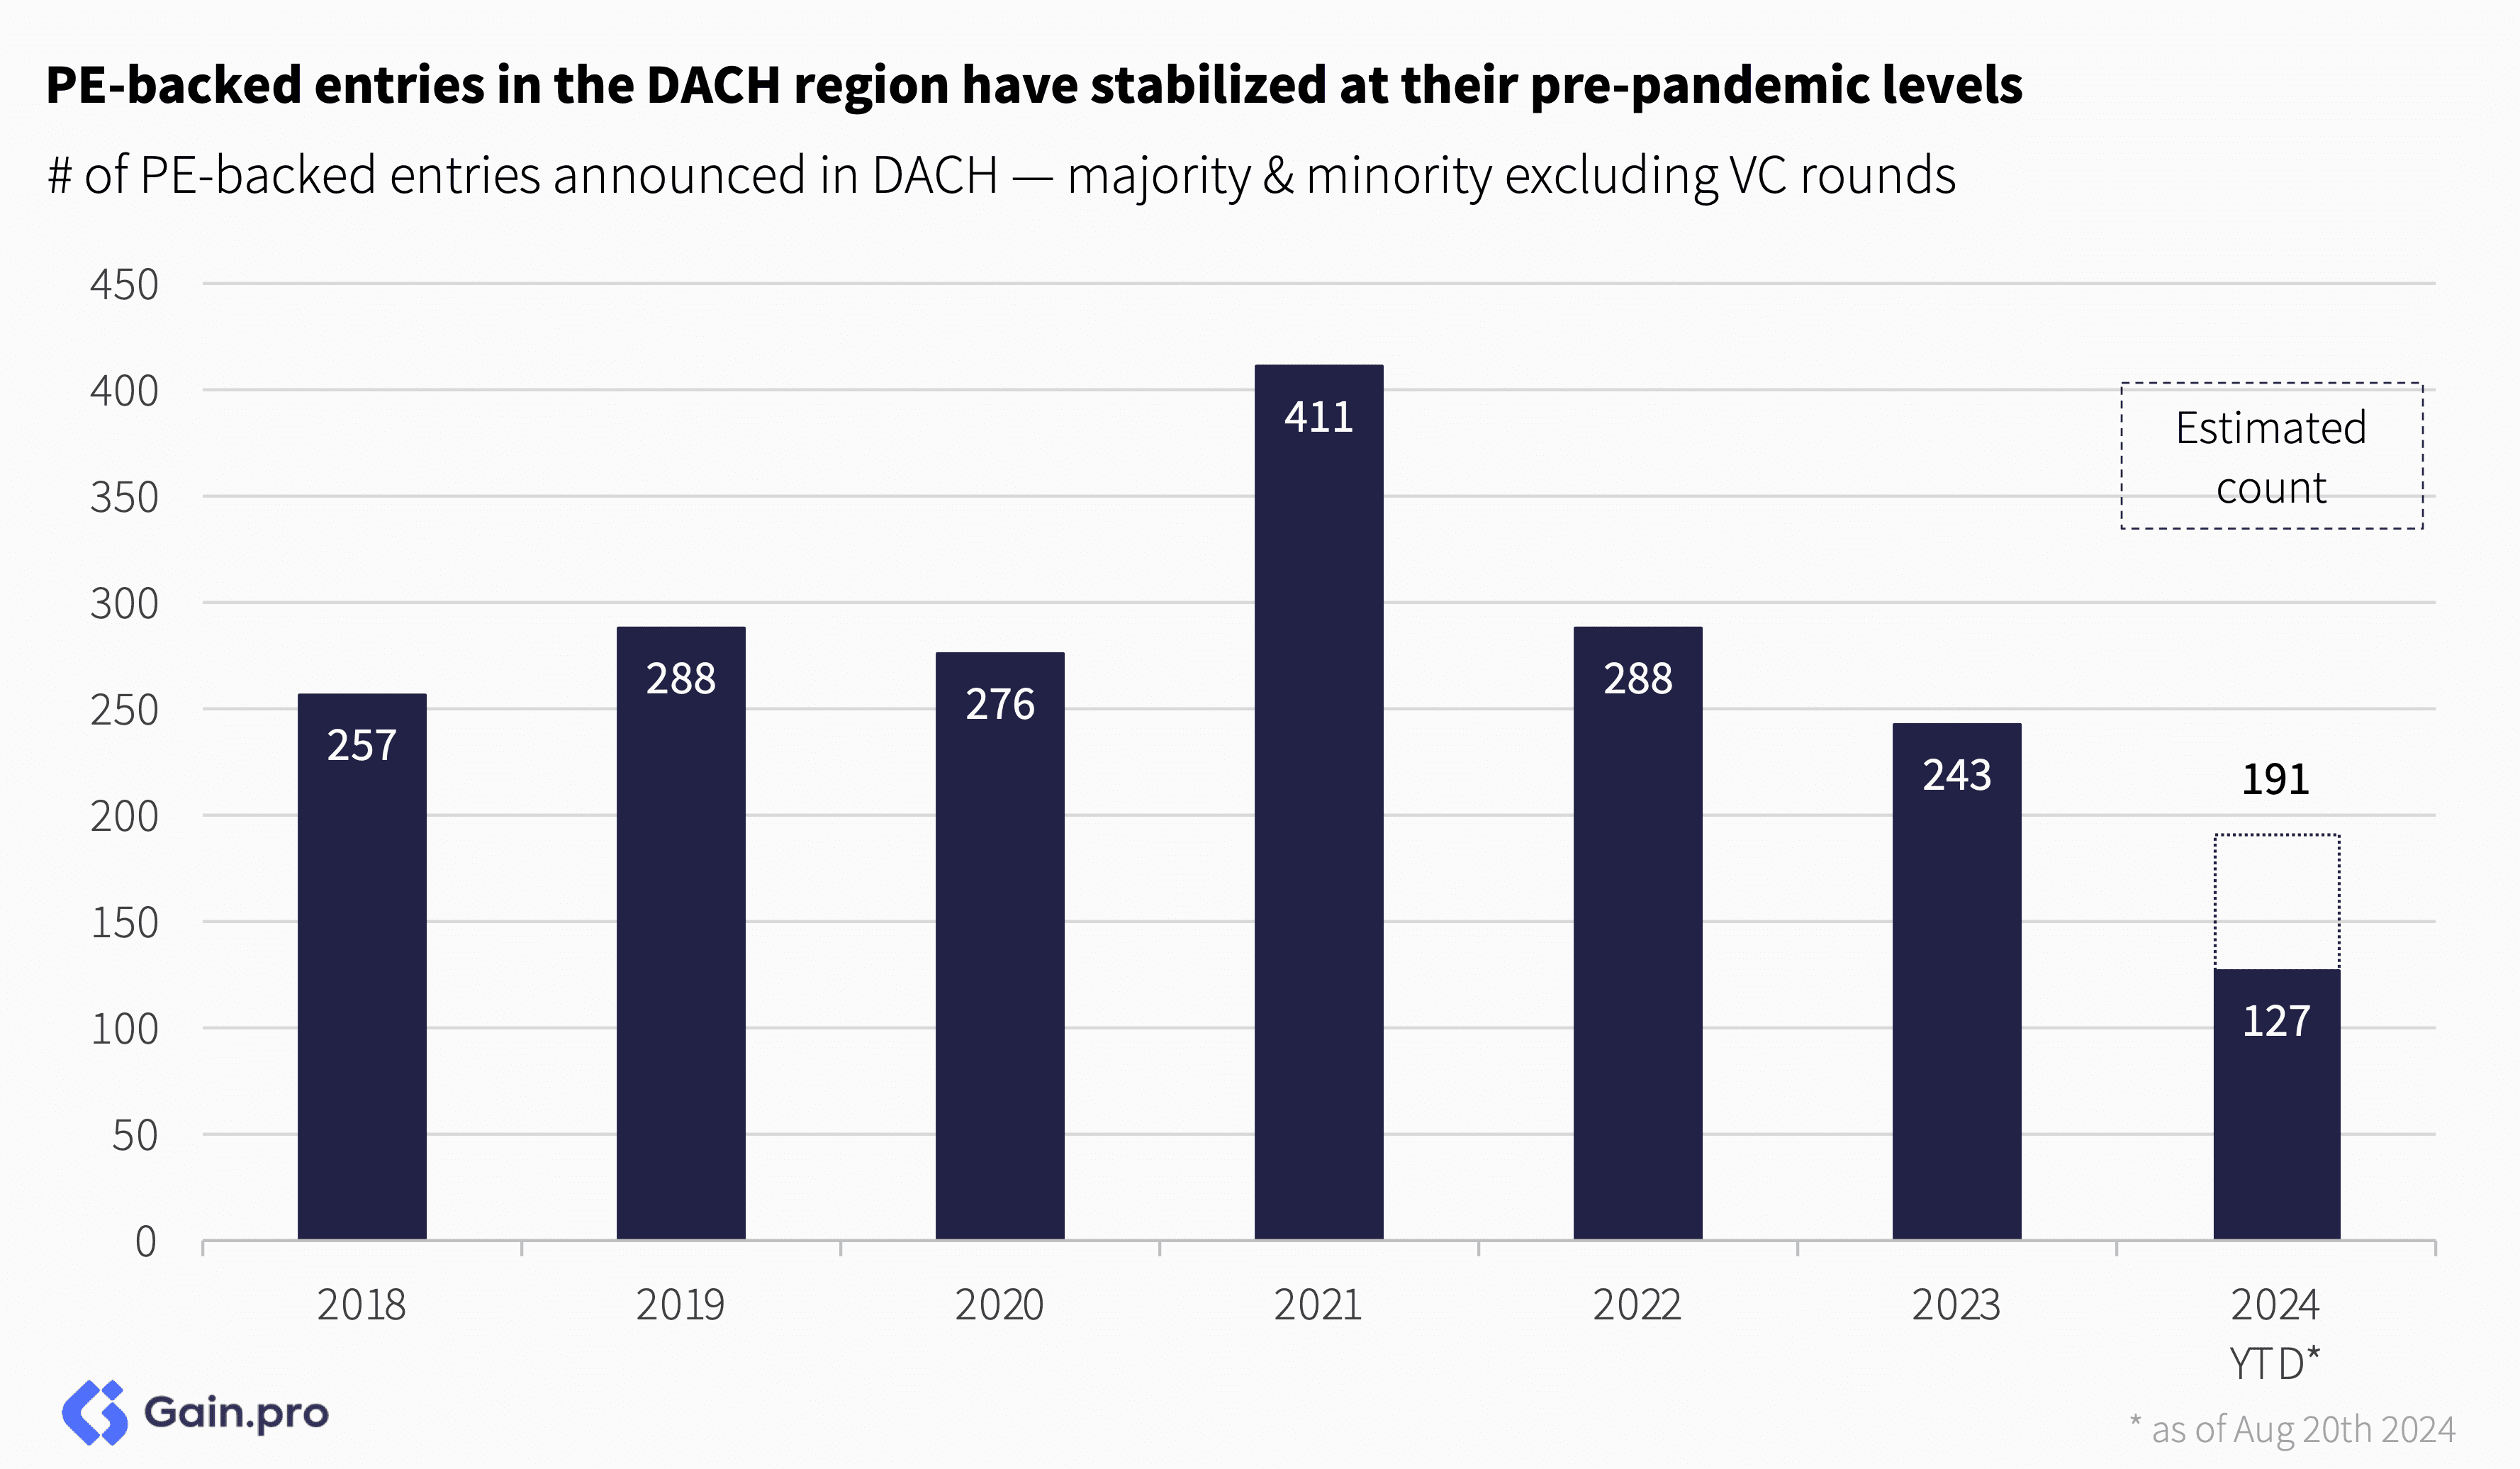
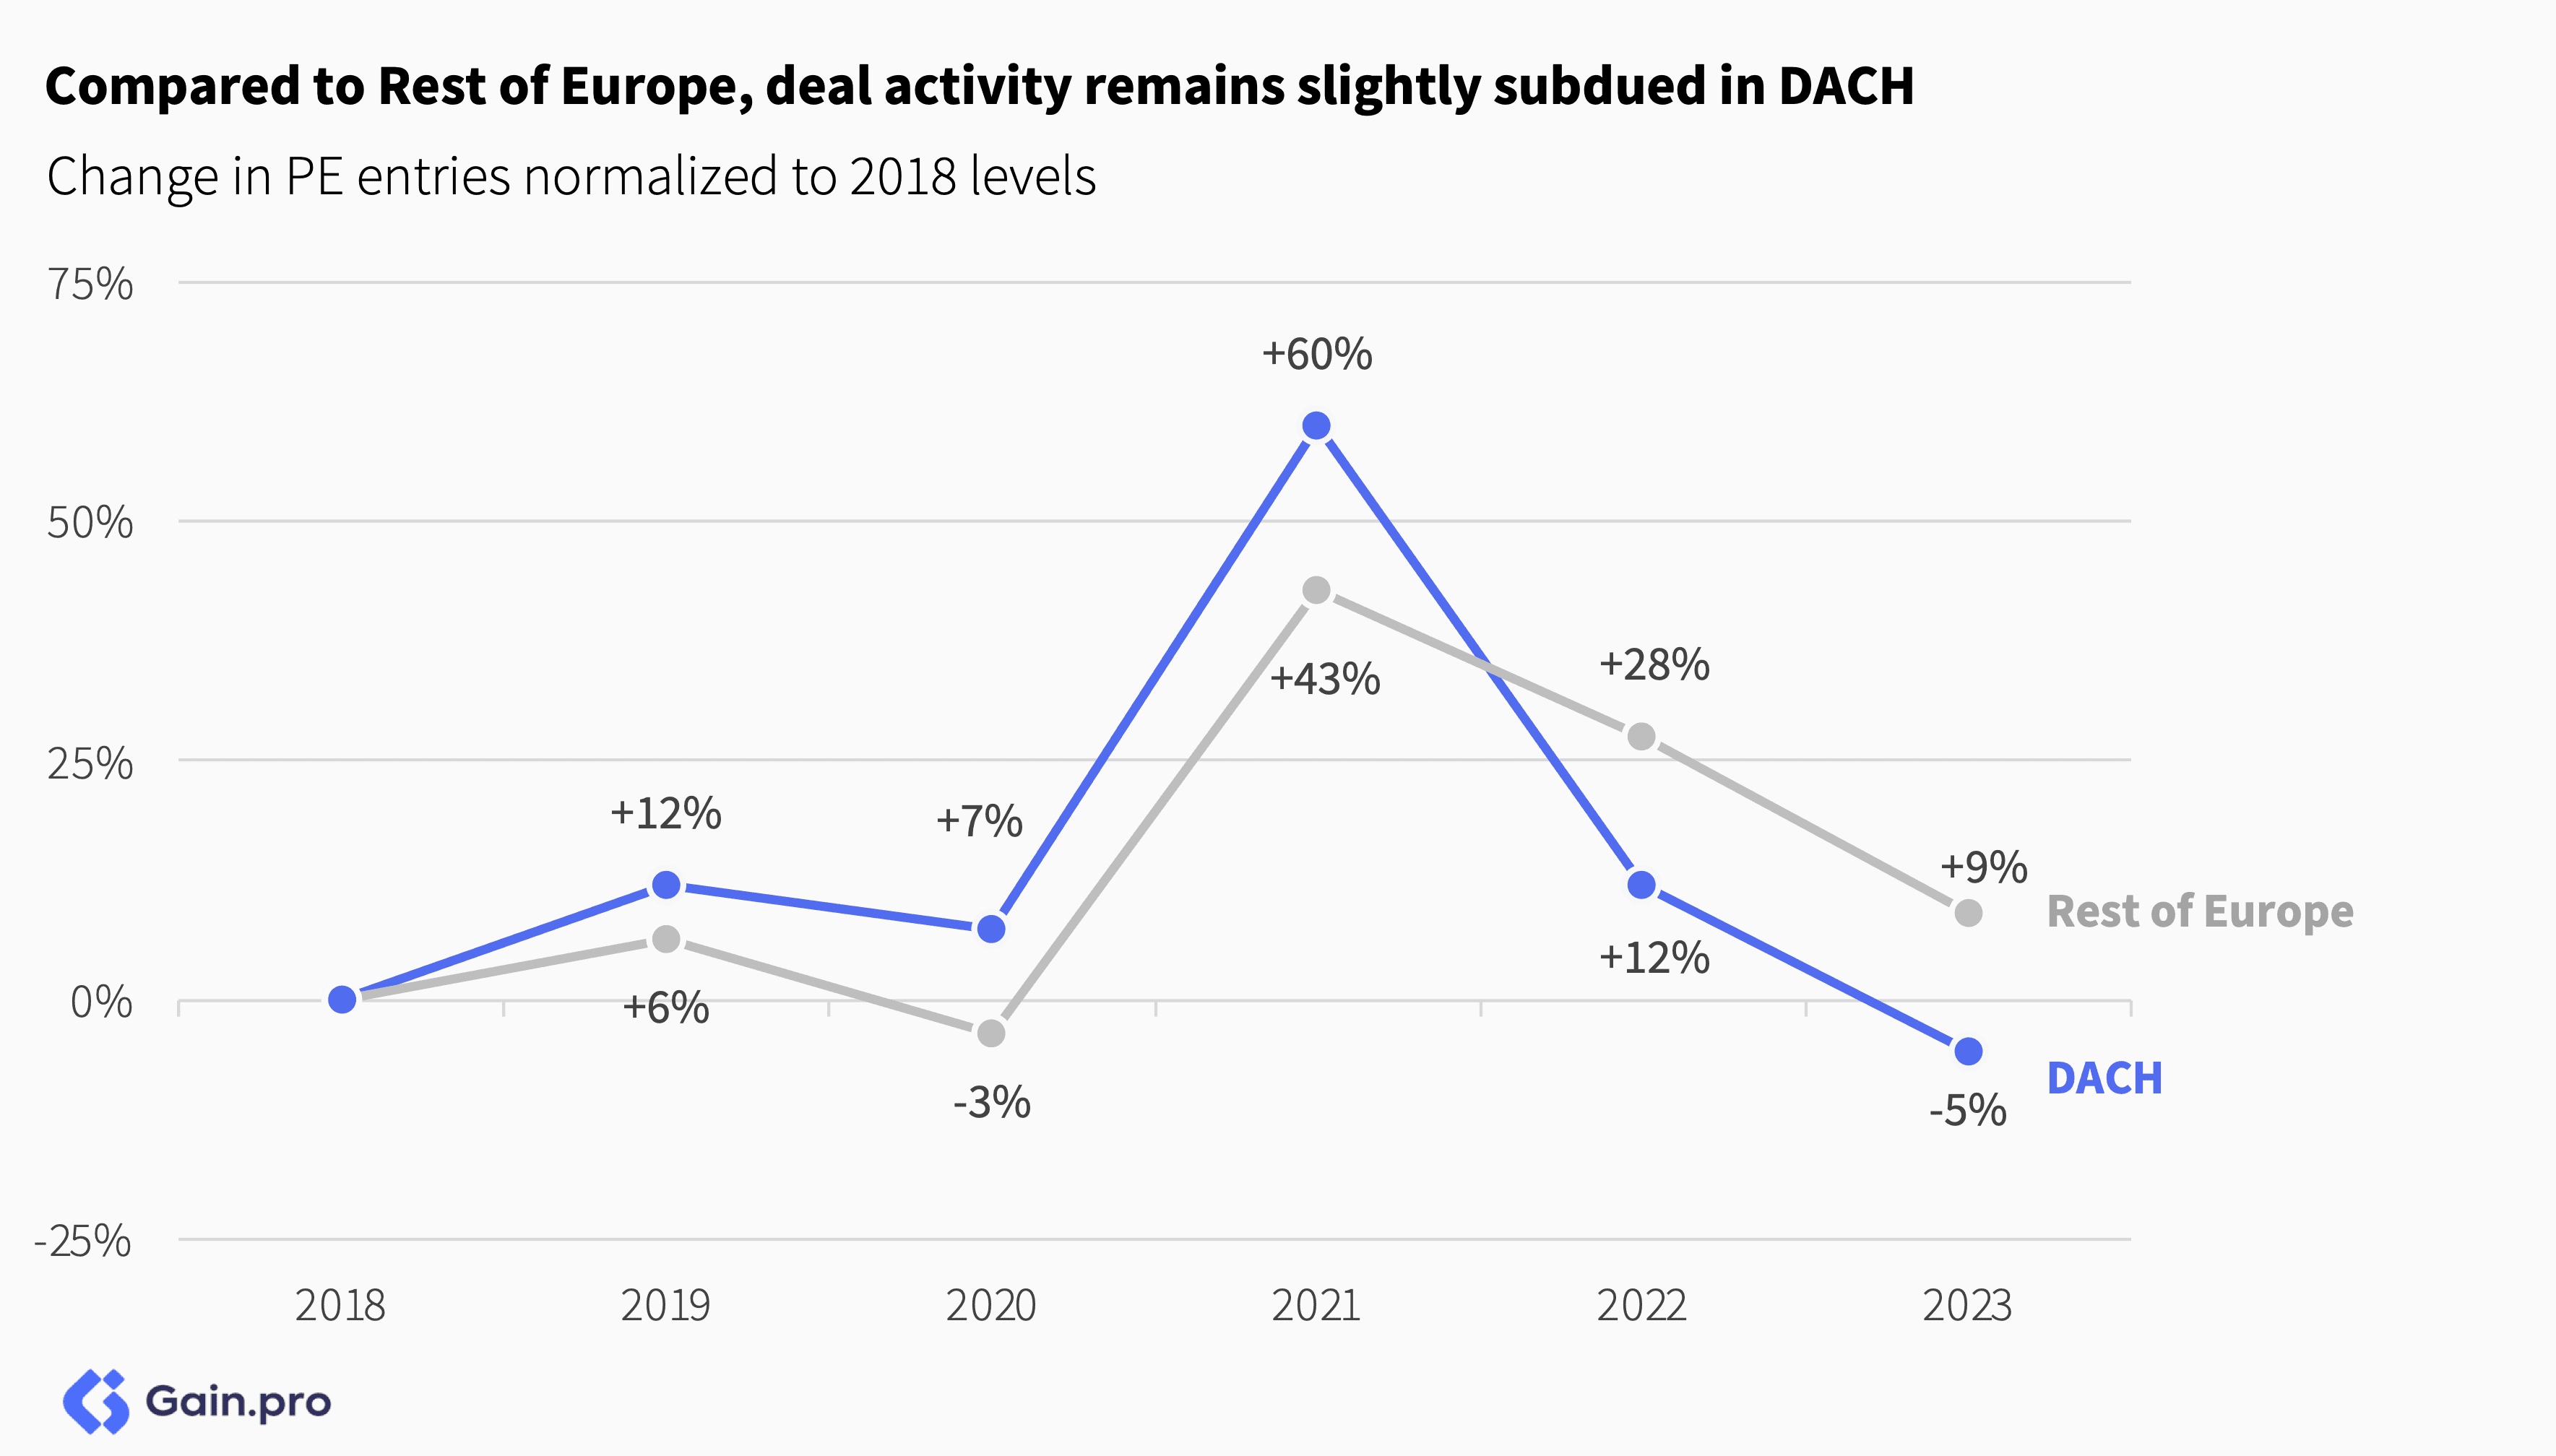
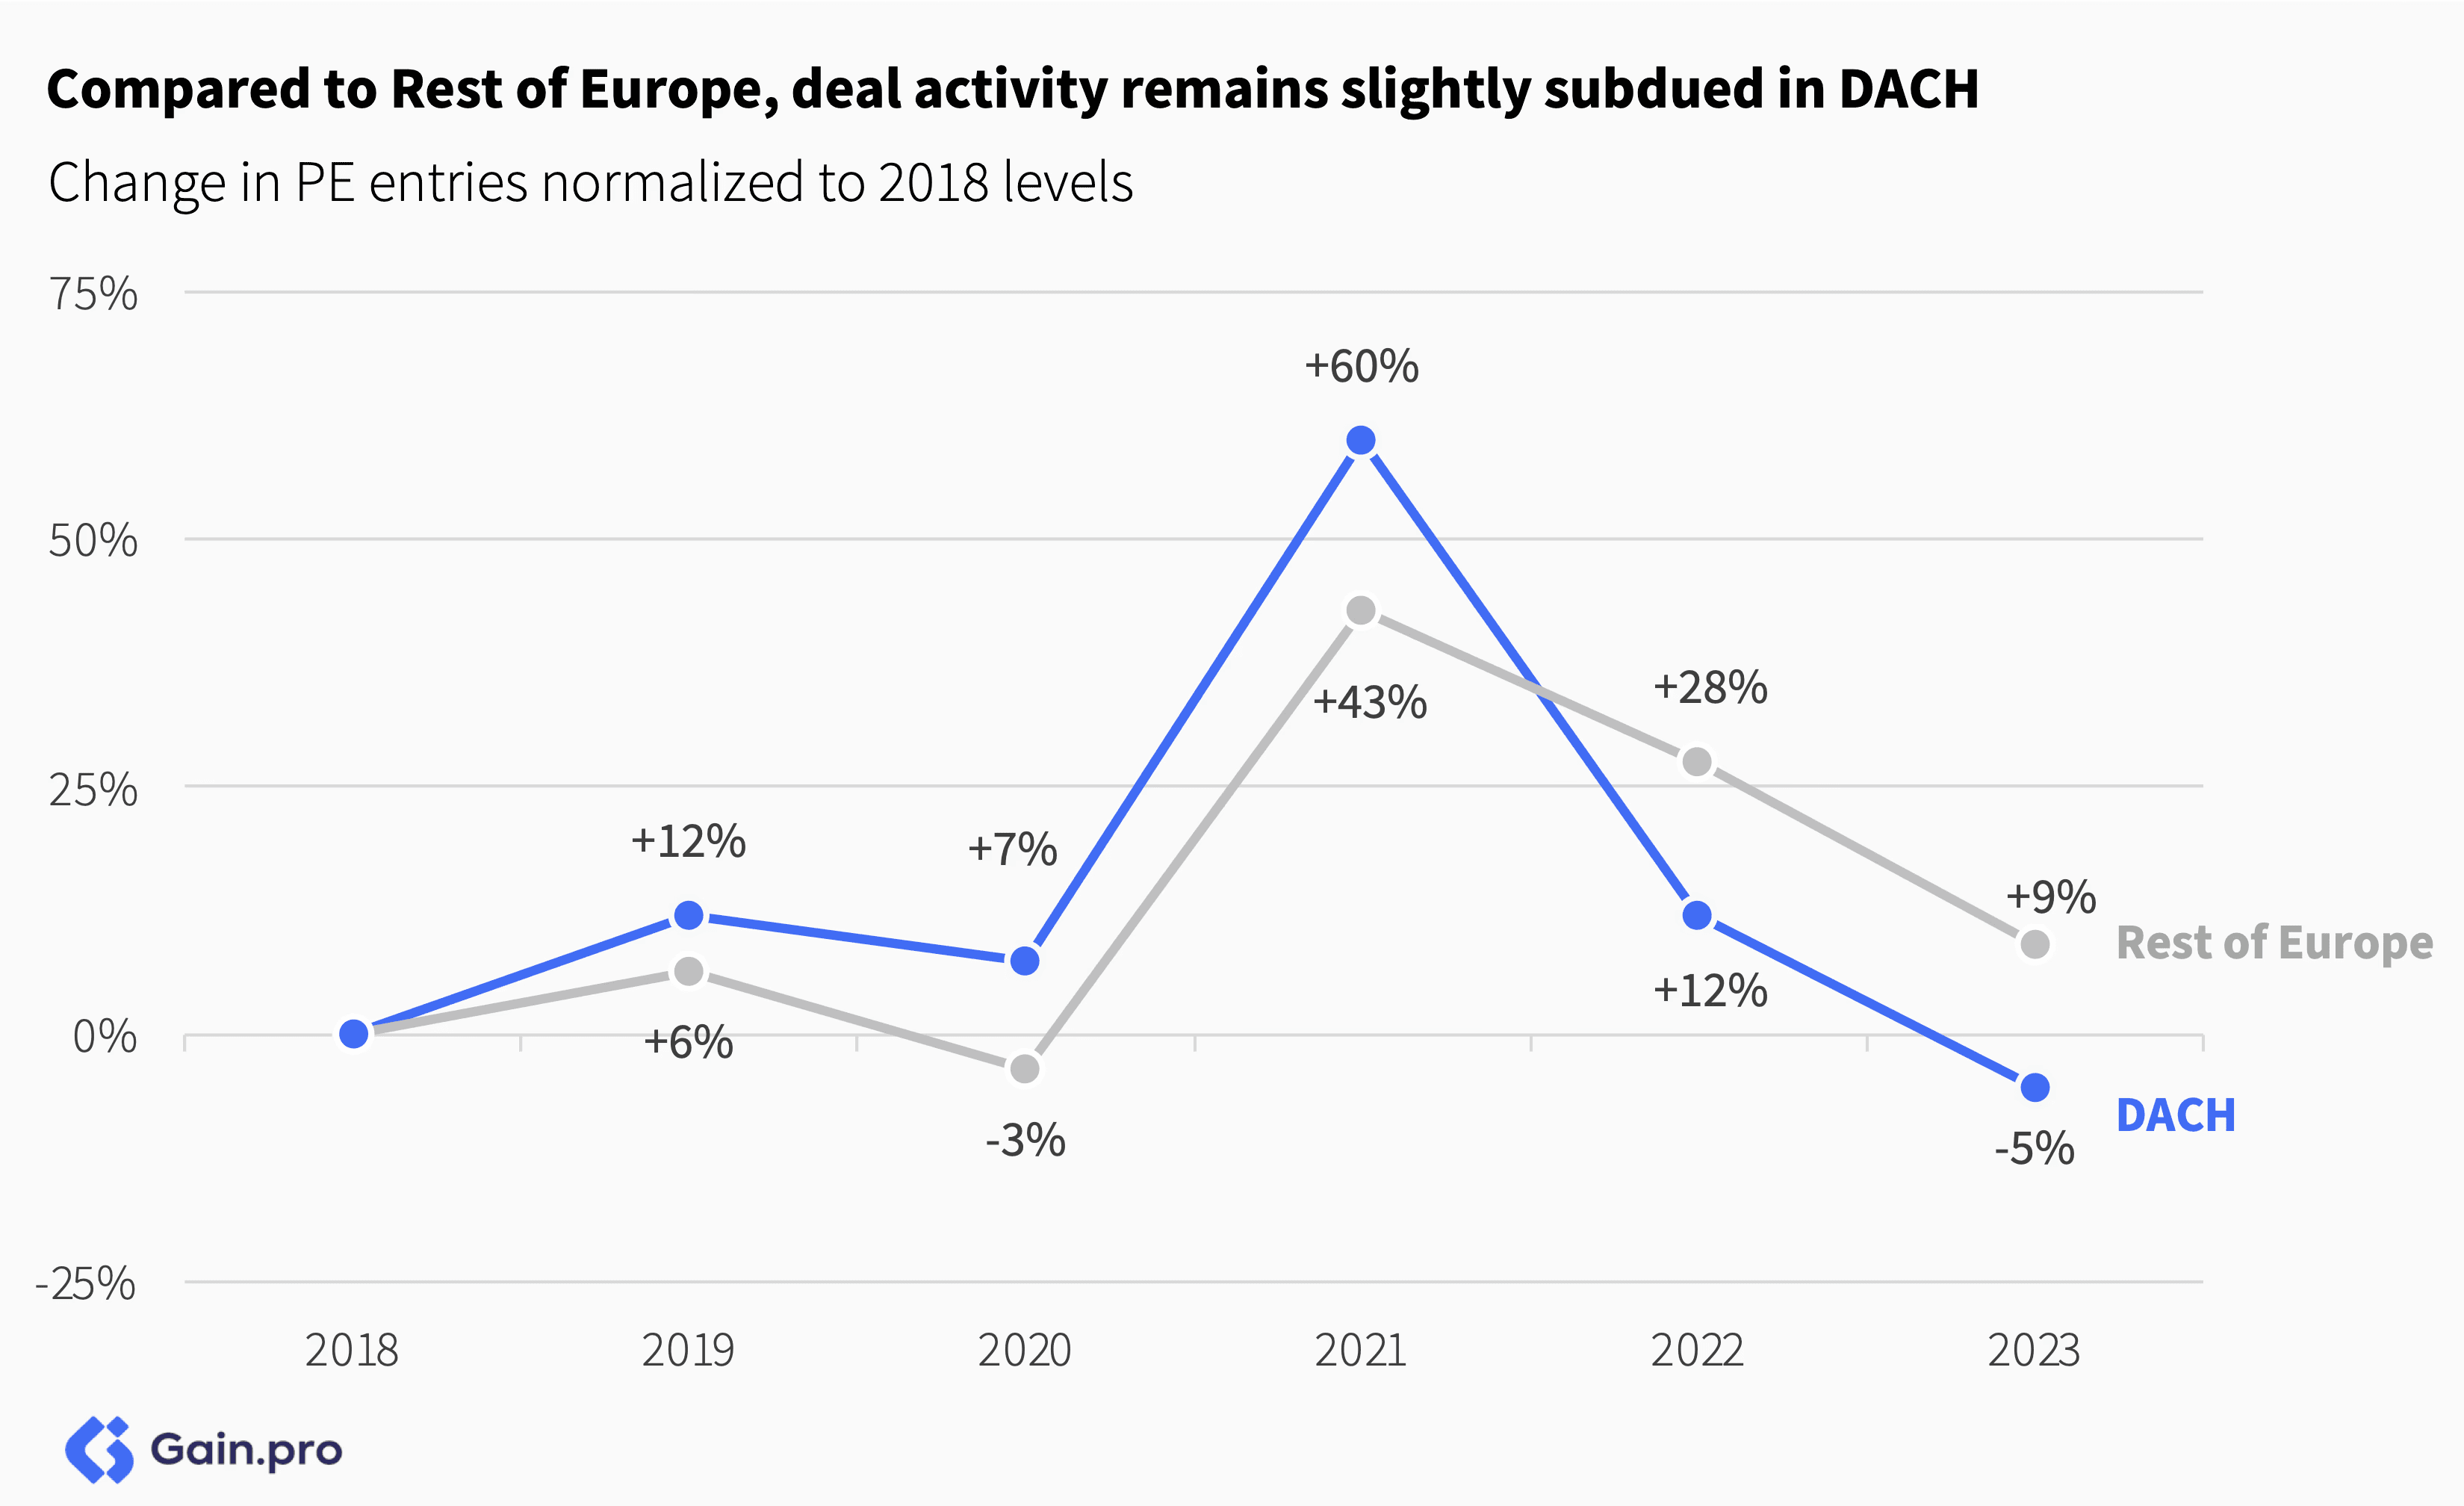
Compared to the Rest of Europe, deal activity remains slightly subdued in DACH, down 5% from 2018. While 2021 saw a surge in transactions, marking an exceptional year for the region, activity has since normalized, returning to more typical patterns observed before the pandemic-driven boom.
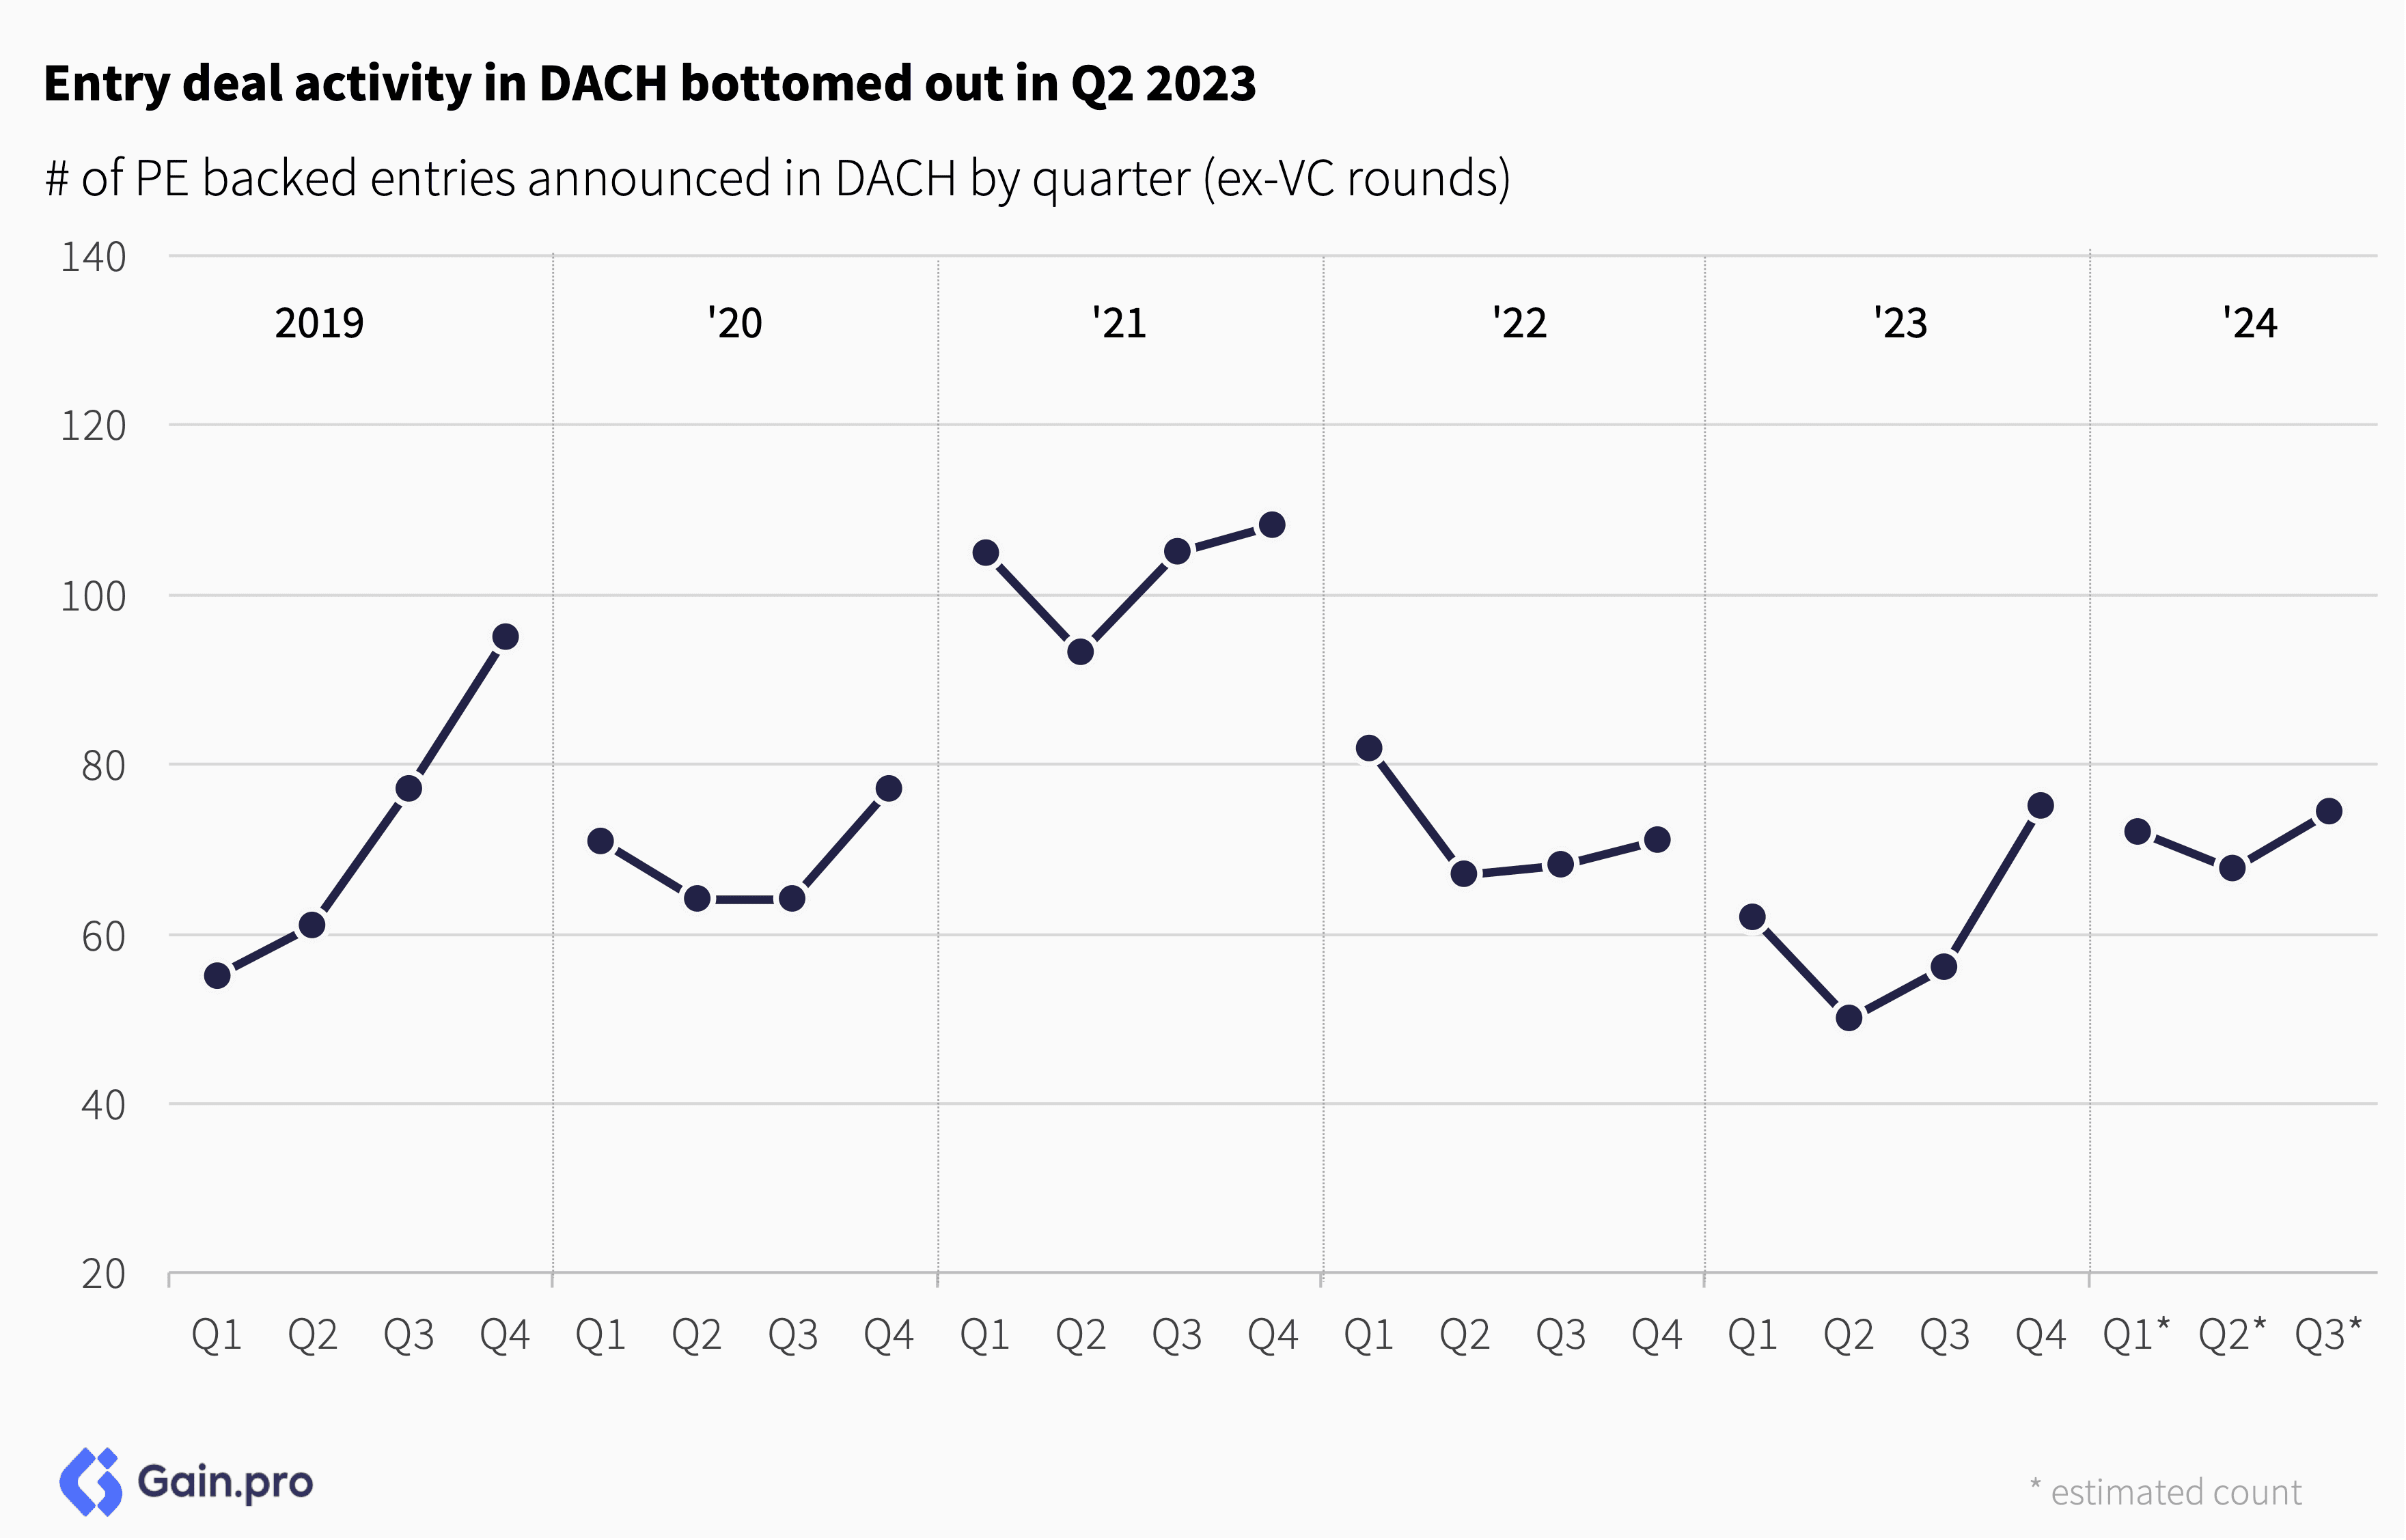
By quarter, entry deal activity in DACH reached its lowest point in Q2 2023 but has since stabilized throughout 2024. In contrast, the Rest of Europe saw its low point in Q1 2023. Looking ahead, we remain optimistic about deal activity in the region.
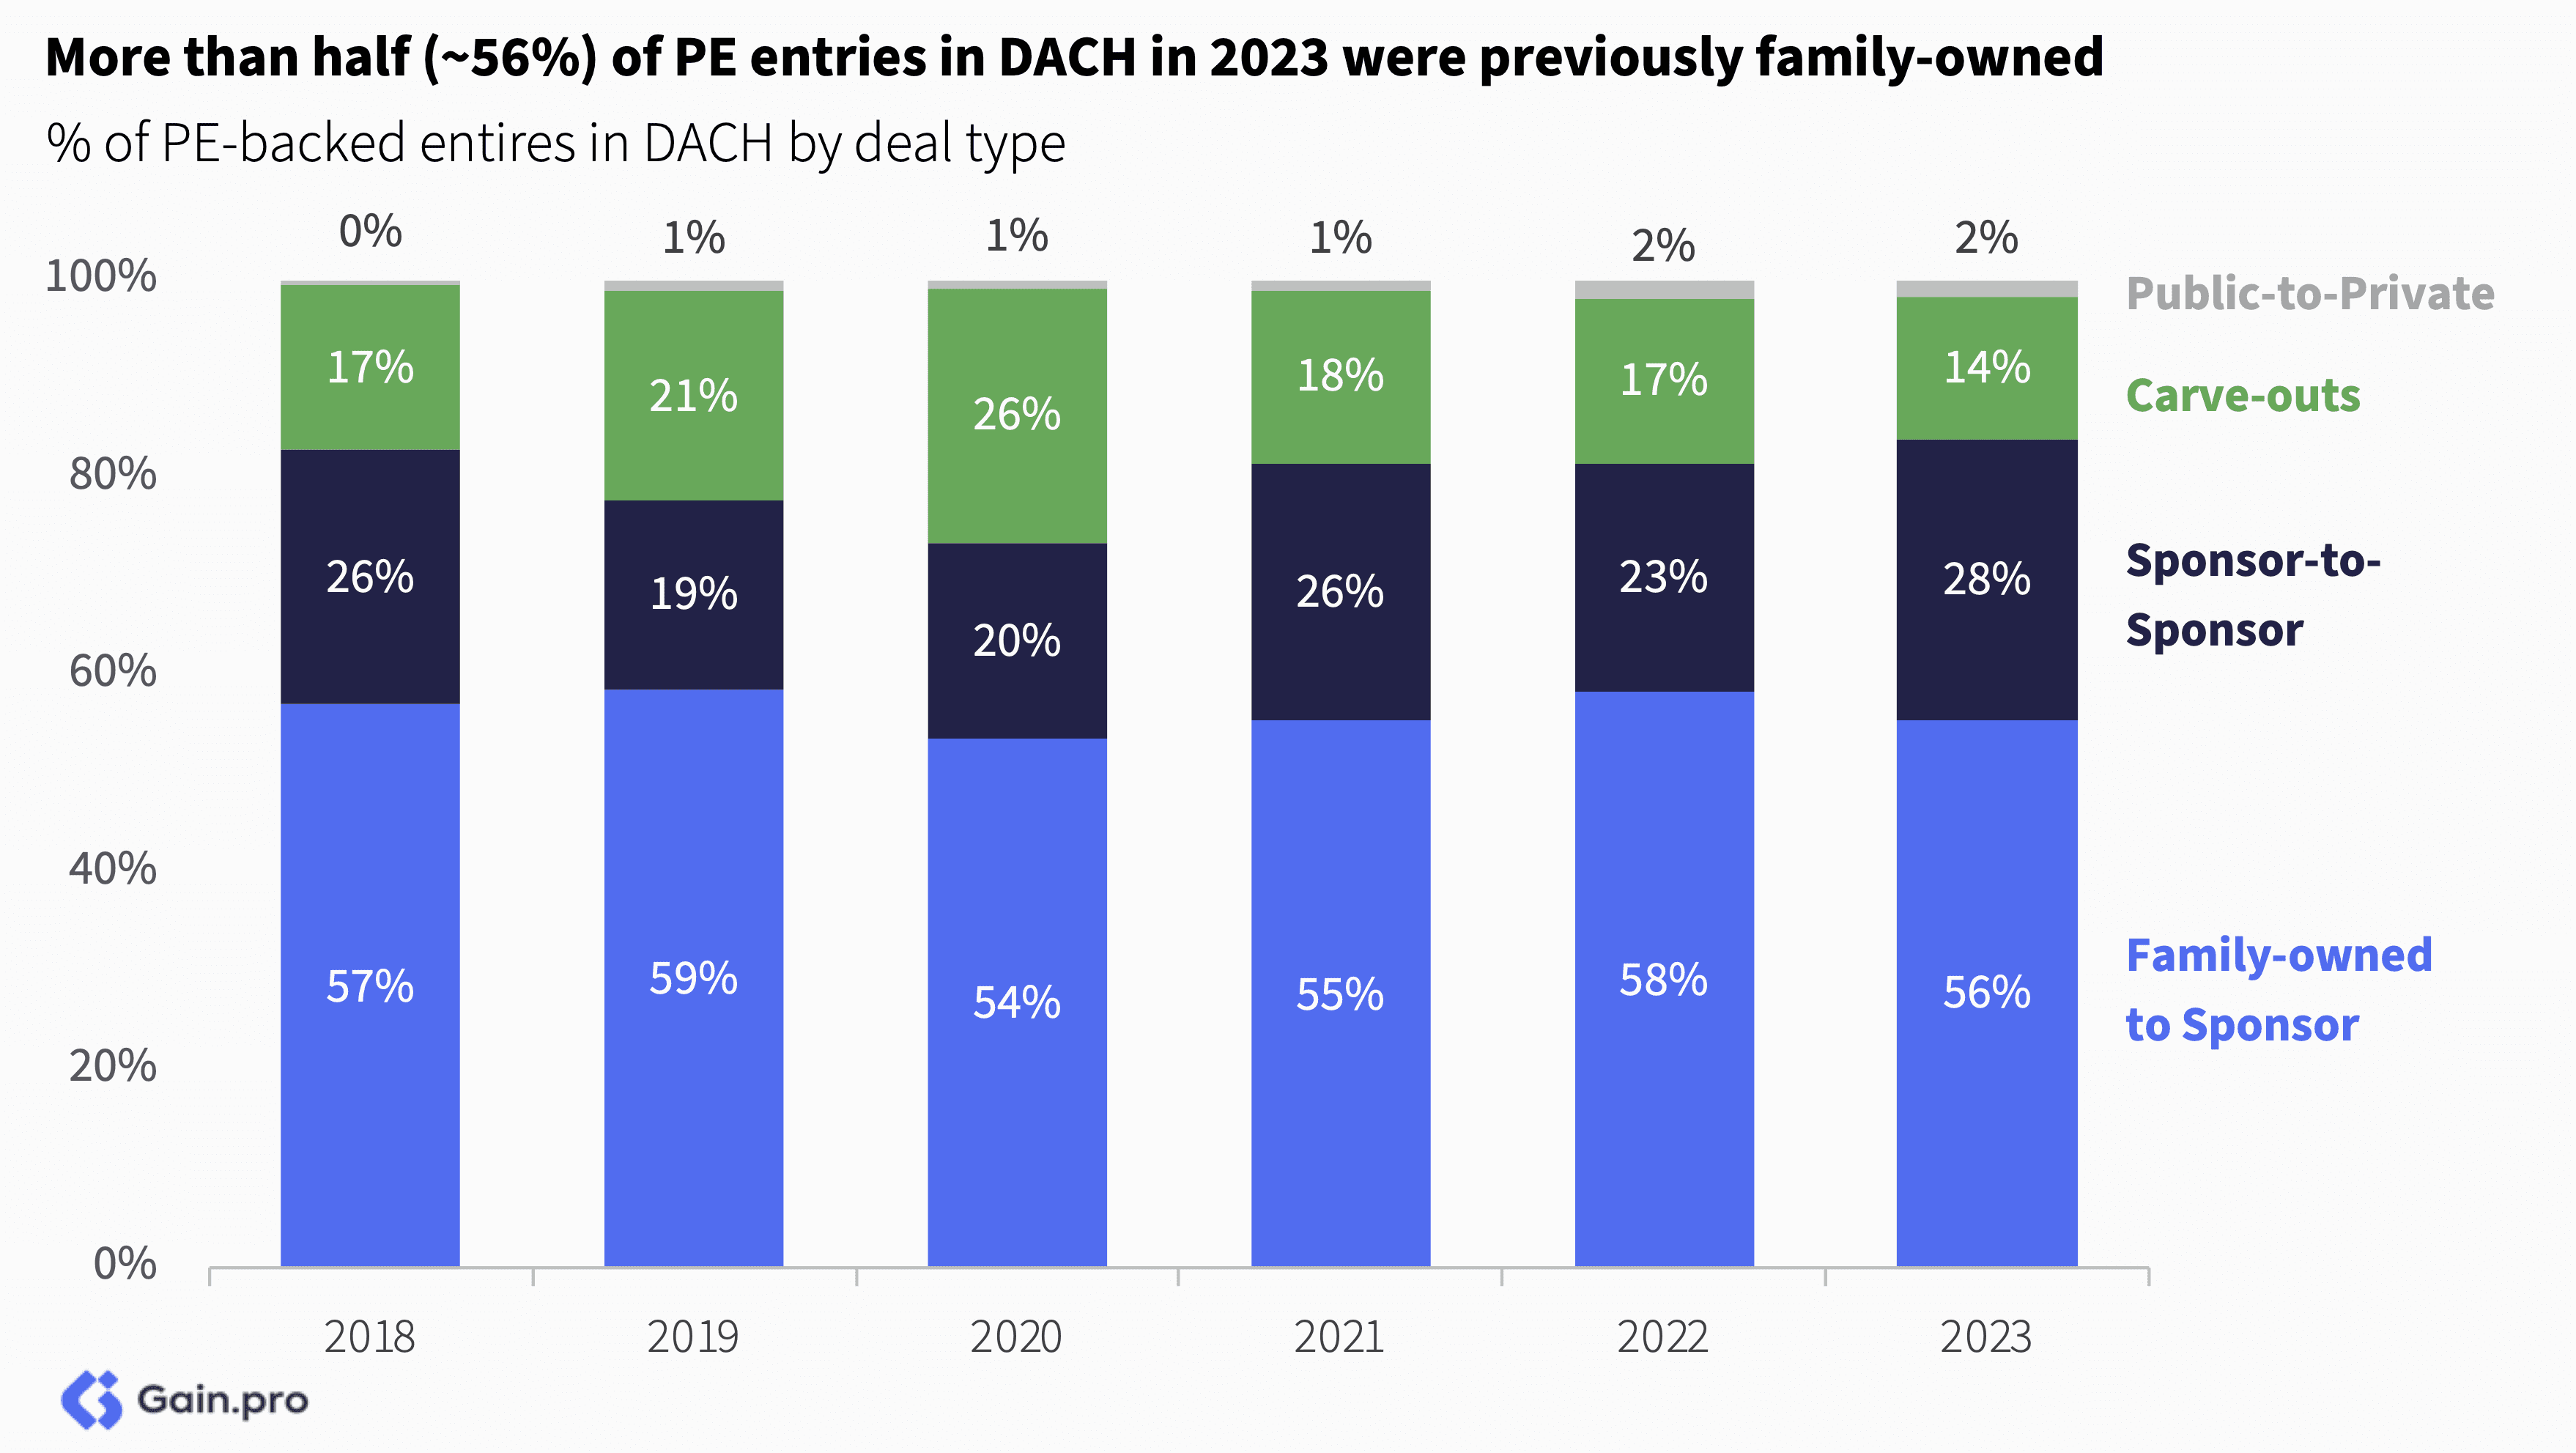
More than half (~56%) of PE entries in DACH in 2023 were previously family-owned, with this proportion remaining steady since 2018. The share of carve-outs has been shrinking since 2020 (down from 26% to 14% now) driven by a shift away from deal activity in carve-out-heavy sectors such as Industrials and Utilities and into asset-light sectors such as TMT.
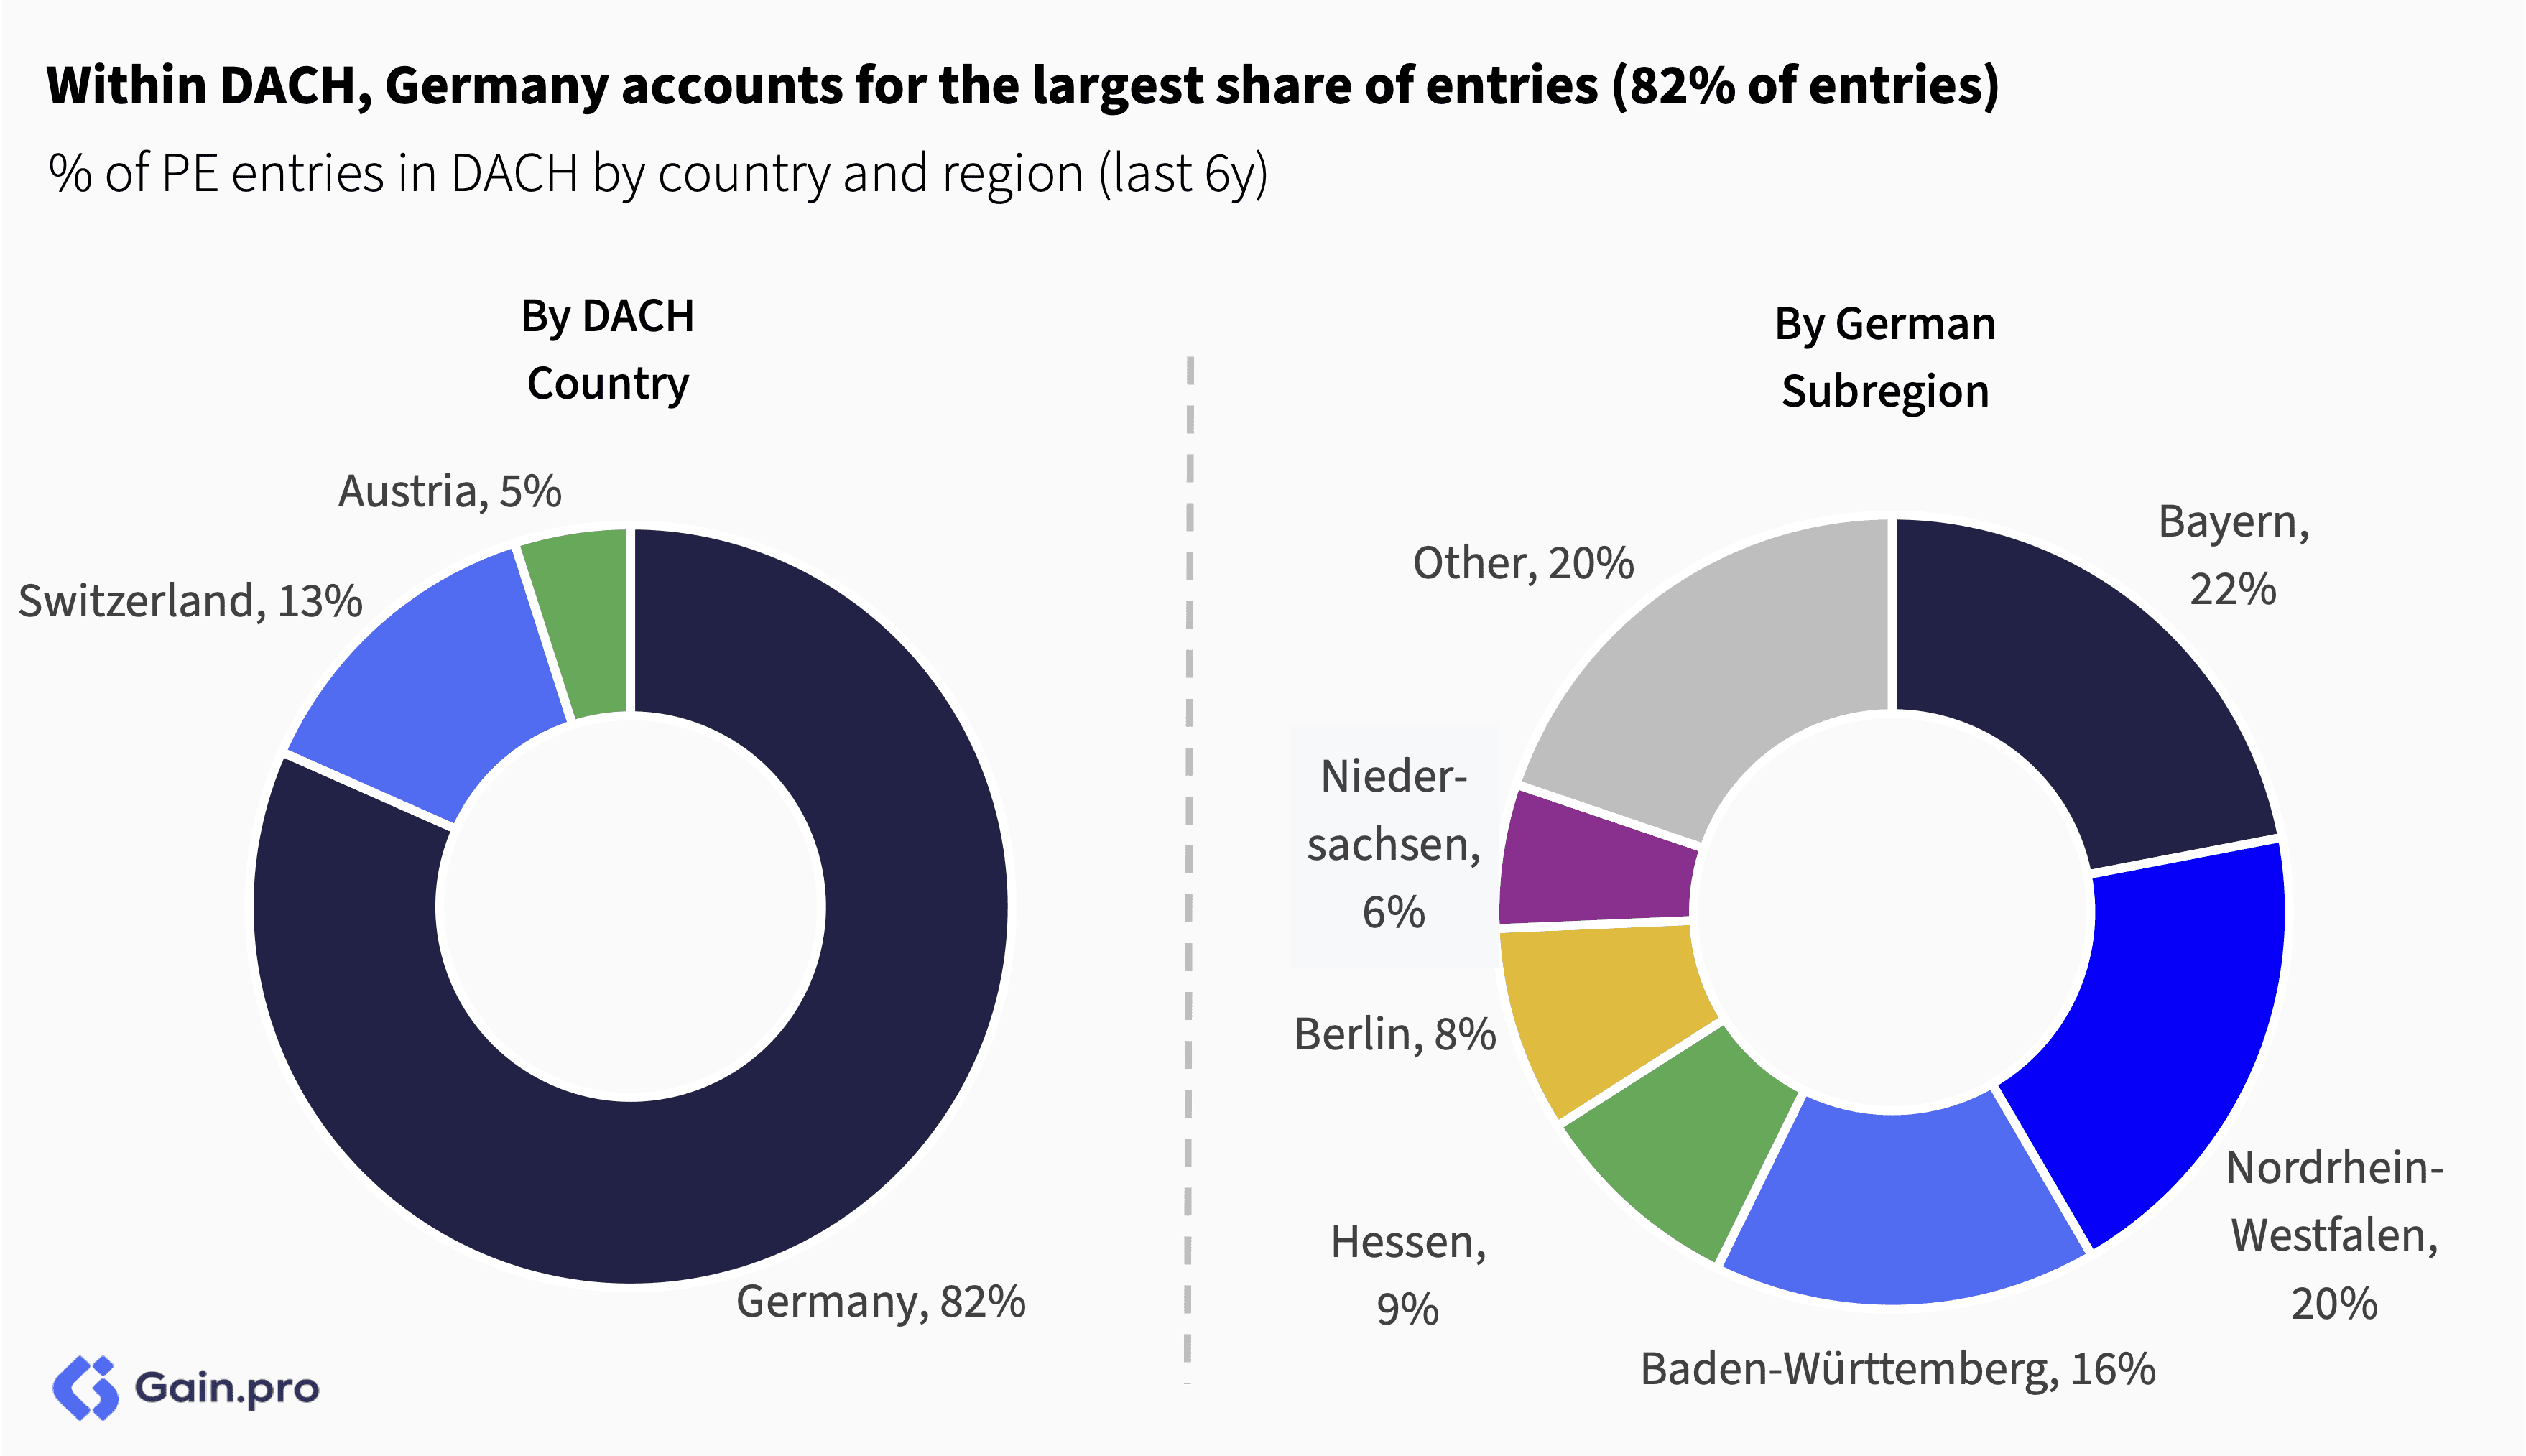
Within DACH, Germany accounts for the largest share of entries (82% of entries), followed by Switzerland (13%) and Austria (5%). Within Germany, the states of Bayern, Nordrhein-Westfalen, and Baden-Württemberg account for 58% of deals.
Sector Trends
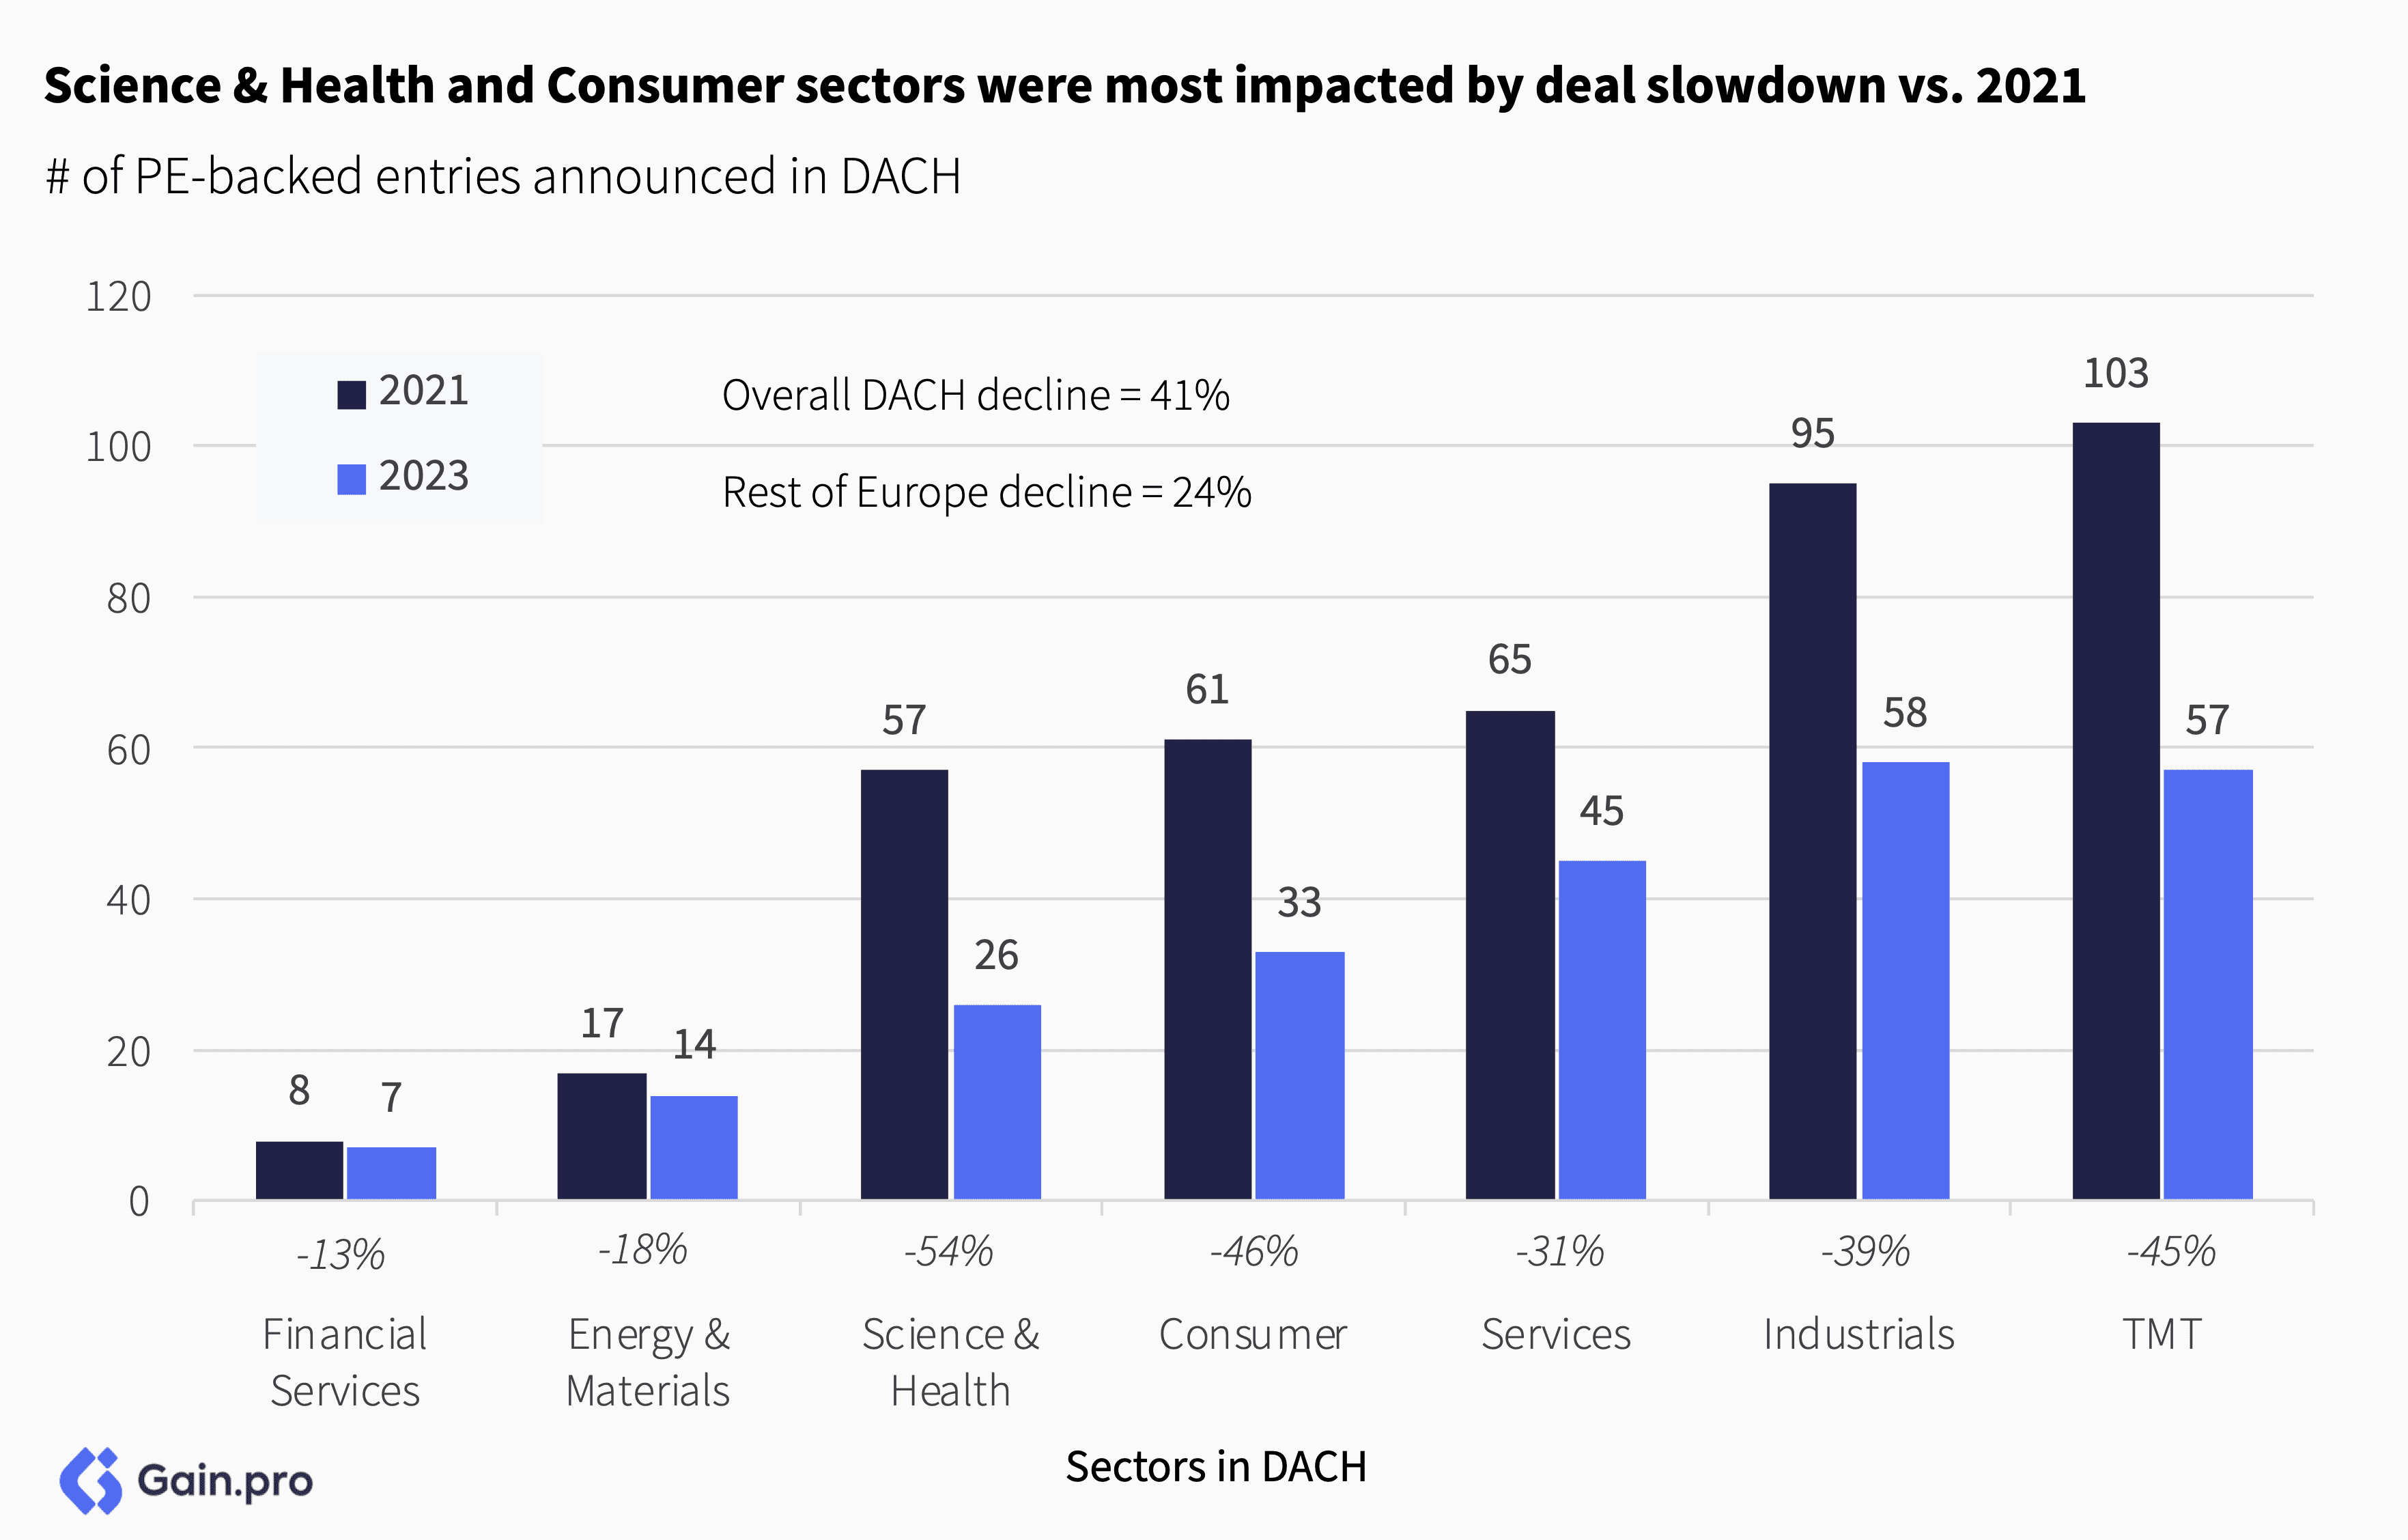
Science & Health and Consumer have been most affected by the deal downturn vs. 2021. These sectors have seen entry volume decline by 55% and 43%, respectively. The least affected sectors were low-volume Energy & Materials and Financial Services.
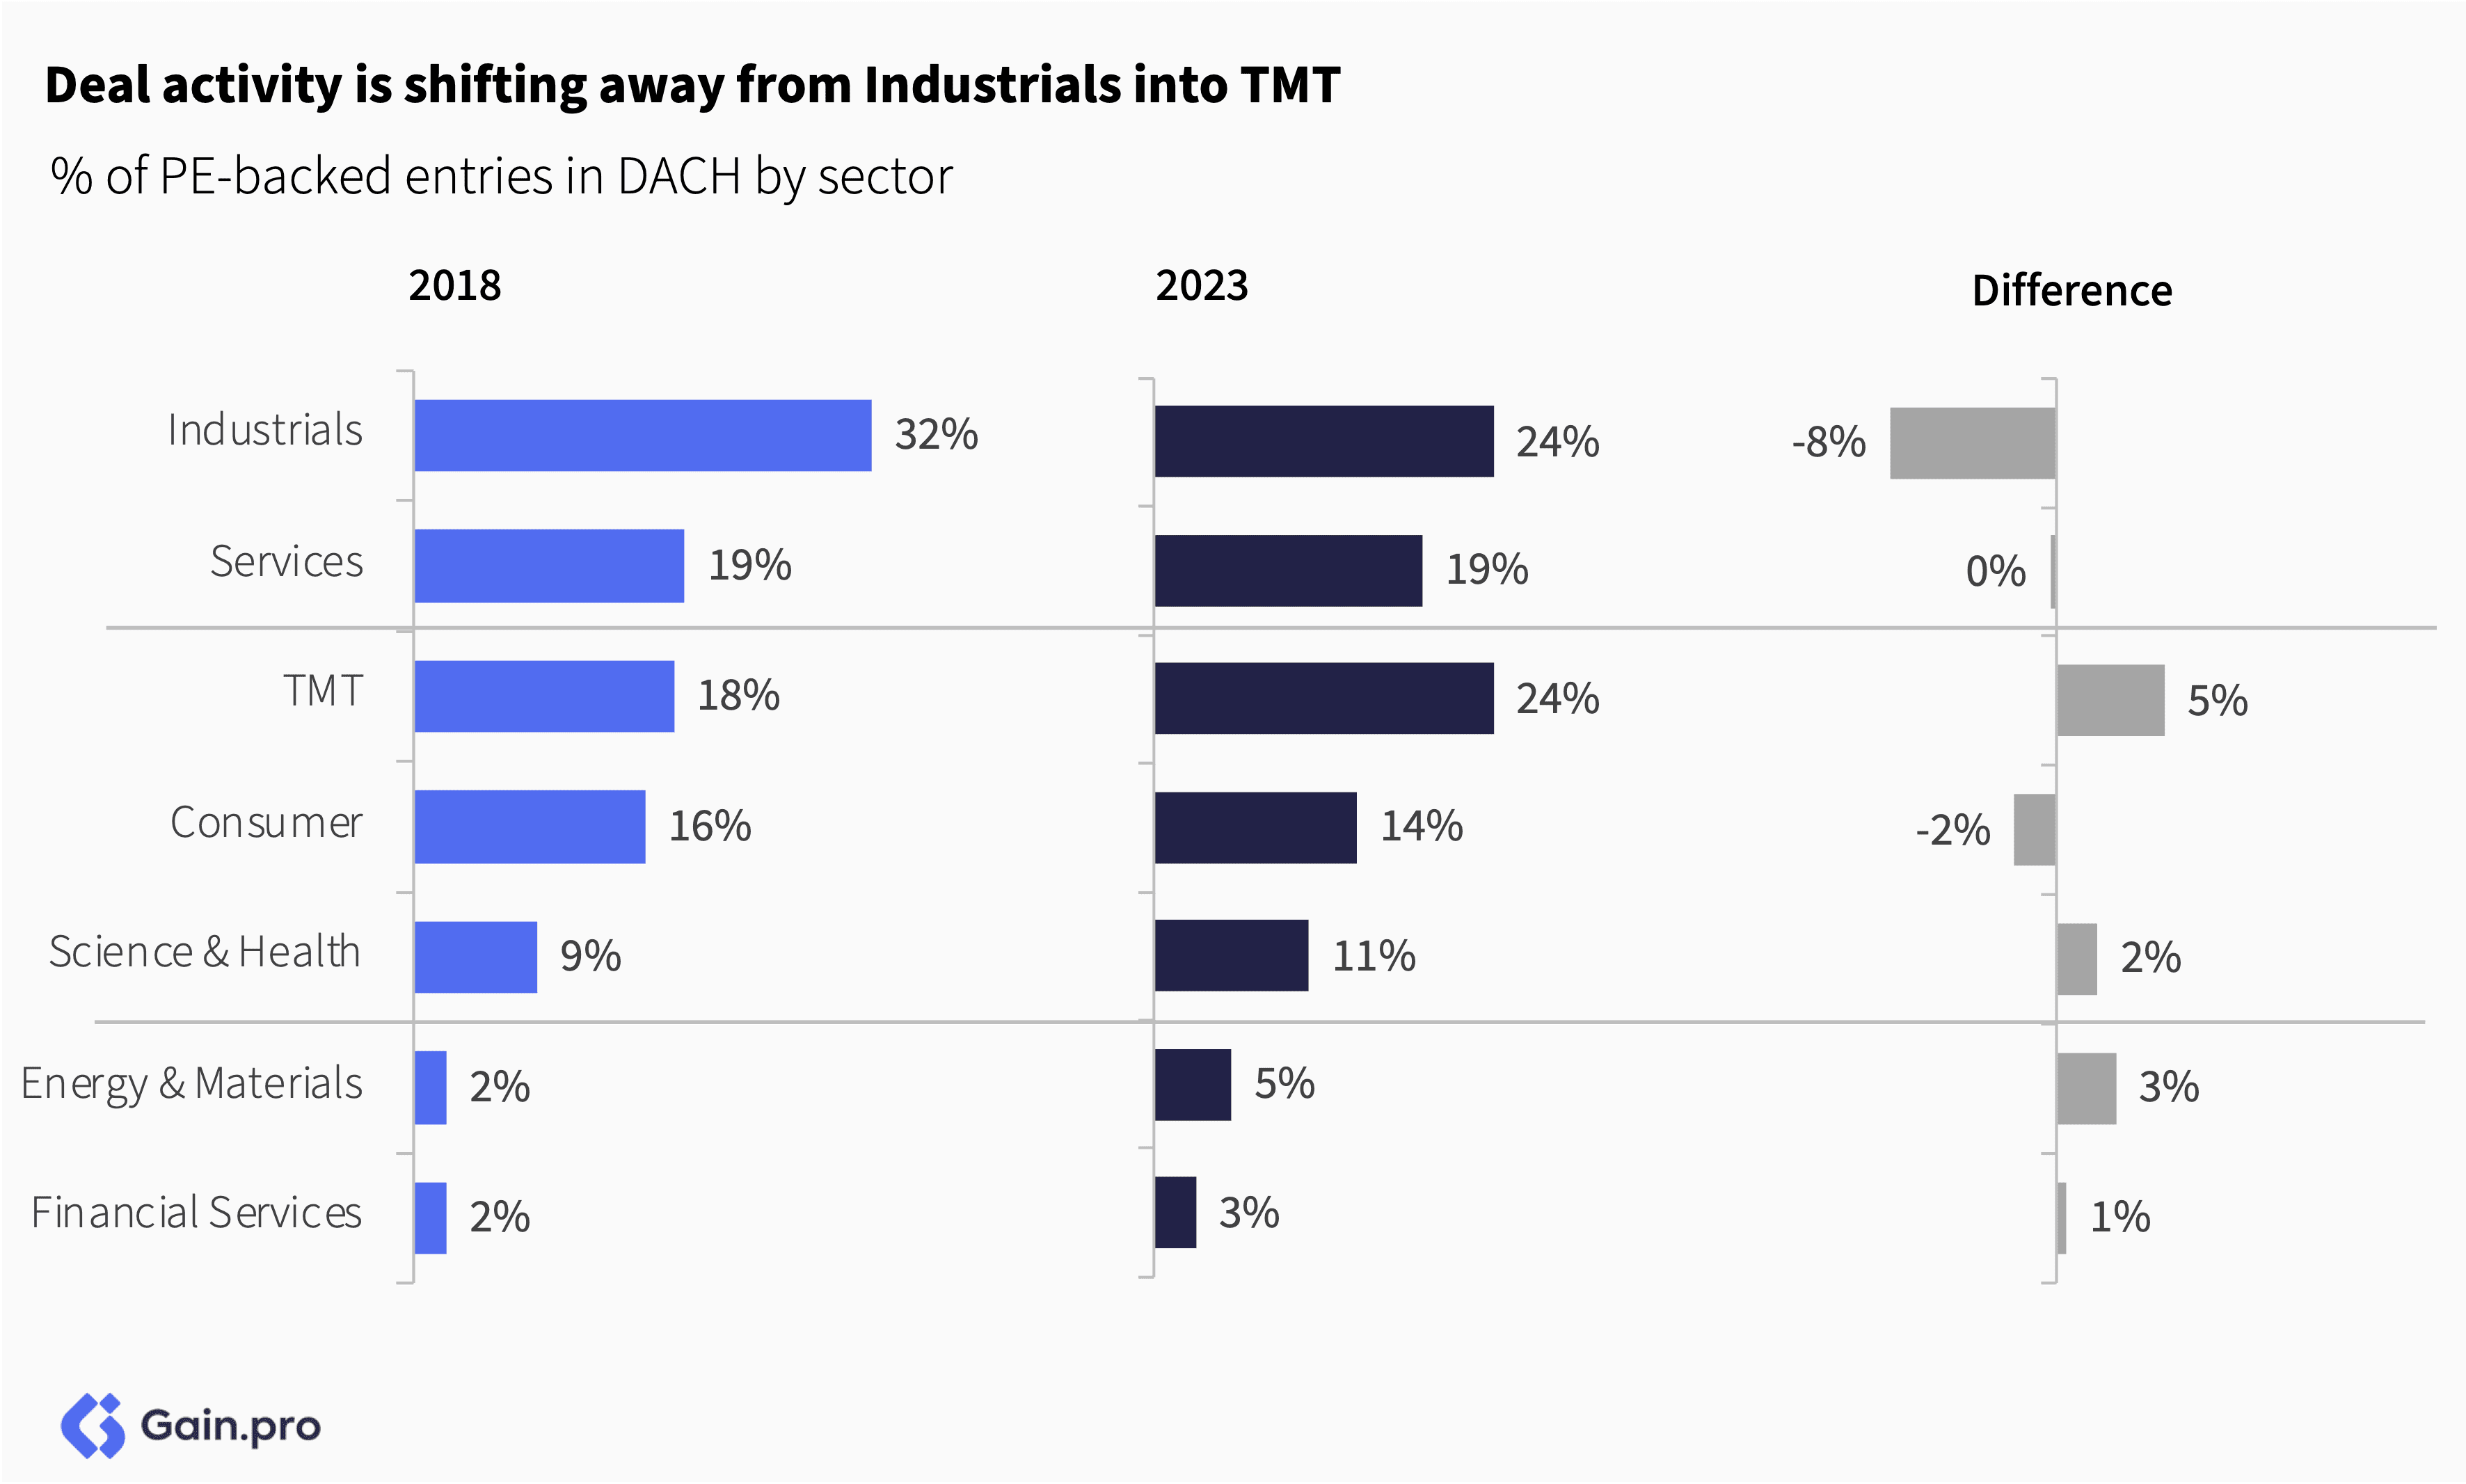
Over the longer term, the share of industrial entries is declining in the DACH region, with TMT seeing increased demand as interest shifts toward innovation and high-growth sectors. Furthermore, Energy & Materials is becoming more popular as an investment target.
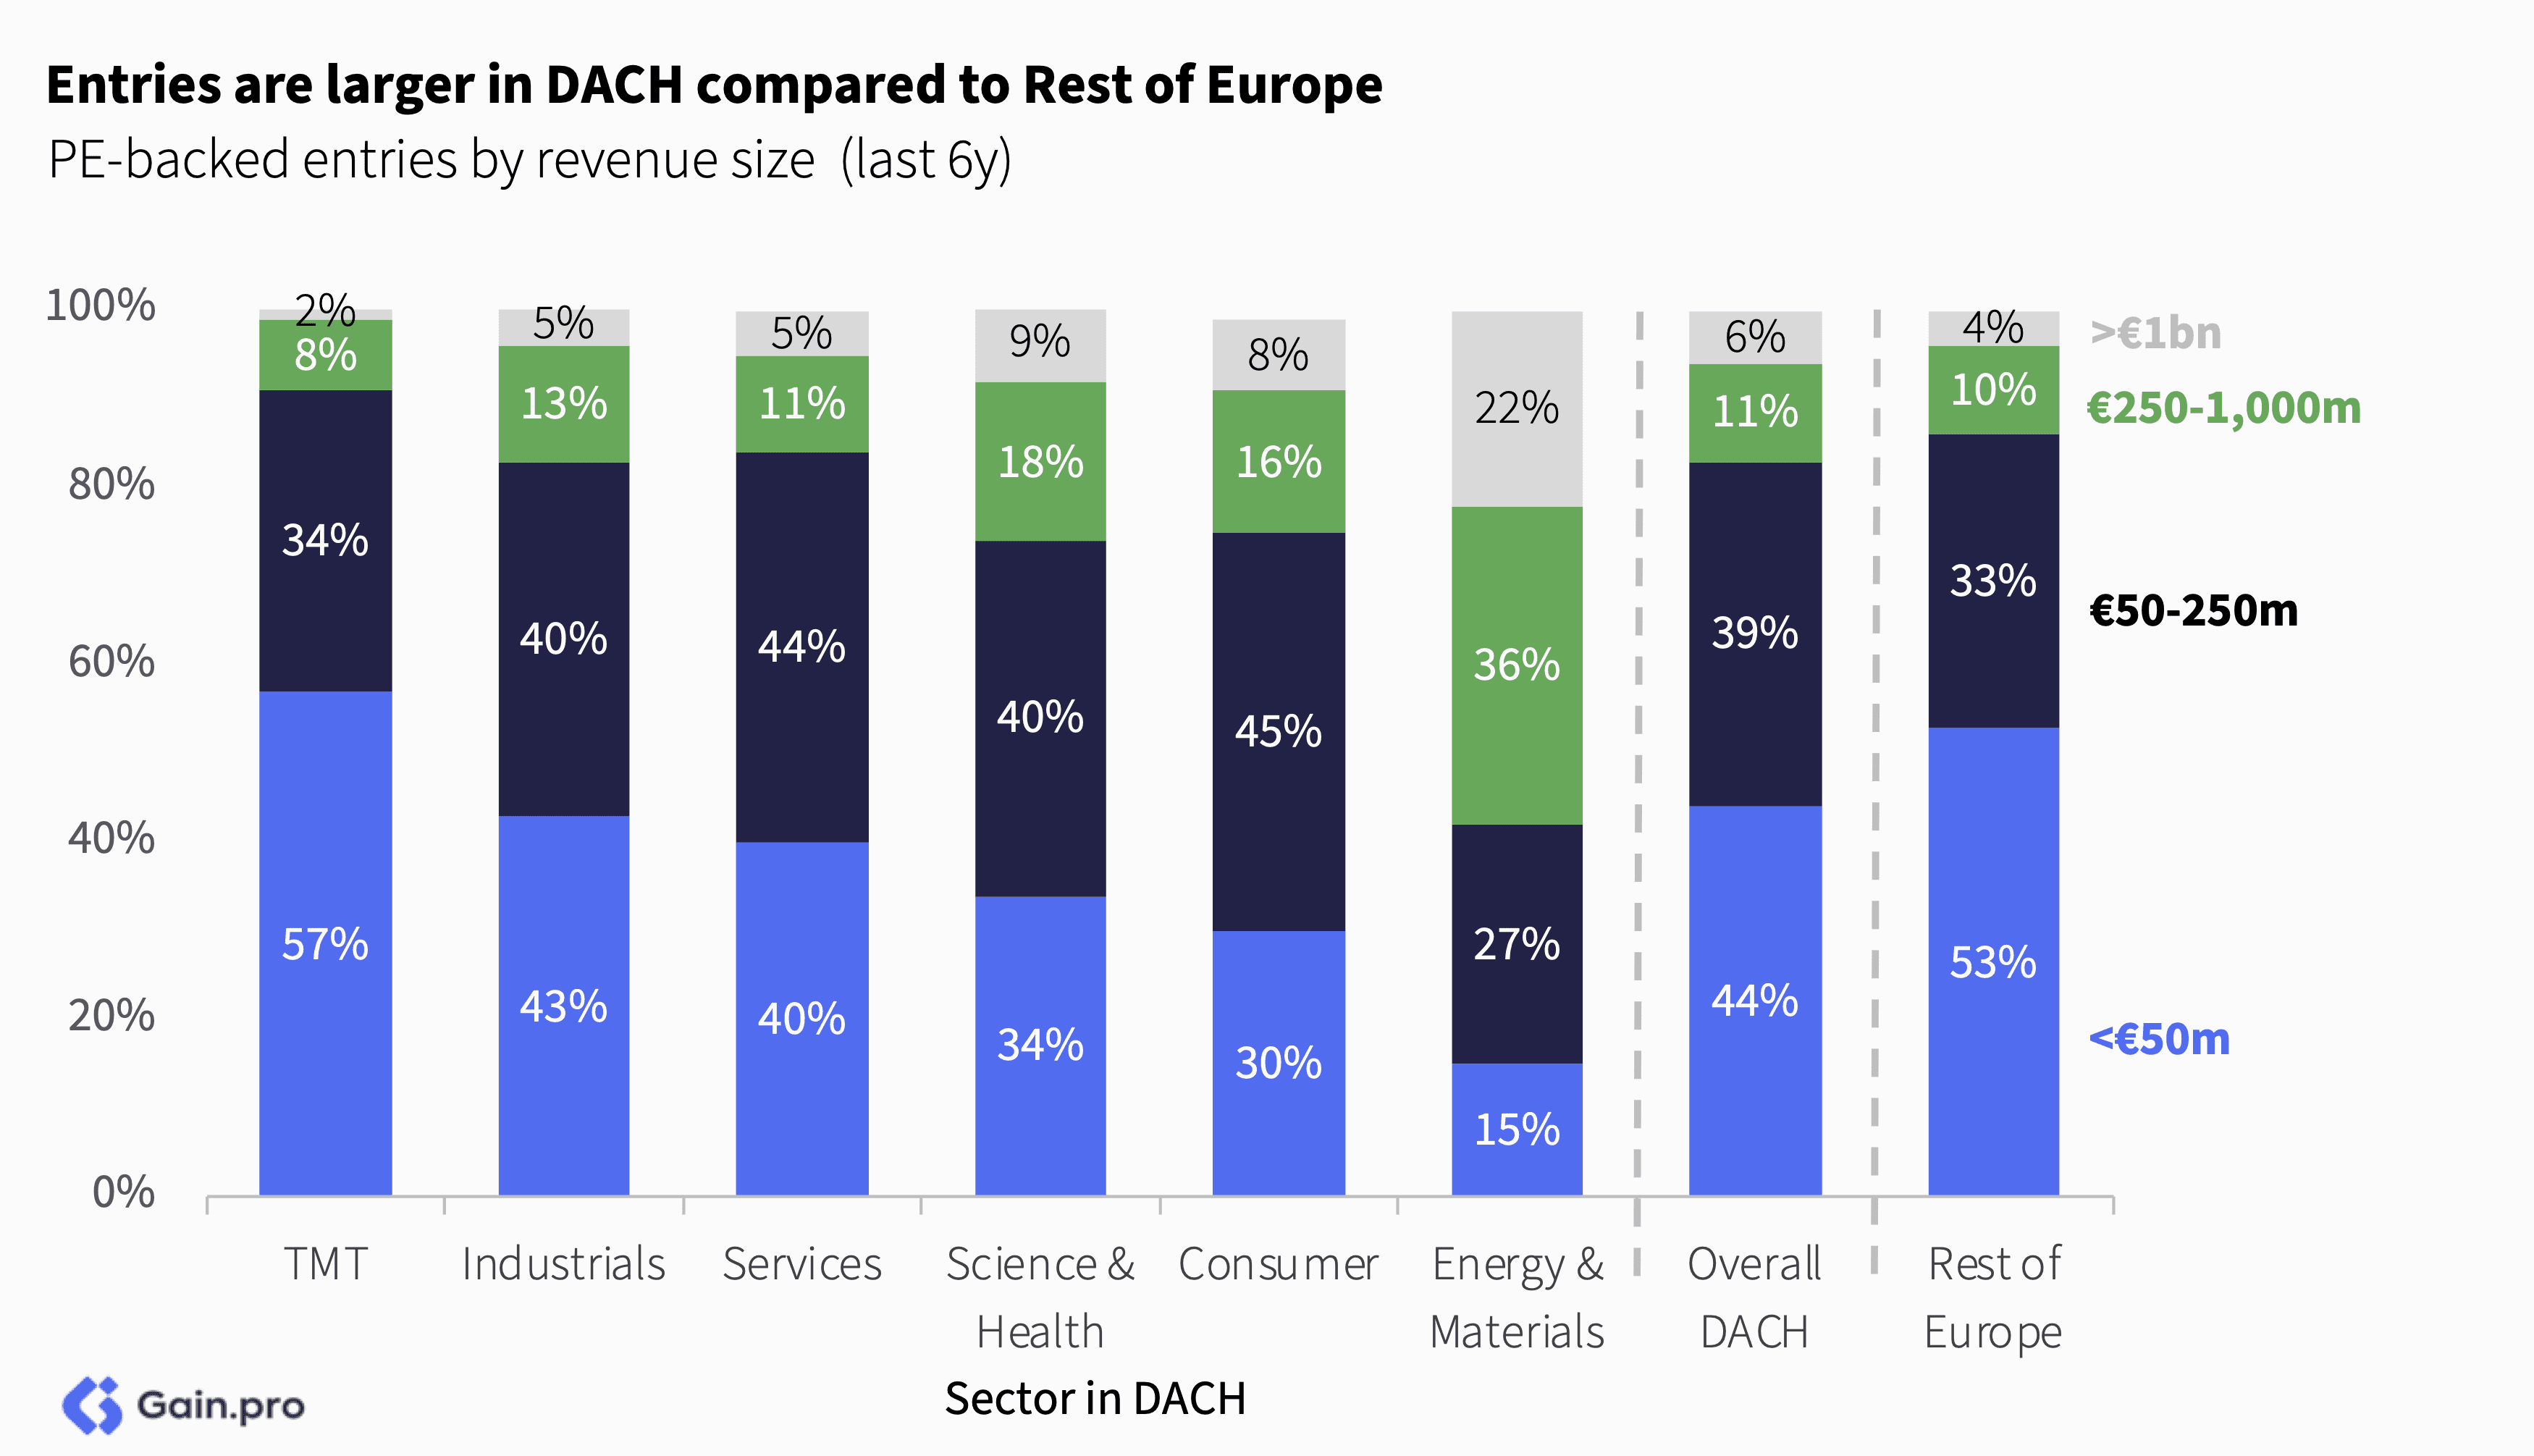
By share, entries are larger in DACH compared to the Rest of Europe. >€1bn revenue deals are prominent in the Energy & Materials and Consumer sectors, while Services, Industrials and TMT have a high proportion of <€50m revenue transactions.
Buy-and-Build
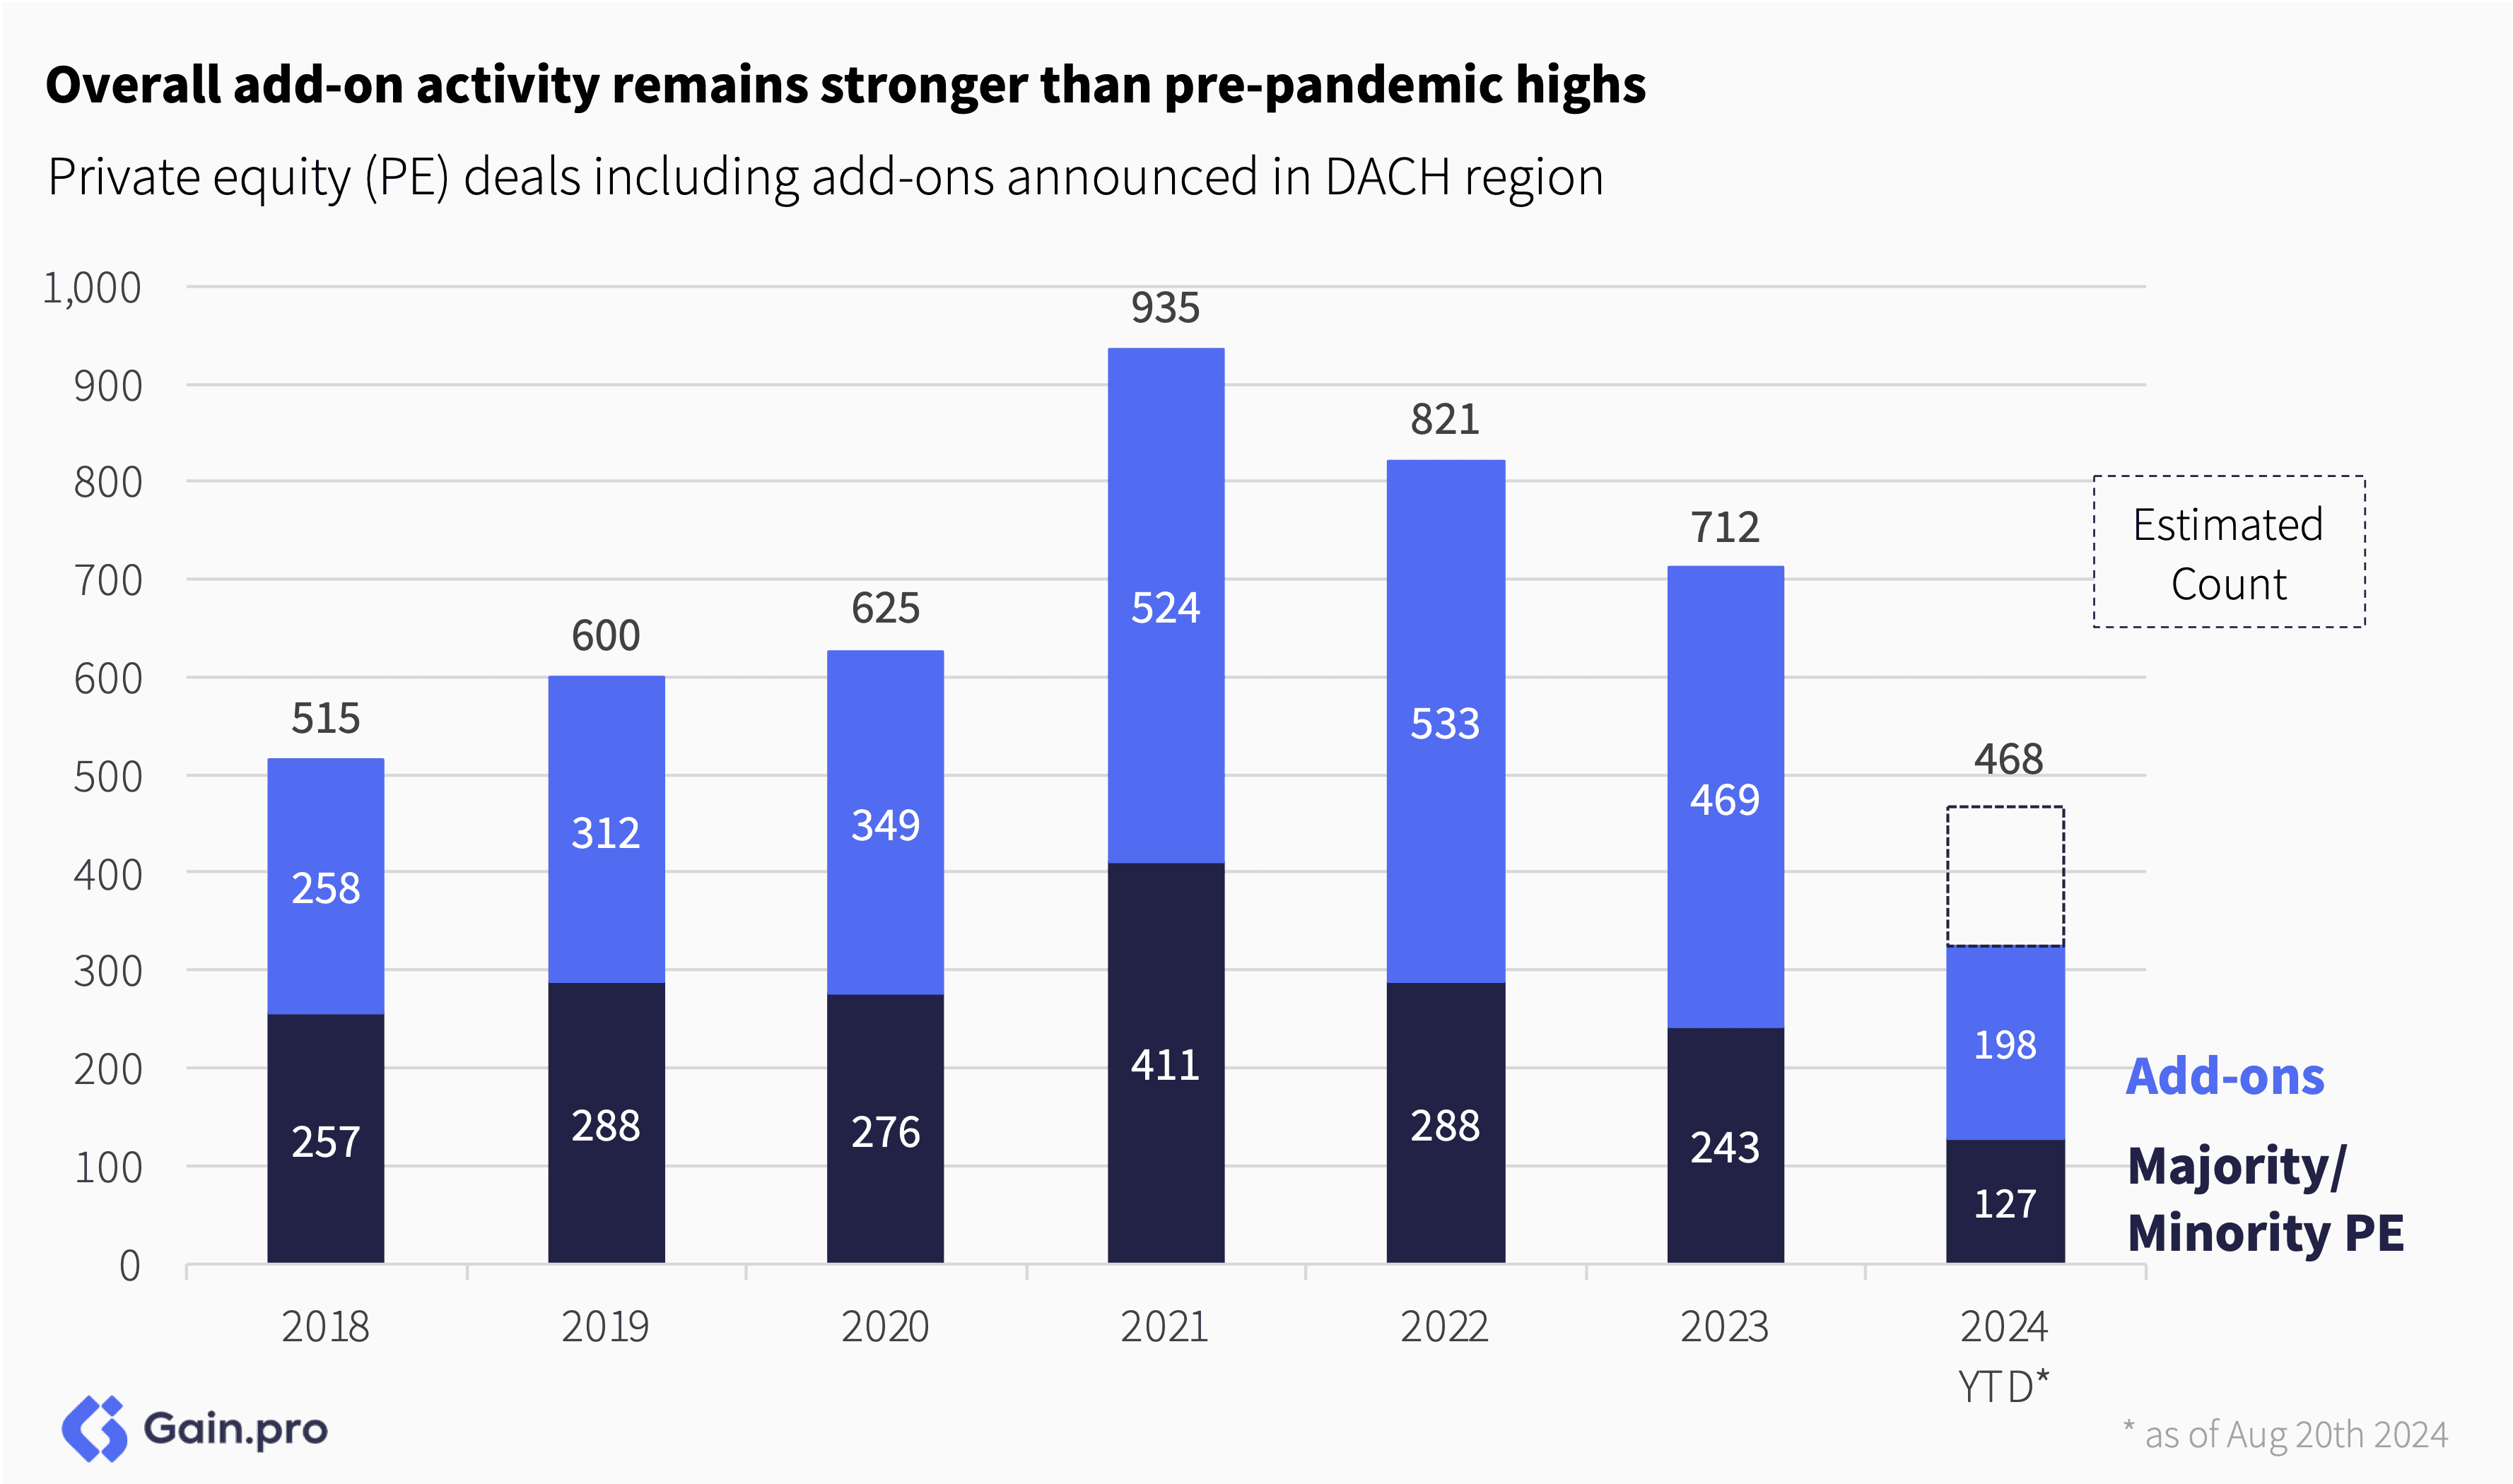
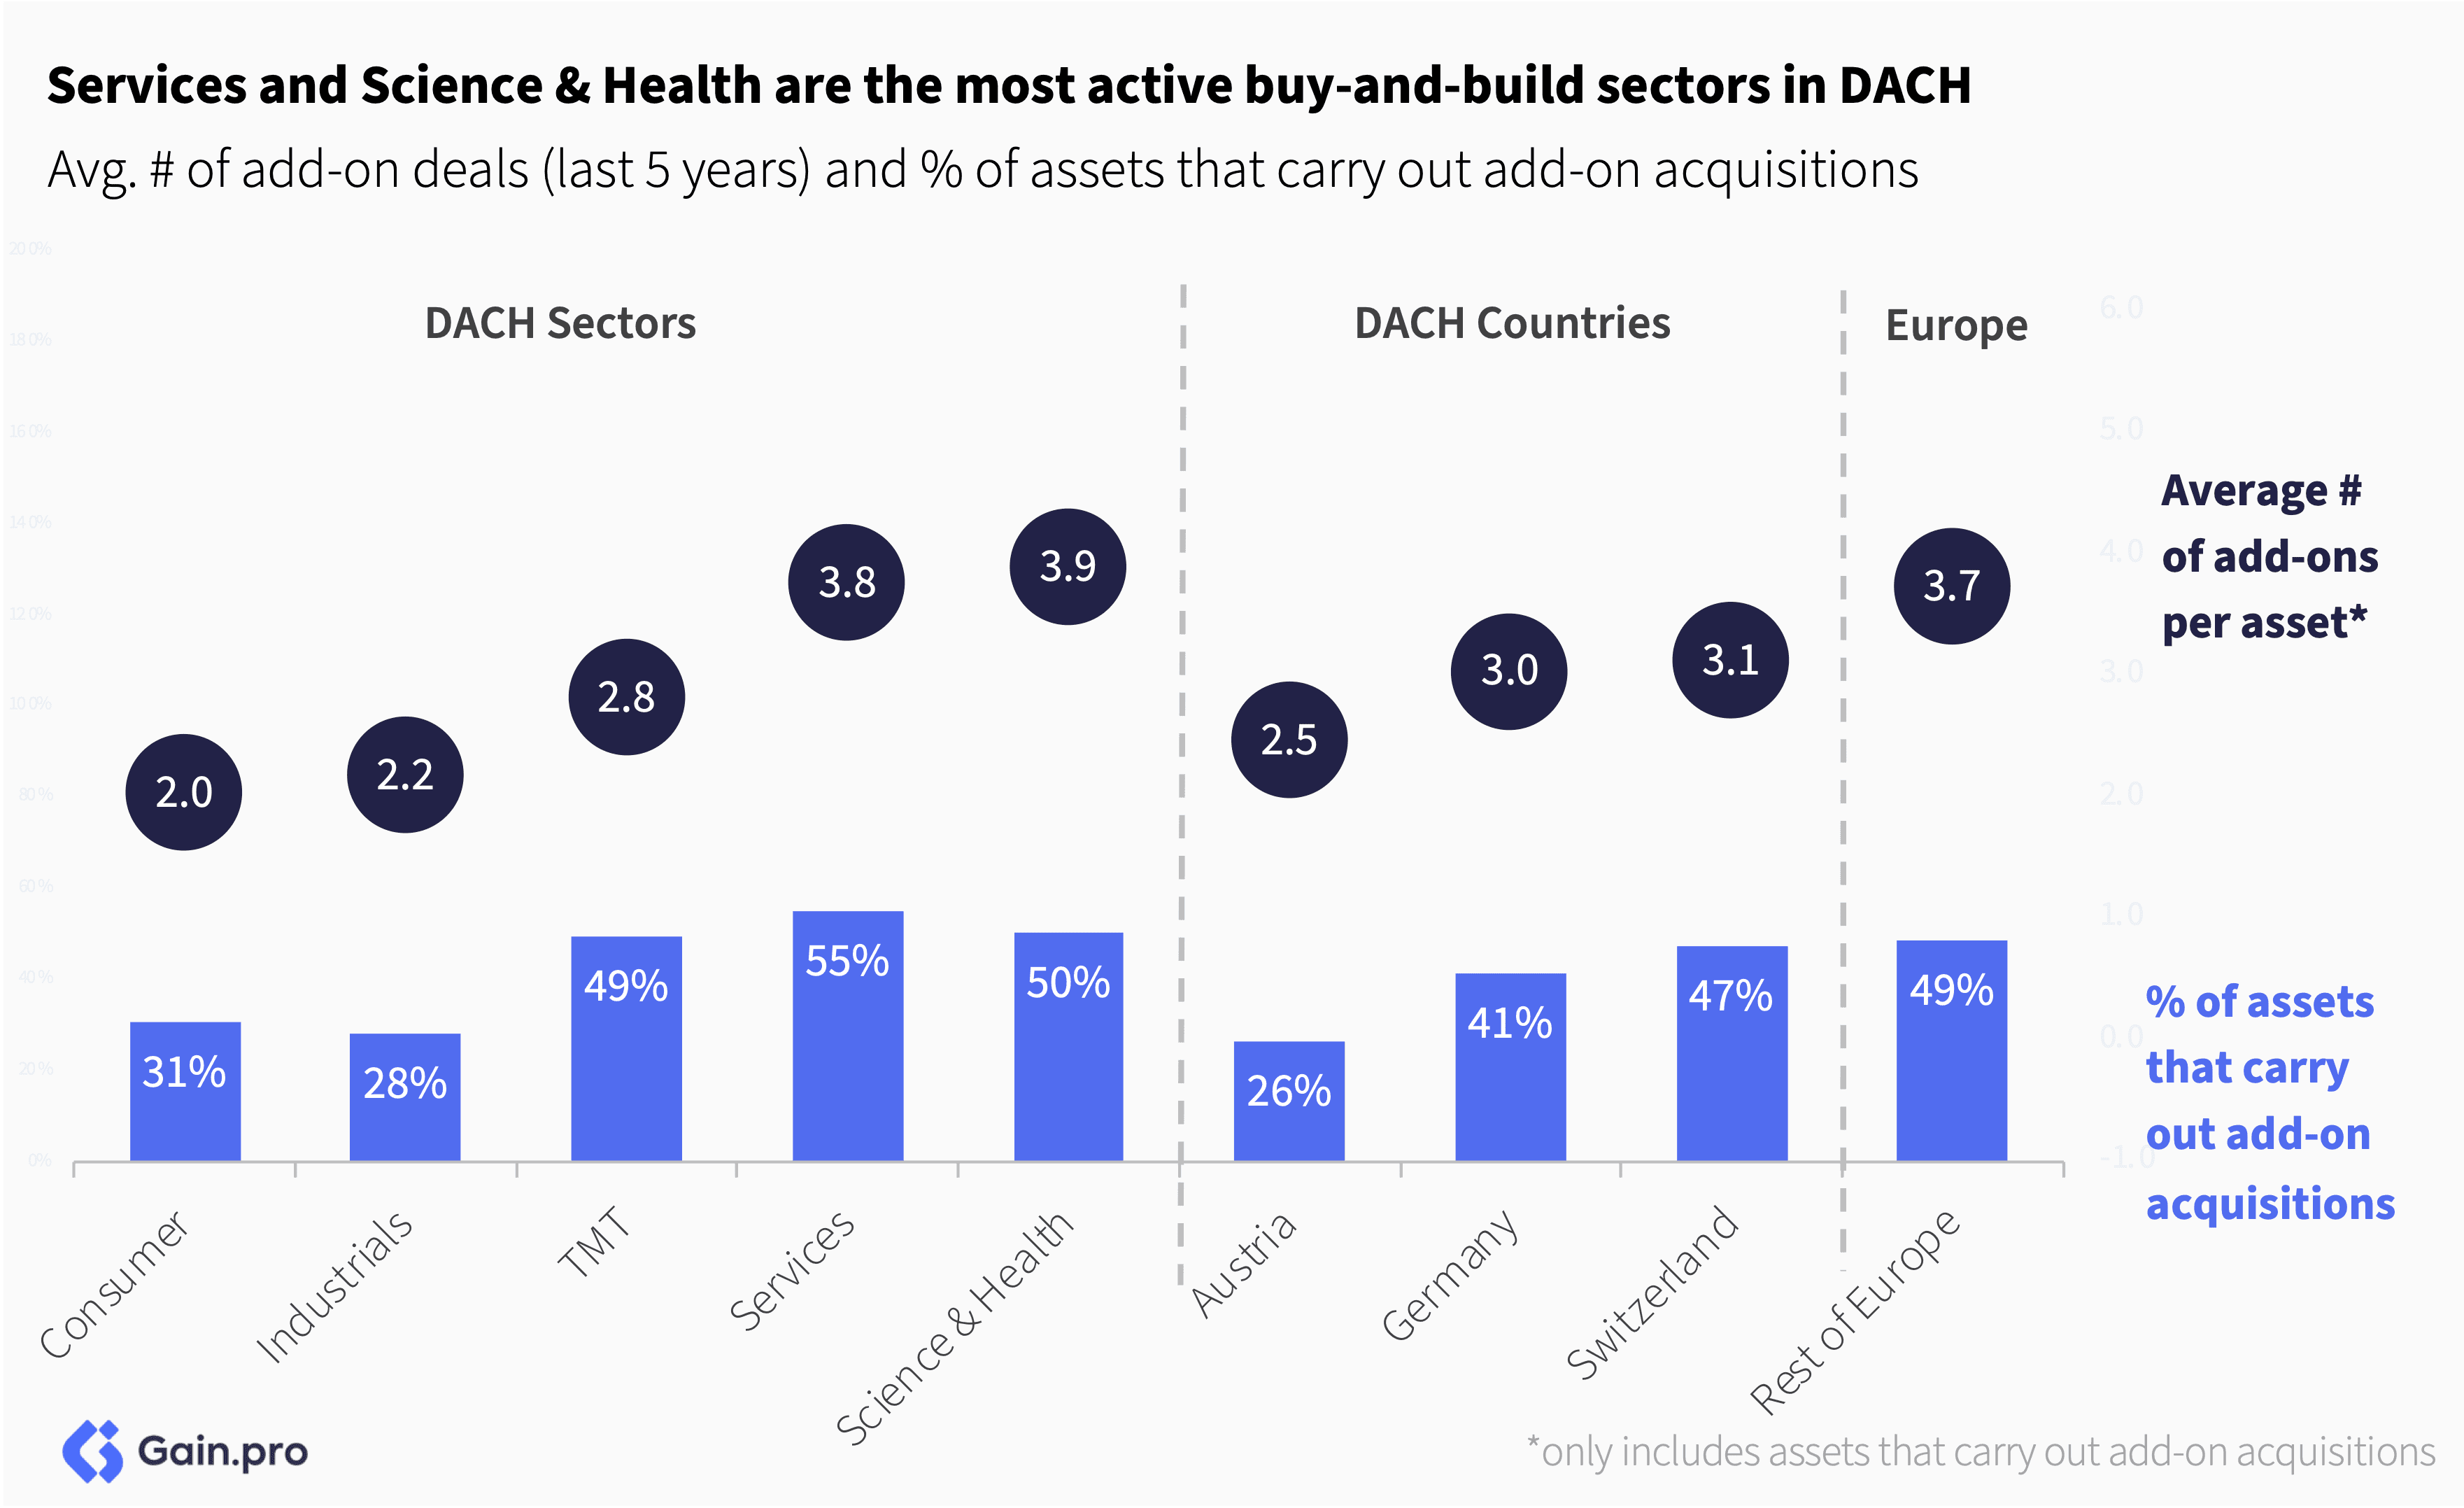
In line with the overall market, add-on activity took a hit but remains above the pre-pandemic highs. By sector, Services accounted for the largest share of add-on deals (30%), followed by TMT (25%) and Science & Health (20%).
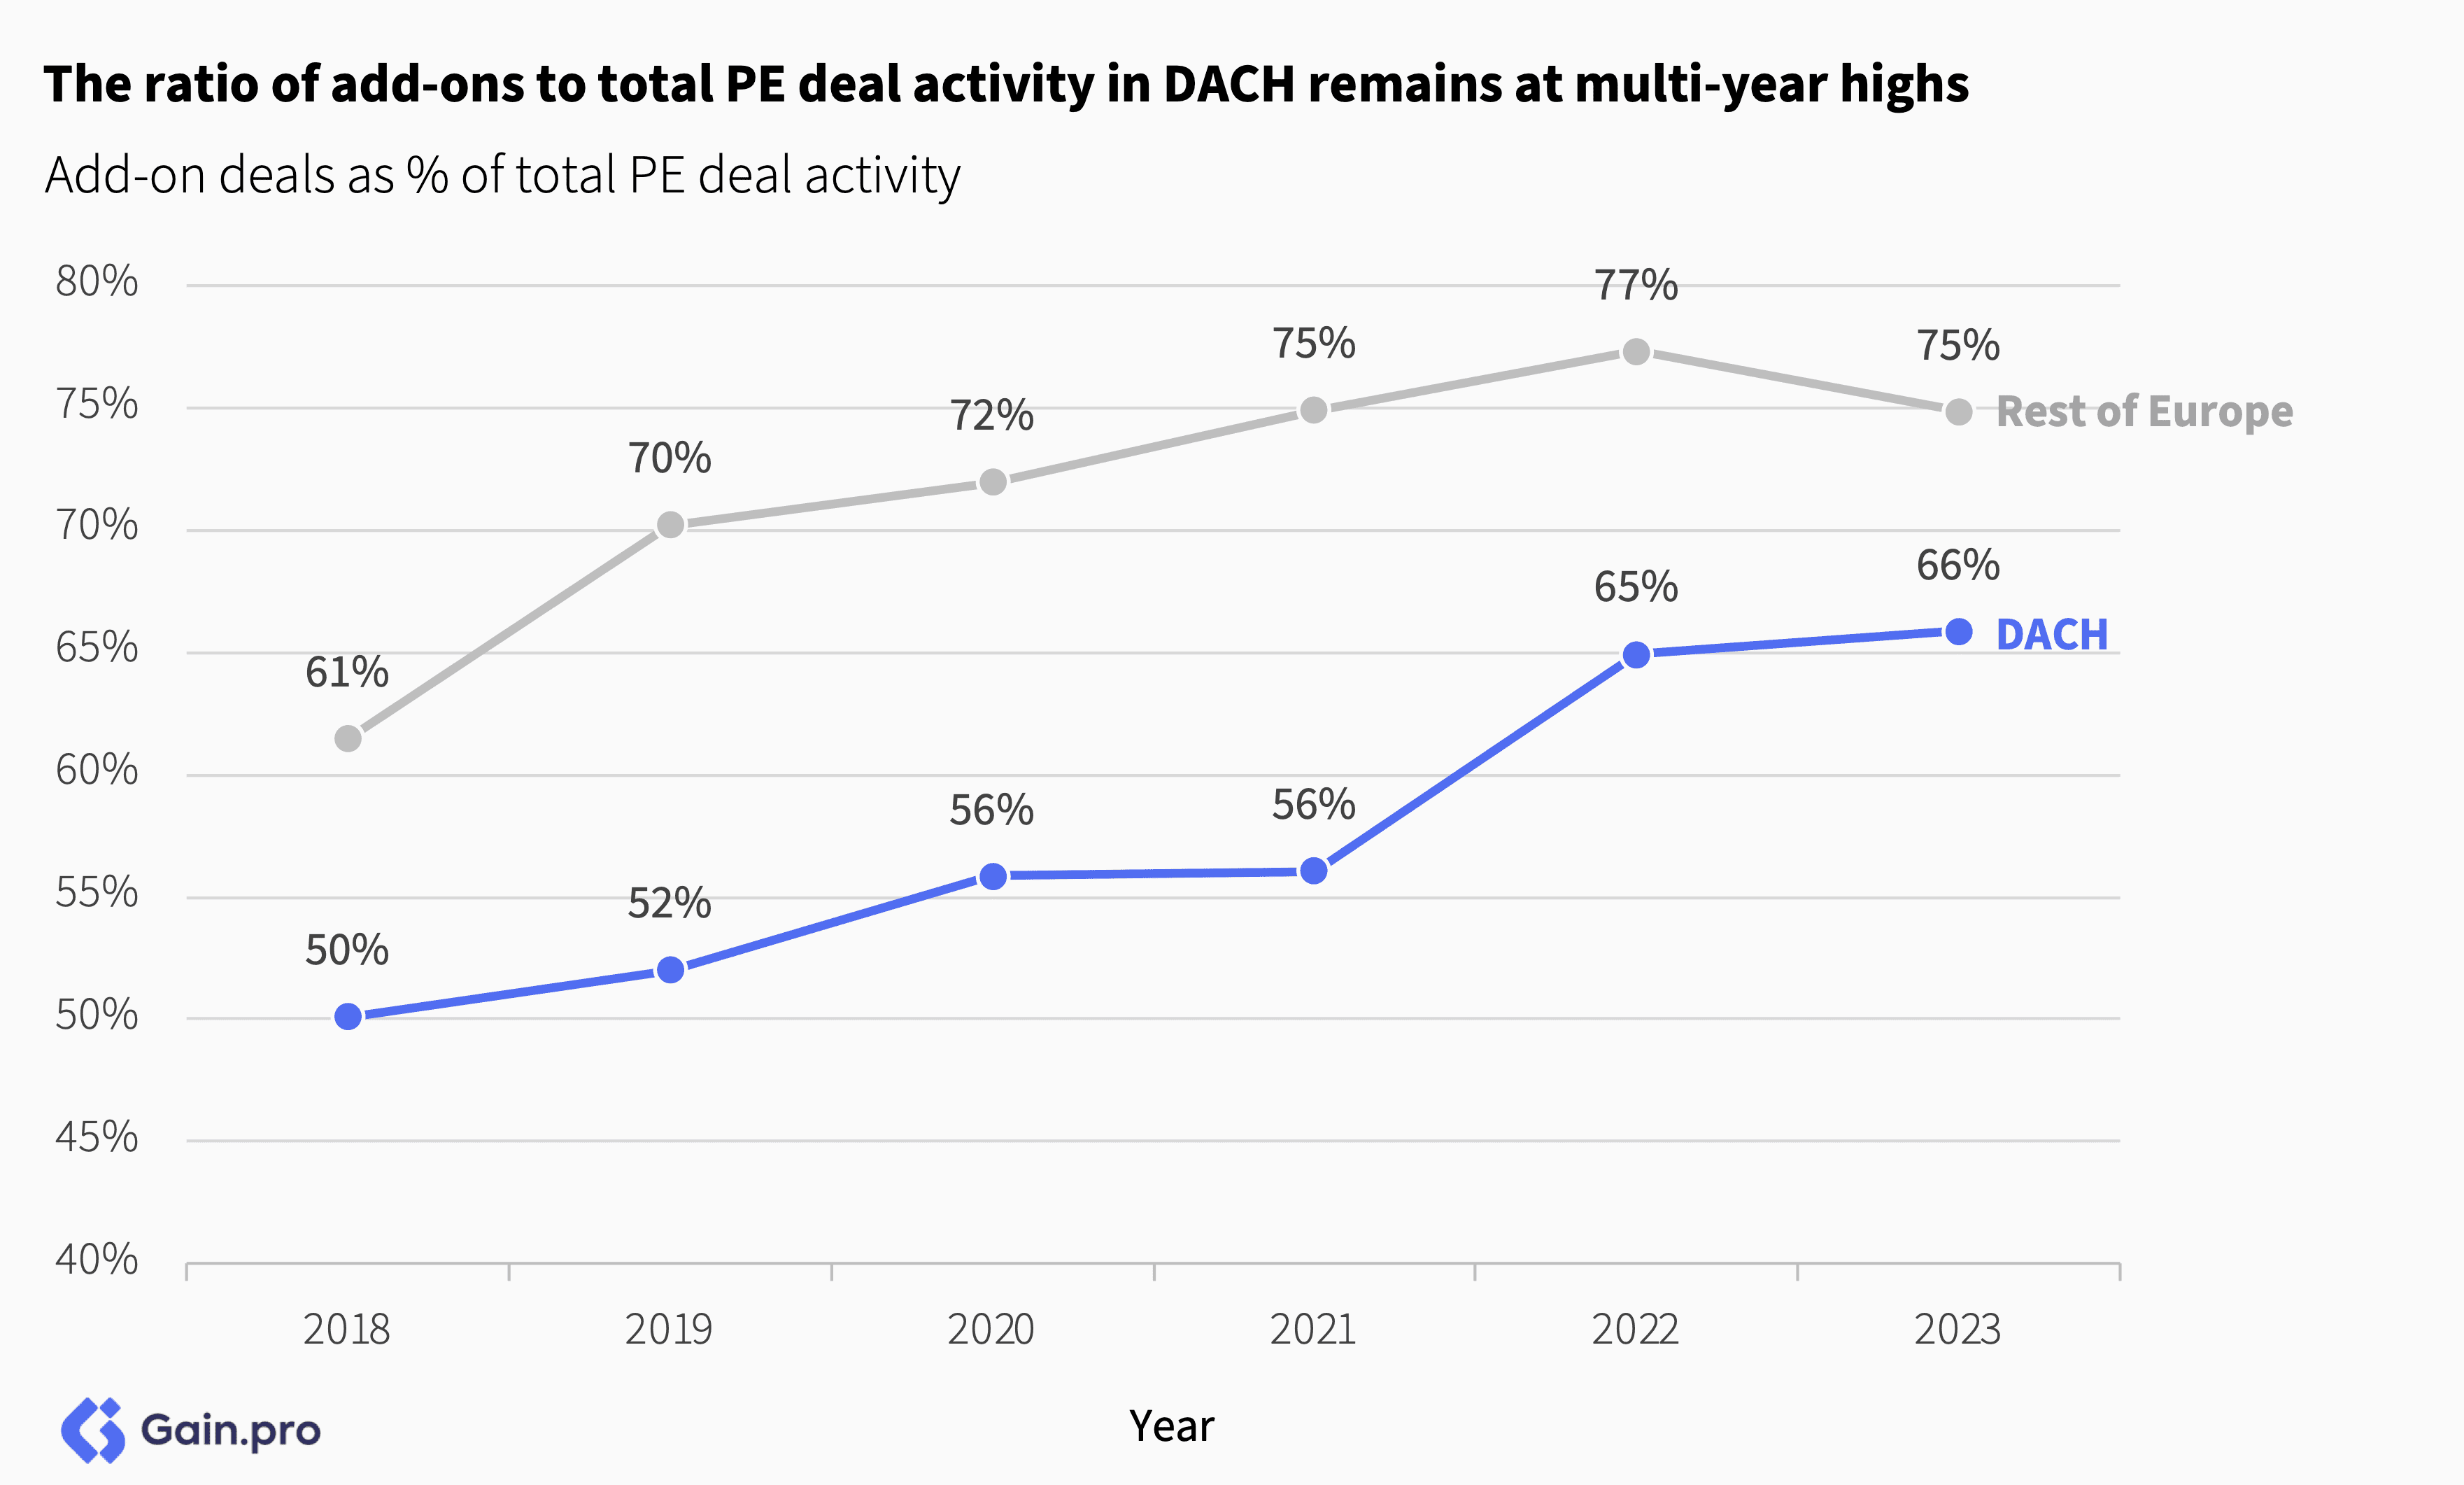
Despite the decline in add-on transaction volumes, 66% of all PE deals in 2023 were add-ons (up from 50% in 2018). Though less common in DACH than in the Rest of Europe, due to sector differences and buy-and-build suitability, add-ons remain an important tool in the PE value creation toolbox.
Services and Science & Health are the most active buy-and-build sectors in DACH. 55% of DACH Services assets made an add-on acquisition in the last 5 years. By country, Switzerland is the most acquisitive (due to its smaller domestic market), followed by Germany and Austria.

Chapter 02: Exits
Overall Exit Activity
Year-to-date, exit activity in the DACH region is following a similar trend to 2022 and 2023. Although the pace of exits has slowed compared to 2021, the market appears to have reached a point of stability.
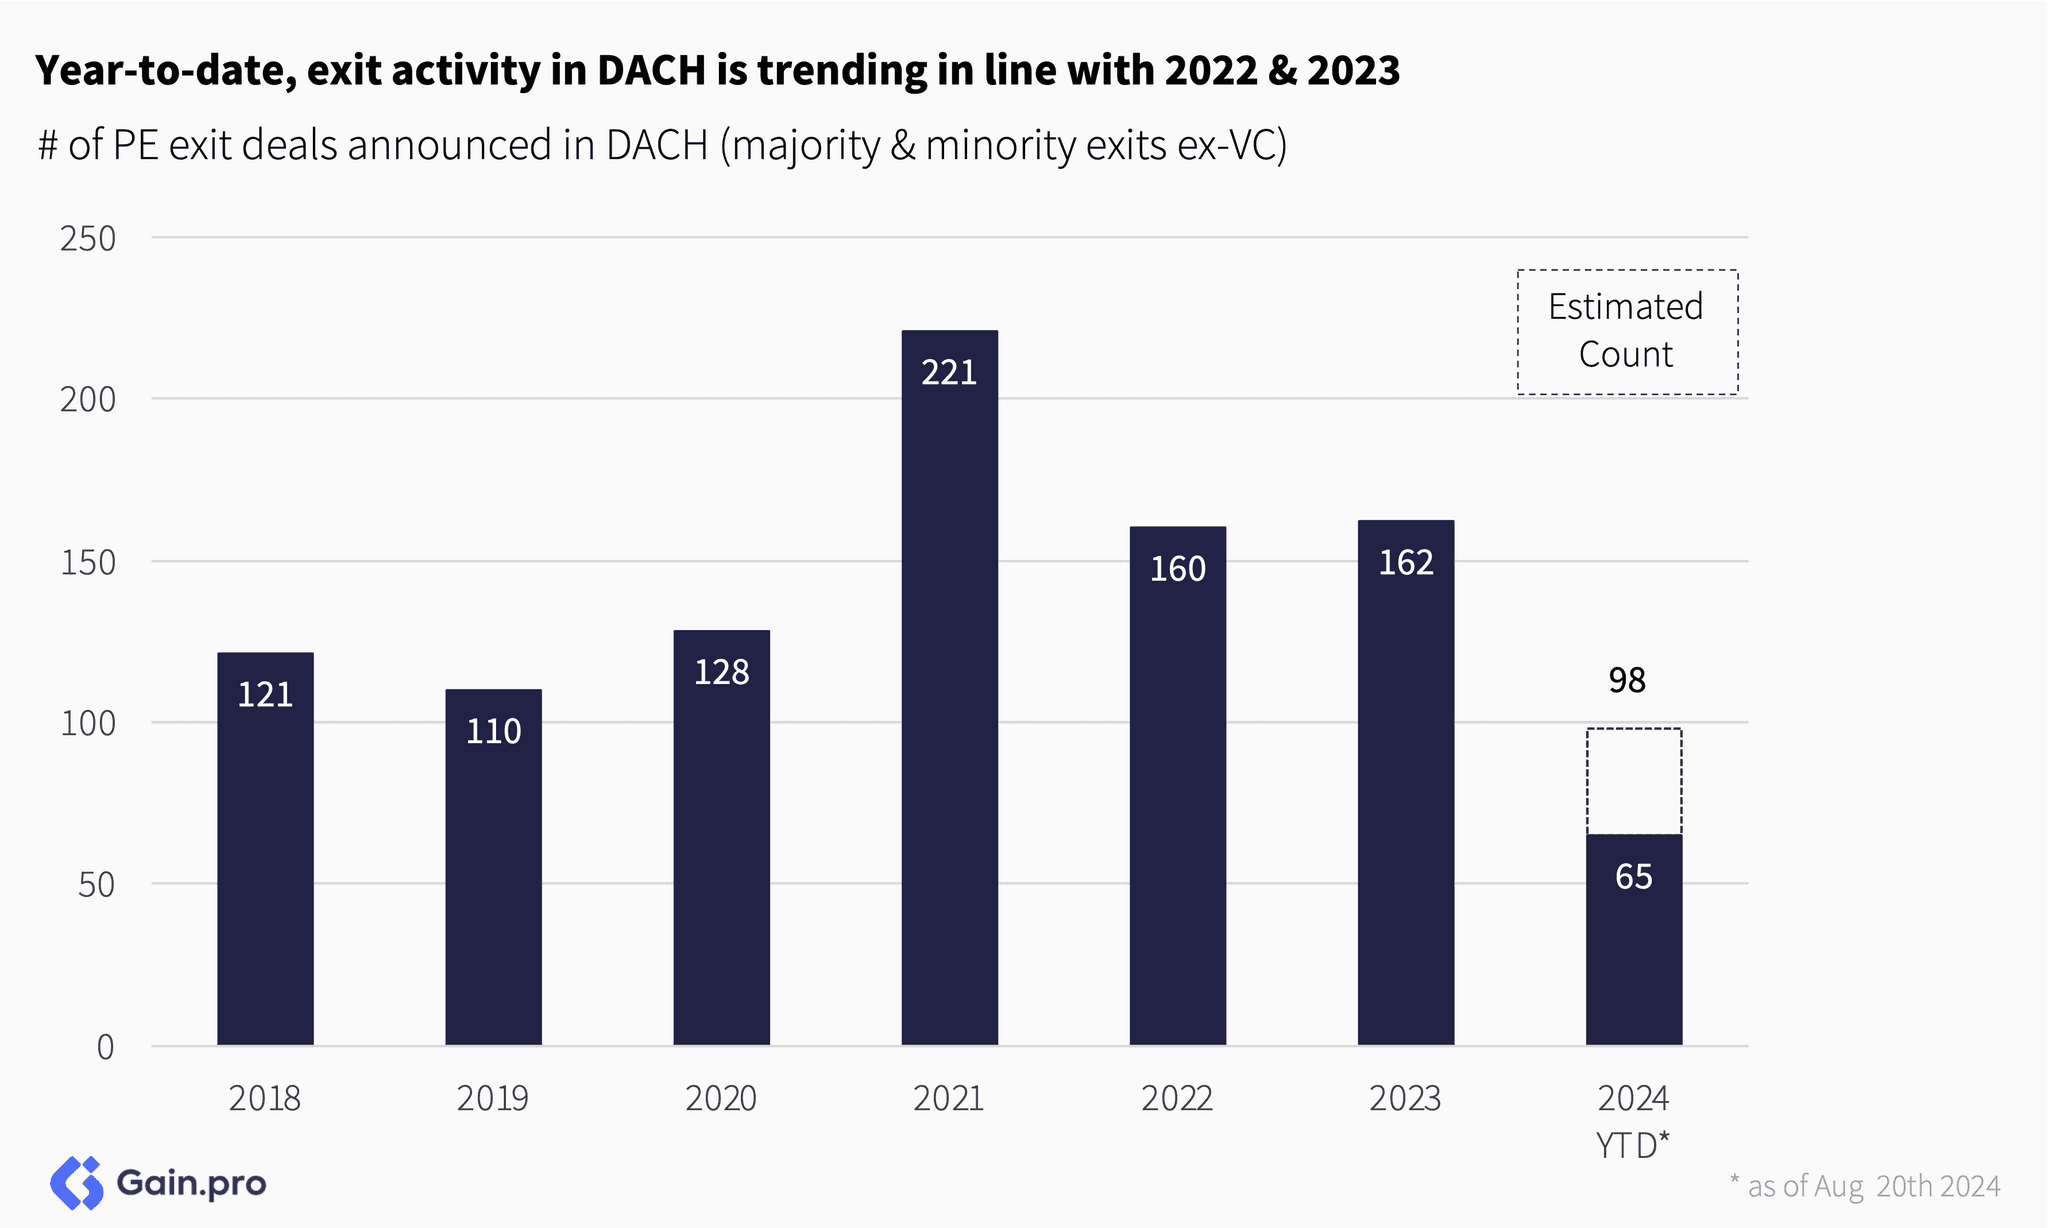
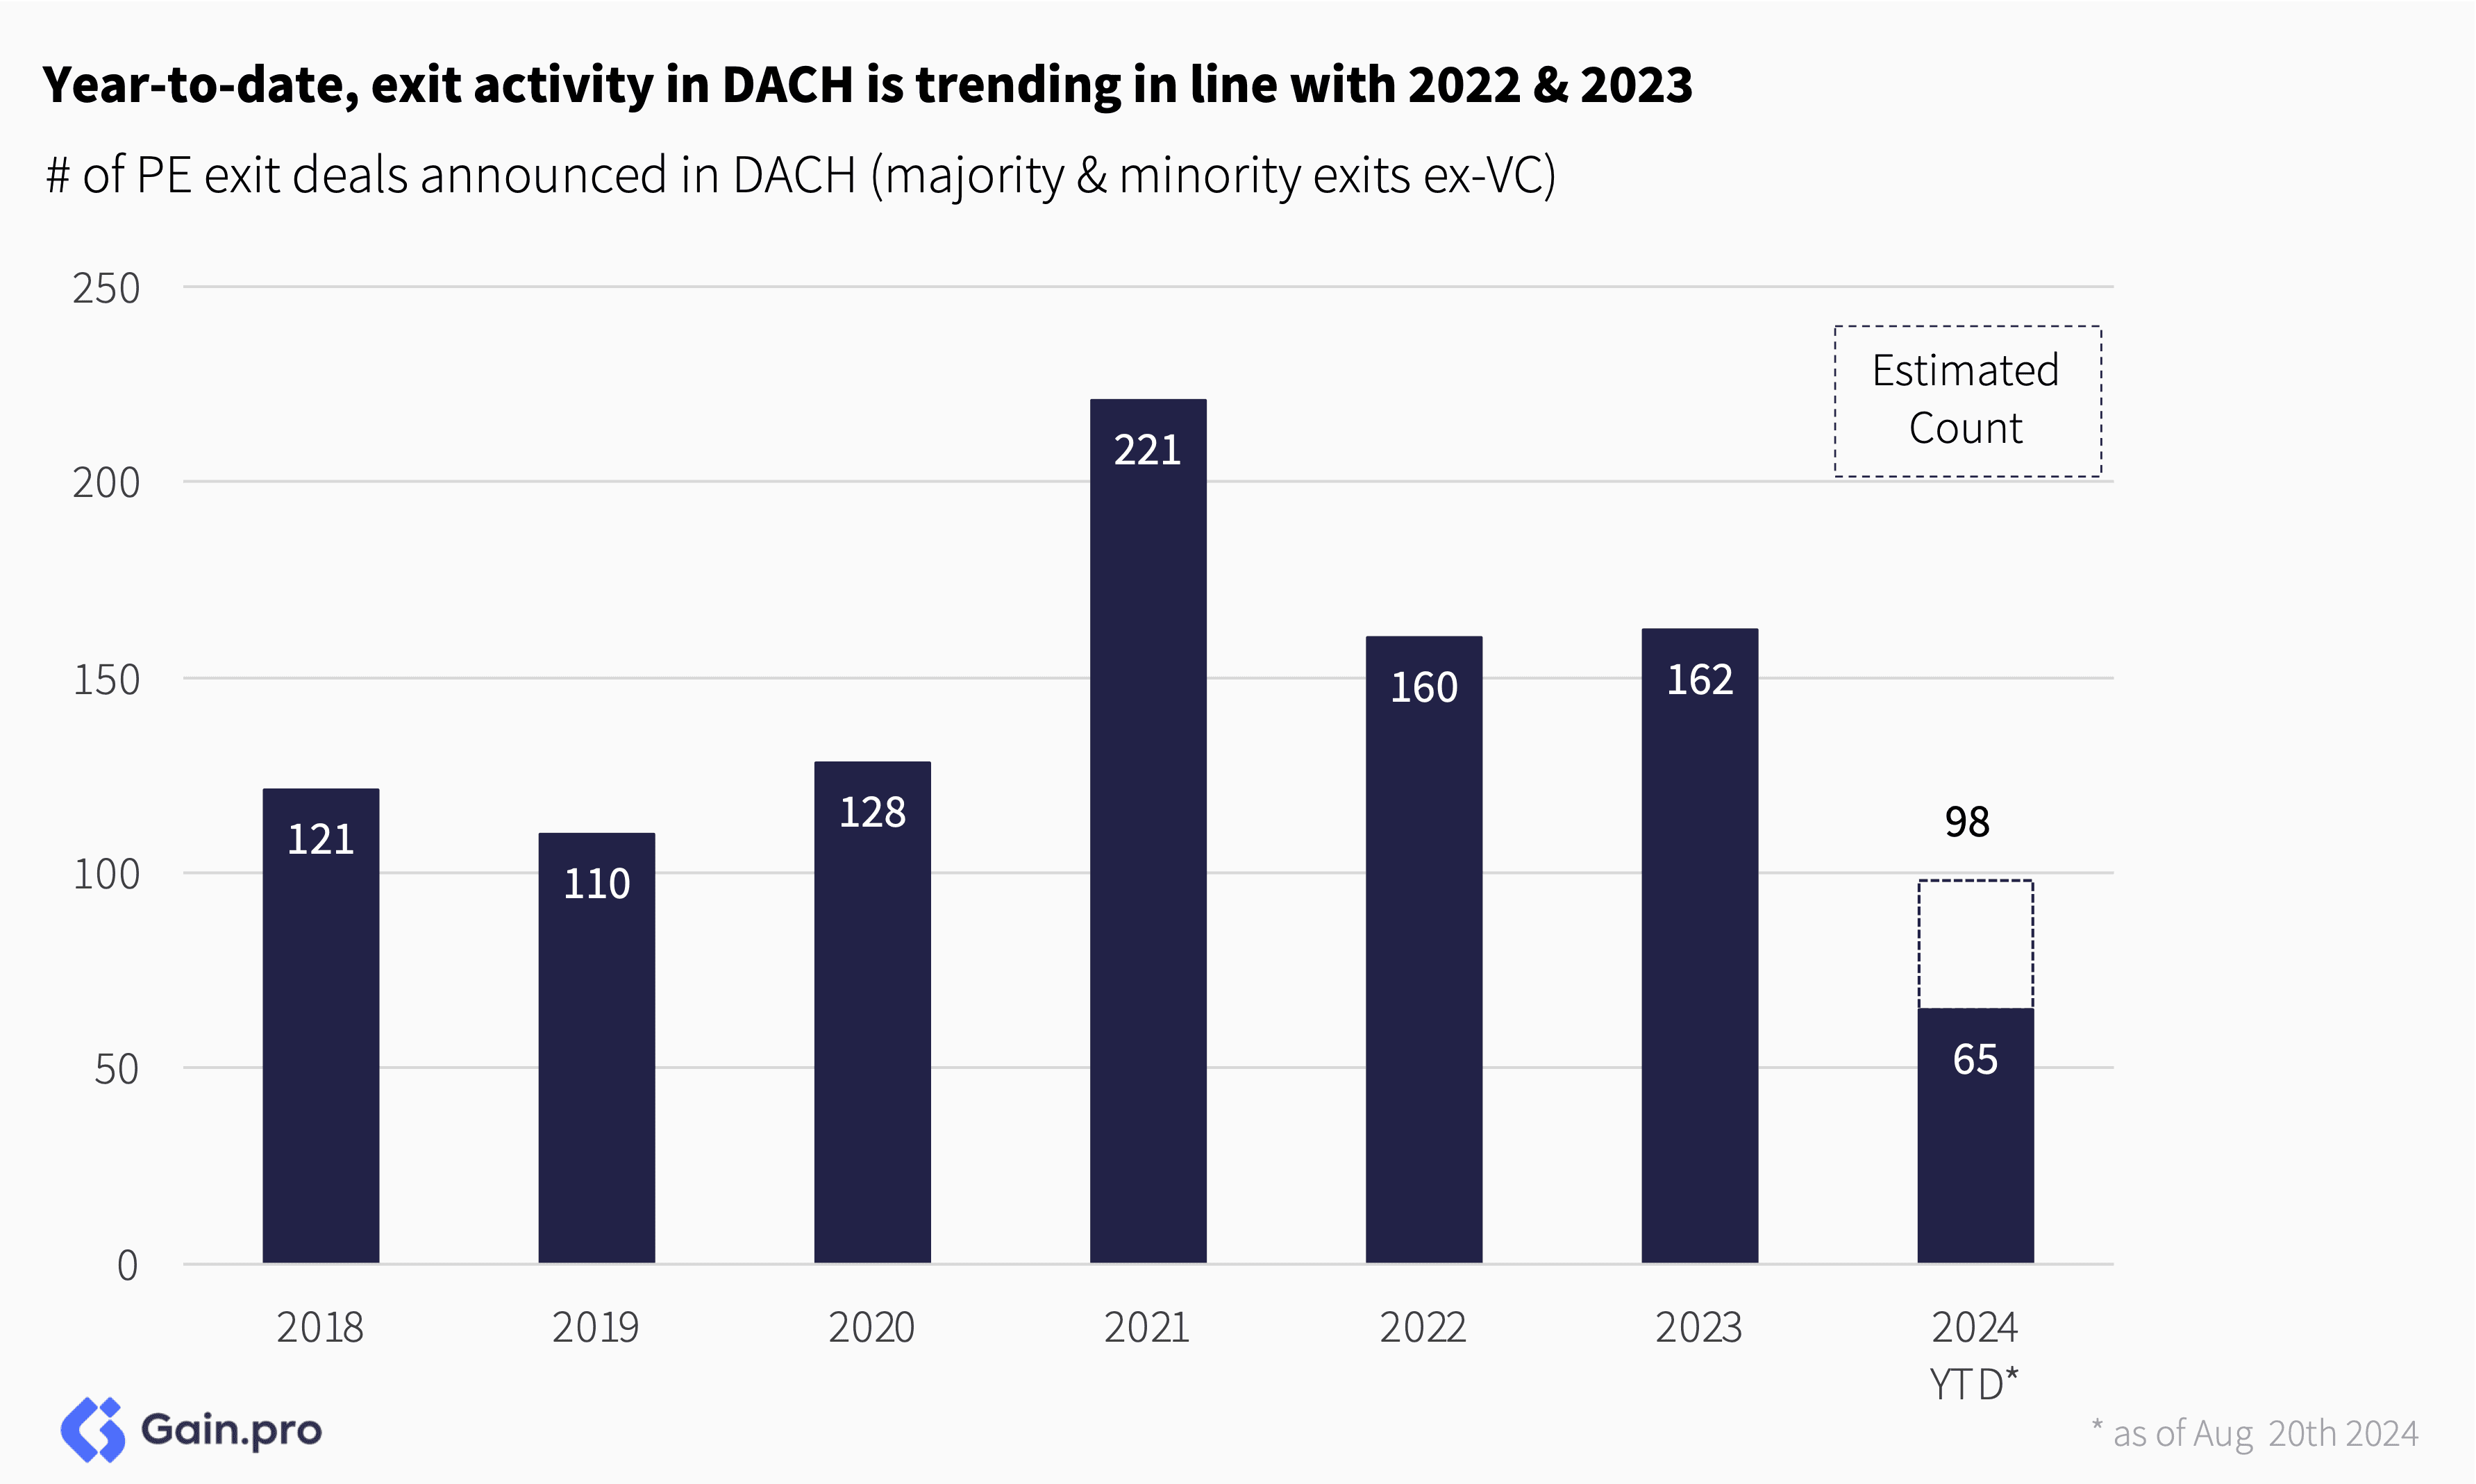
By quarter, DACH exit volumes also seem to have stabilized. Improving overall market conditions, higher availability of credit and increased LP pressure are all contributing to this.


DACH assets also have one of the longest holding periods across Europe. Assets exited in 2023/24 stayed on average in portfolios for 6.0 years (up from 5.2 years only a few years ago). Longer holding periods have a meaningful impact on performance metrics such as IRR and DPI.

Strategic exits accounted for half of all DACH exits last year. Over the last 5-6 years, the share of strategic exits has been increasing, a trend also observed across the Rest of Europe. IPO exits also seem to be coming back after a very subdued 2022.

Sector Trend
By sector, Science & Health saw the steepest decline in exit activity. Exit count declined 73%. Exit activity in Services was robust with deal count rising by 45% in 2 years. Overall, DACH exits trade in line with Europe, down 25% from 2021 levels.

Chapter 03: Largest Investors
Advent International has emerged as the largest investor investing in the DACH region, managing a total estimated EV of €18.2bn in the region, followed by Cinven (managing an EV of €13.3bn) and CVC (€12.7bn).
Other investors in the top 10 include Hellman & Friedman (€12.2bn), KKR (€11.6bn), Triton (€9.6bn), Permira (€9bn), Apollo Global Management (€8.5bn), GIC (€7.5bn) and Carlyle (€7.2bn). Collectively, the top 50 investors in DACH manage an estimated EV of €227bn, with the top 10 alone managing an estimated EV of €110bn (~48% of total).
It is surprising that none of DACH HQ’d investors rank in the top 10. Partners Group HQ’d in Baar, Switzerland ranks 13th (estimated EV in DACH of €5.9bn), Deutsche Beteiligungs ranks 16th (HQ — Frankfurt, EV — €4.4bn) and Allianz Capital Partners ranks 21st on the list (HQ — Munich, EV — €3.8bn).
Non-DACH European and North American investors dominate the largest 50 investors in DACH ranking, with sponsors HQ’d in those regions managing an EV of €88bn (39% share) and €85bn (37%), respectively. DACH-based investors are underrepresented even in their own region despite it being the foremost economy in Europe, managing an EV of €38bn (17%).

Investments for DACH sponsors are often geared towards smaller-sized firms (<€50m EBITDA). 71% of DACH PE assets with EBITDA <€10m are owned by DACH sponsors. In contrast, only 11% of DACH PE assets with EBITDA >€200m are owned by DACH sponsors.

Partners Group has emerged as the leading DACH HQ’d investor, managing a total estimated EV of €23.2bn across Europe. Closely following it is Allianz Capital Partners (managing an EV of €16.9bn) and DWS Group (€7.1bn).
Other investors in the top 10 include Deutsche Beteiligungs AG (€5.4bn), Bregal Unternehmerkapital (€3.1bn), AUCTUS Capital Partners (€2.6bn), Aurelius (€2.5bn), Capvis (€2.3bn), Deutsche Private Equity (€2.2bn) and Invest AG (€2.0bn).
Collectively, the largest 50 DACH HQ’d investors manage an estimated EV of €97bn in Europe. On average, they have a portfolio EBITDA of €31m and manage 17 companies each.
Over the last 6 years, the largest DACH HQ’d investors have bought 2.5x more assets than they have sold. Specifically, there have been 762 new investments and 285 exits among these sponsors.
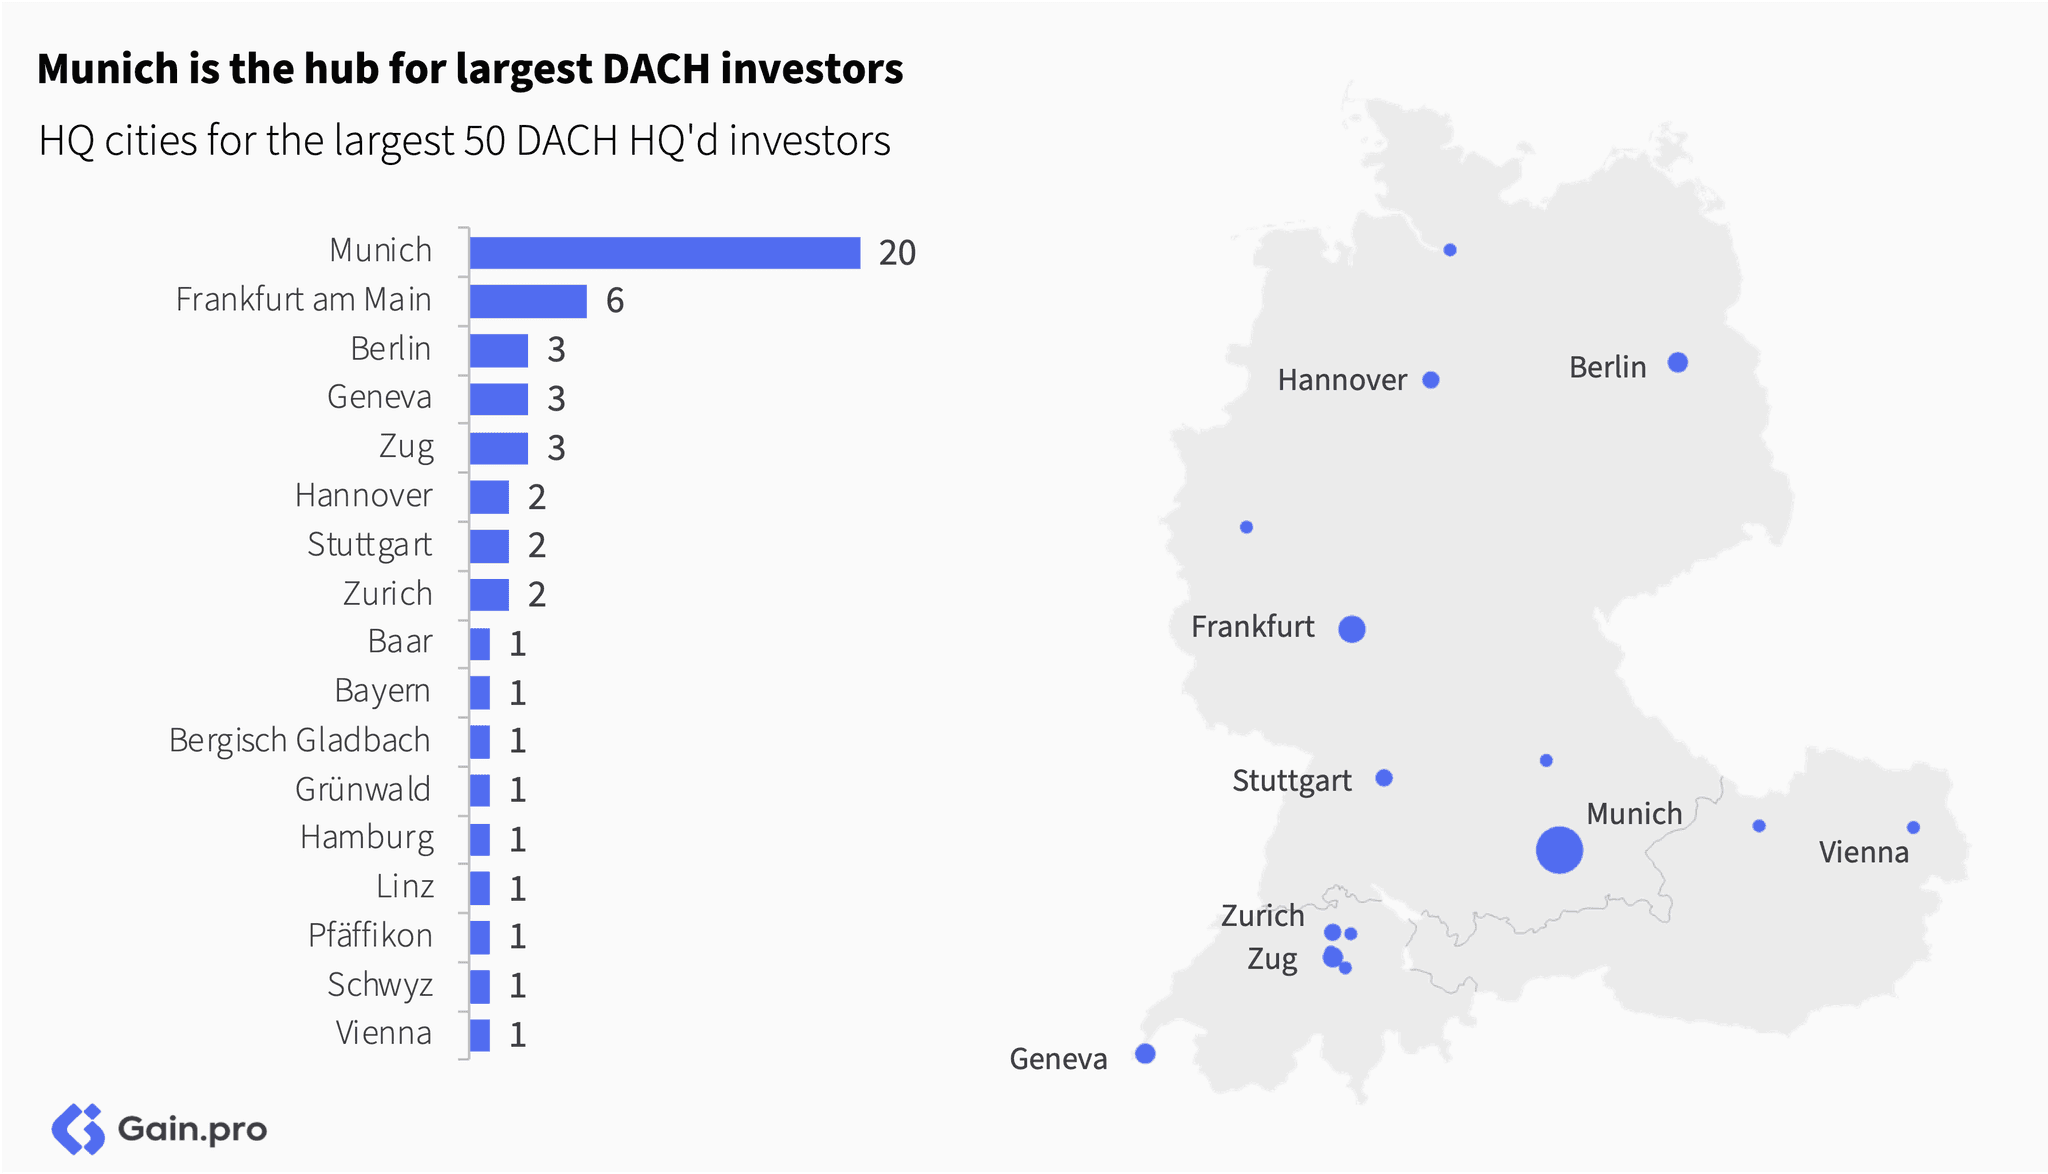
By city, Munich is the largest hub for the leading DACH investors, followed by Frankfurt am Main and Berlin. These 3 metropolises constitute ~60% of all HQs and are followed by the long tail of other medium-to-large DACH cities.
The largest DACH HQ’d investors rarely invest outside of the DACH borders. Nearly half of the 30 largest DACH HQ’d investors have 90% or more of their portfolio within the DACH region. It is only a select few such as Partners Group (#1), Allianz Capital Partners (#2), DWS Group (#3), Swiss Life Asset Management (#11), AGIC Capital (#15), Mutares (#20) and Unigestion (#27) that have geographically diversified portfolios.
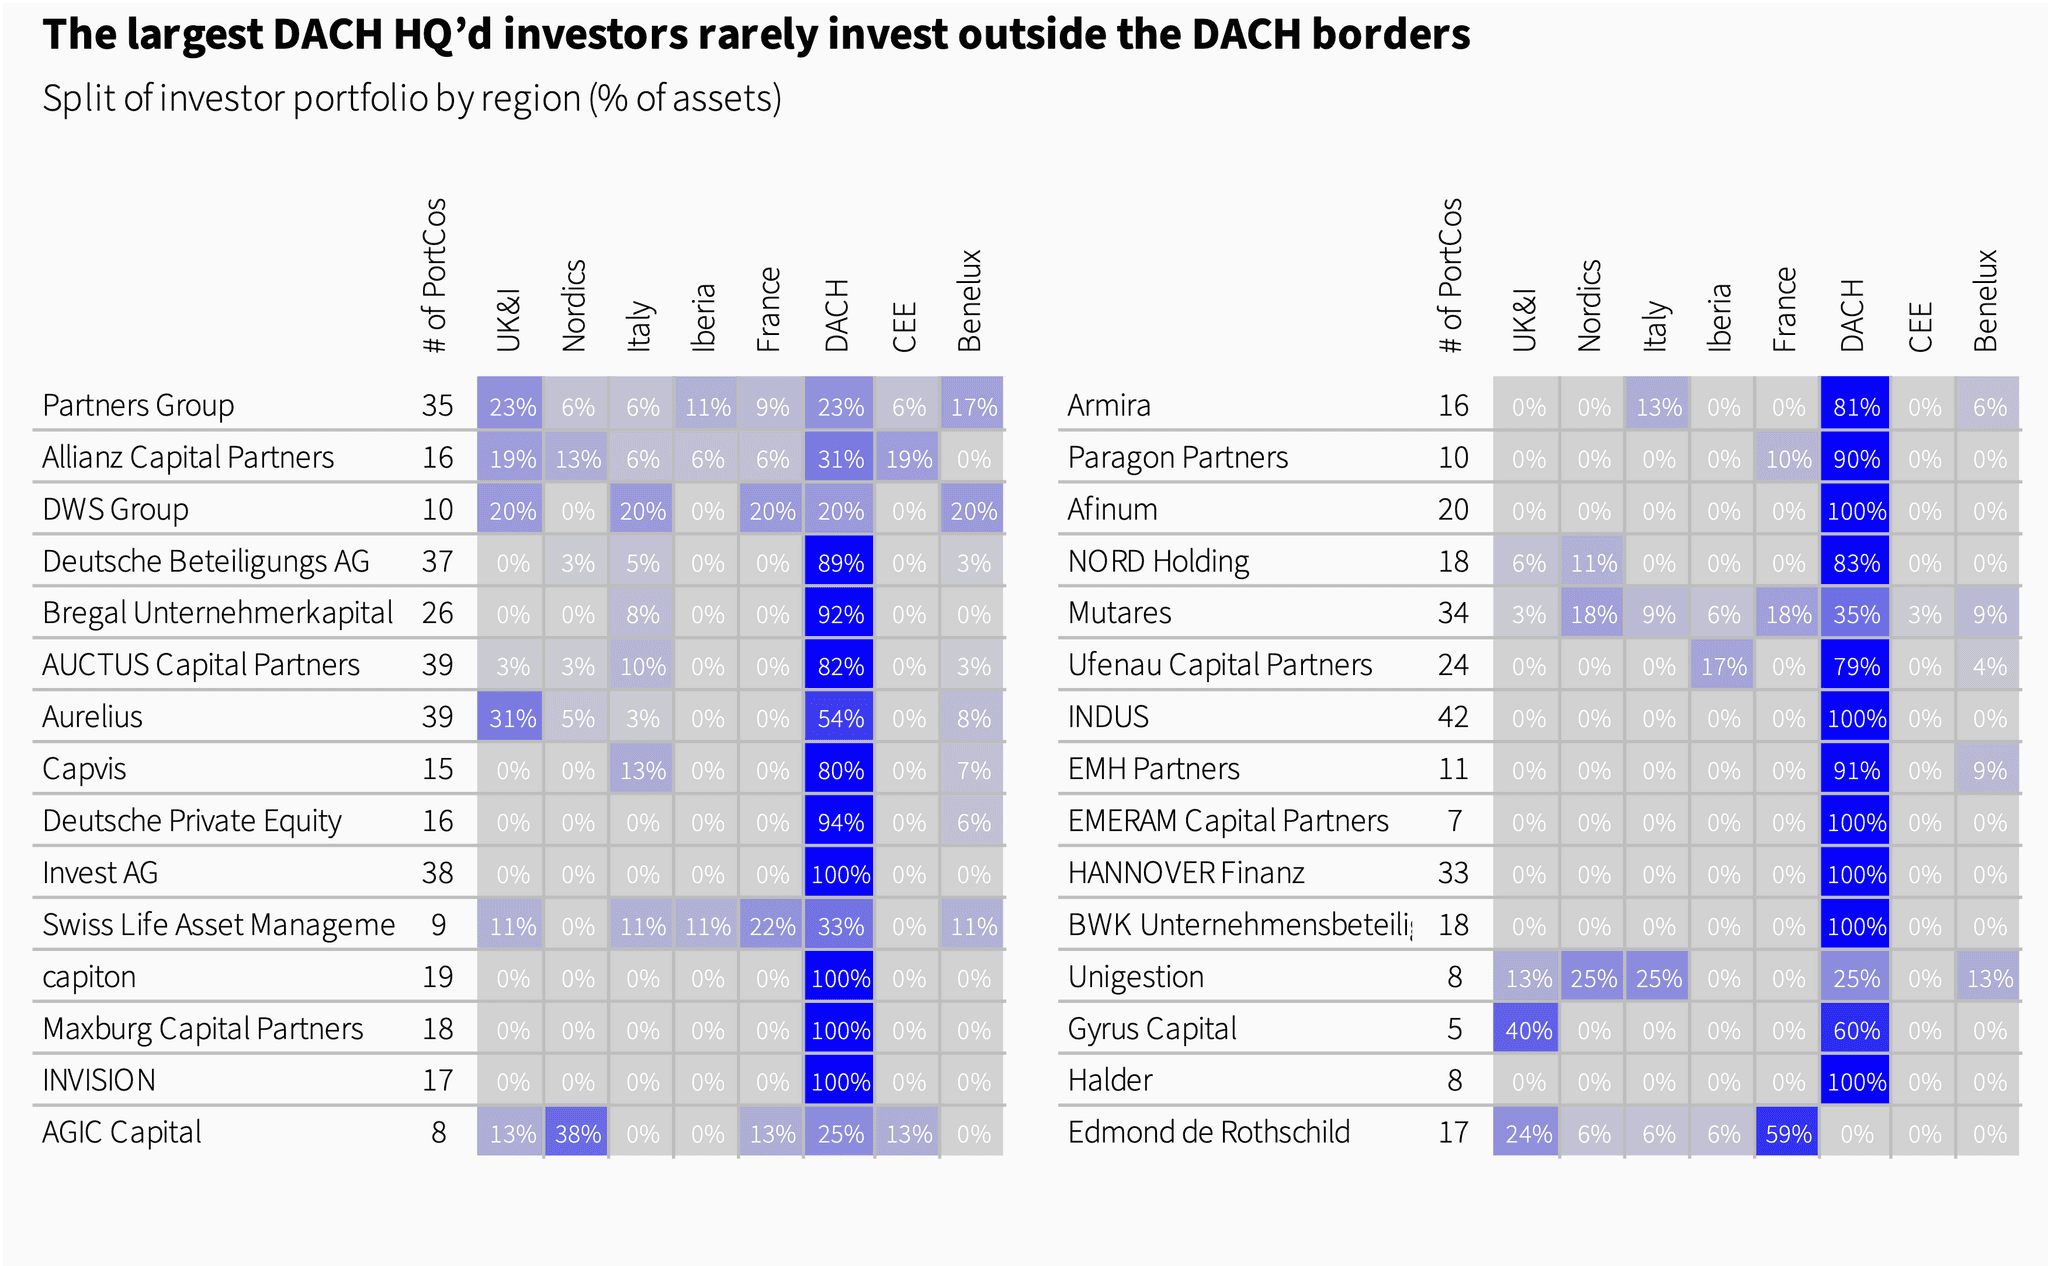
By sector, the portfolio of the largest DACH investors is quite diversified. On average, the largest investors allocate 27% of their portfolio to Industrials, followed by 21% to Services and 16% to Consumer.

EMERAM Capital Partners, Unigestion, Amira, Deutsche Private Equity and NORD Holdings are investors with the fastest-growing portfolios. The leading position of EMERAM Capital Partners can be explained by the investor’s focus on high-growth Services and Renewable Energy sectors. On the other hand, Deutsche Private Equity supports its PortCo’s growth with a strong buy-and-build strategy.

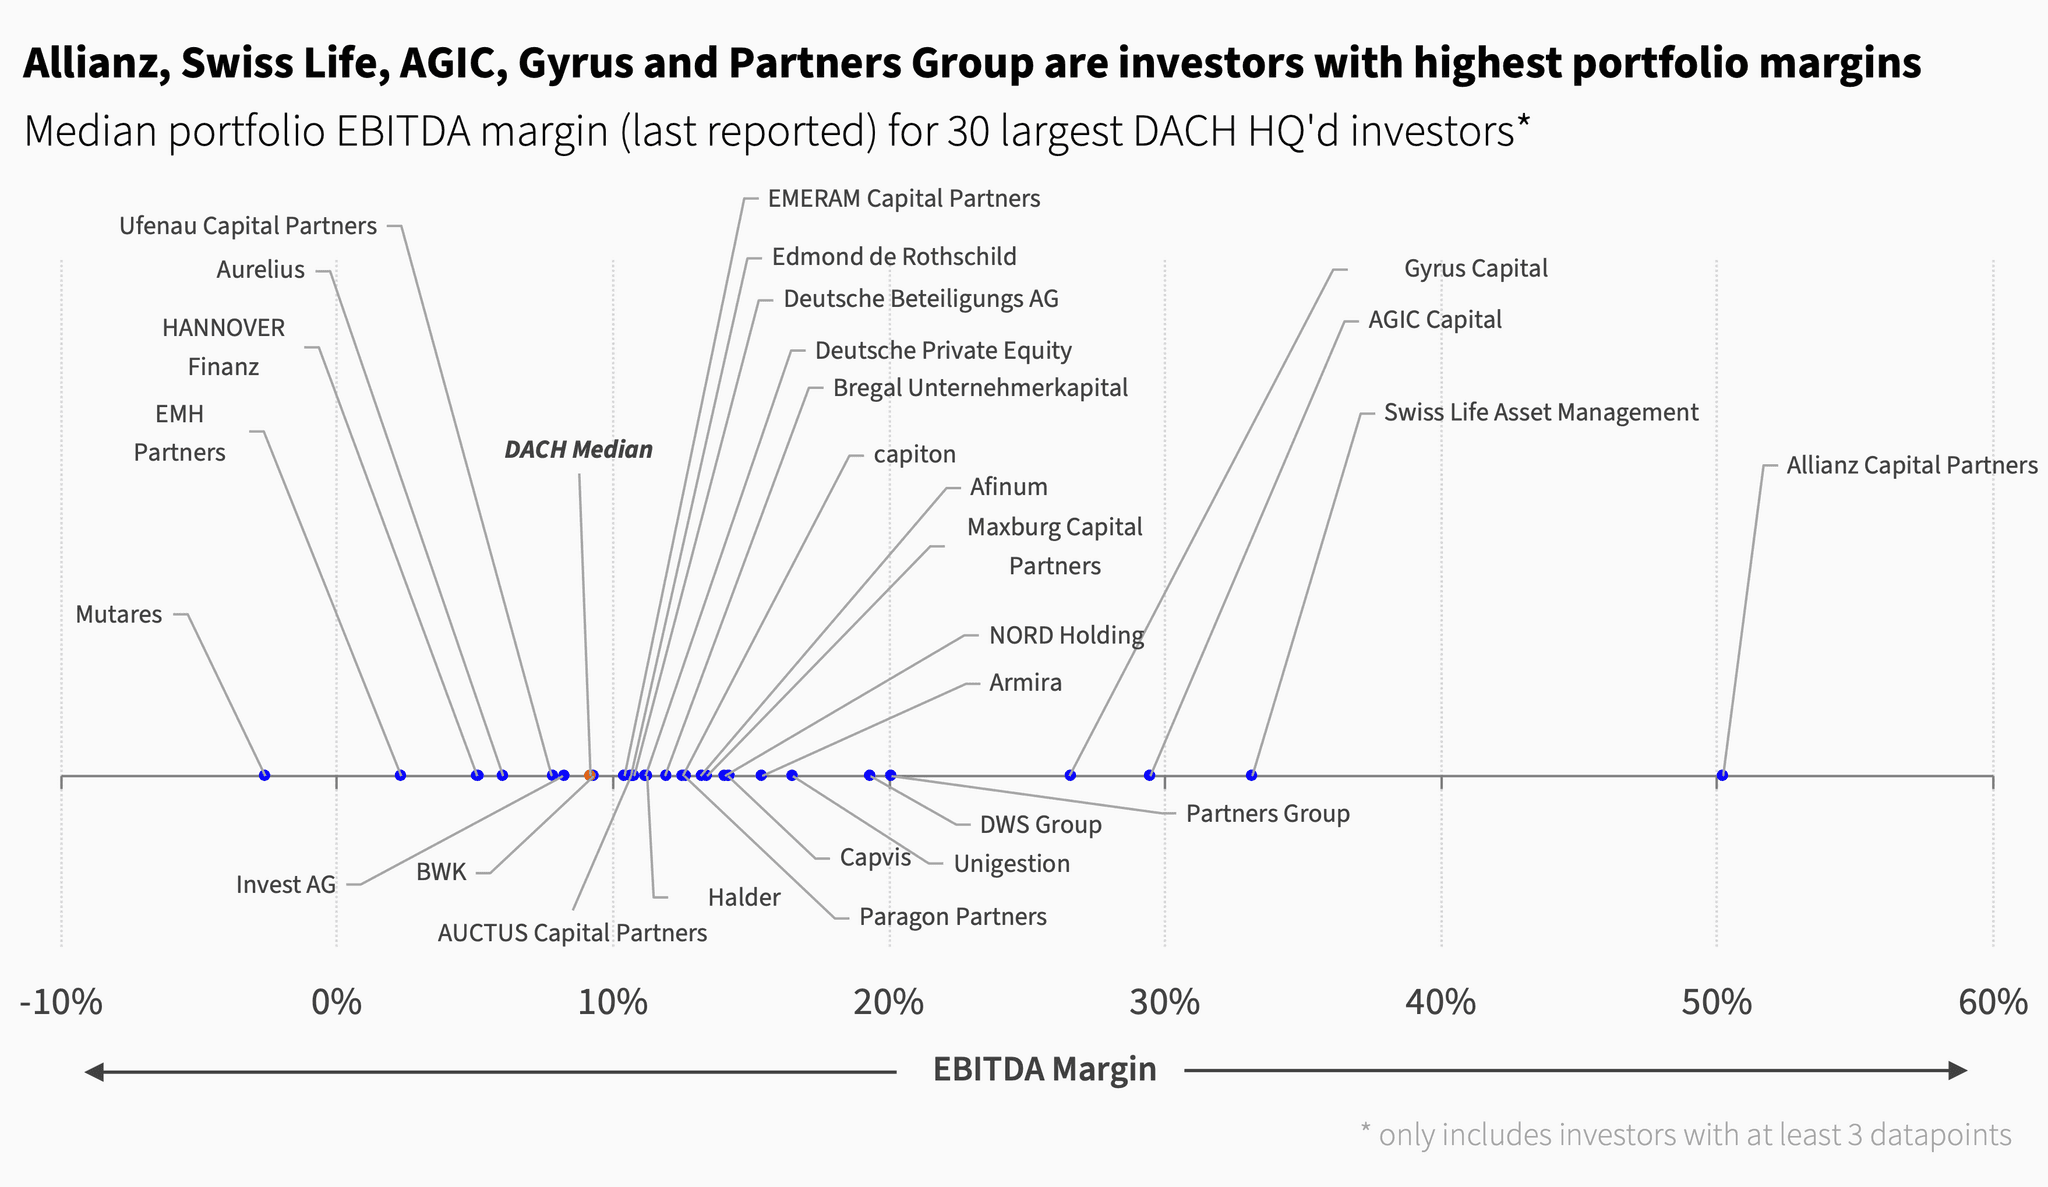
Allianz Capital Partners, Swiss Life Asset Management, AGIC Capital, Gyrus Capital and Partners Group are among the investors with the highest median portfolio EBITDA margin. On the other side of the spectrum, we have Mutares which is a turnaround specialist acquiring unprofitable businesses in Consumer, Industrials and Services sectors.
Ufenau Capital Partners, Partners Group, Deutsche Private Equity and Bregal Unternehmerkapital are among the investors with the highest buy-and-build activity in their portfolio. Ufenau Capital Partners has strong consolidators in its portfolio such as a veterinary services provider Altano Group. On the other side of the spectrum, we have Industrials heavy INDUS with nearly no assets doing M&A.

Chapter 04: PE Portfolio Insights
It is no surprise that the Industrials sector makes up the largest share of DACH PE portfolio (29% of assets), given its importance to the German economy. Compared to the Rest of Europe, DACH PE assets are also underweight Services (-6pp) and Consumer (-3pp) and overweight Industrials (+12pp).

PE penetration in DACH is highest in MedTech, Software and Infrastructure. While MedTech boasts one of the highest growth rates, Software is a high-margin subsector, Infrastructure assets typically generate predictable, long-term cash flows making them suitable for PE-backing.

Regional Stats
DACH PE assets are predominantly based in 3 Western German regions: Bayern, Nordrhein-Westfalen and Baden-Württemberg. These 3 regions account for nearly half of all PE-owned companies located in DACH. Austria, Switzerland and East Germany are much less penetrated with the activities mainly confined to the large cities acting as separate regions (Berlin, Wien, Zurich).

By city, the largest hubs for DACH PE assets are Berlin, Munich, Hamburg and Zurich. Despite there being large hubs in Germany, assets are spread out widely across the country. In contrast, PE assets in Austria and Switzerland are more concentrated in large cities.

Almost all PE regions in Germany are dominated by Industrials assets, with Berlin and Hamburg being exceptions, which are more focused on TMT. On the other hand, Austrian and Swiss regions predominantly have more Services and TMT sectors.
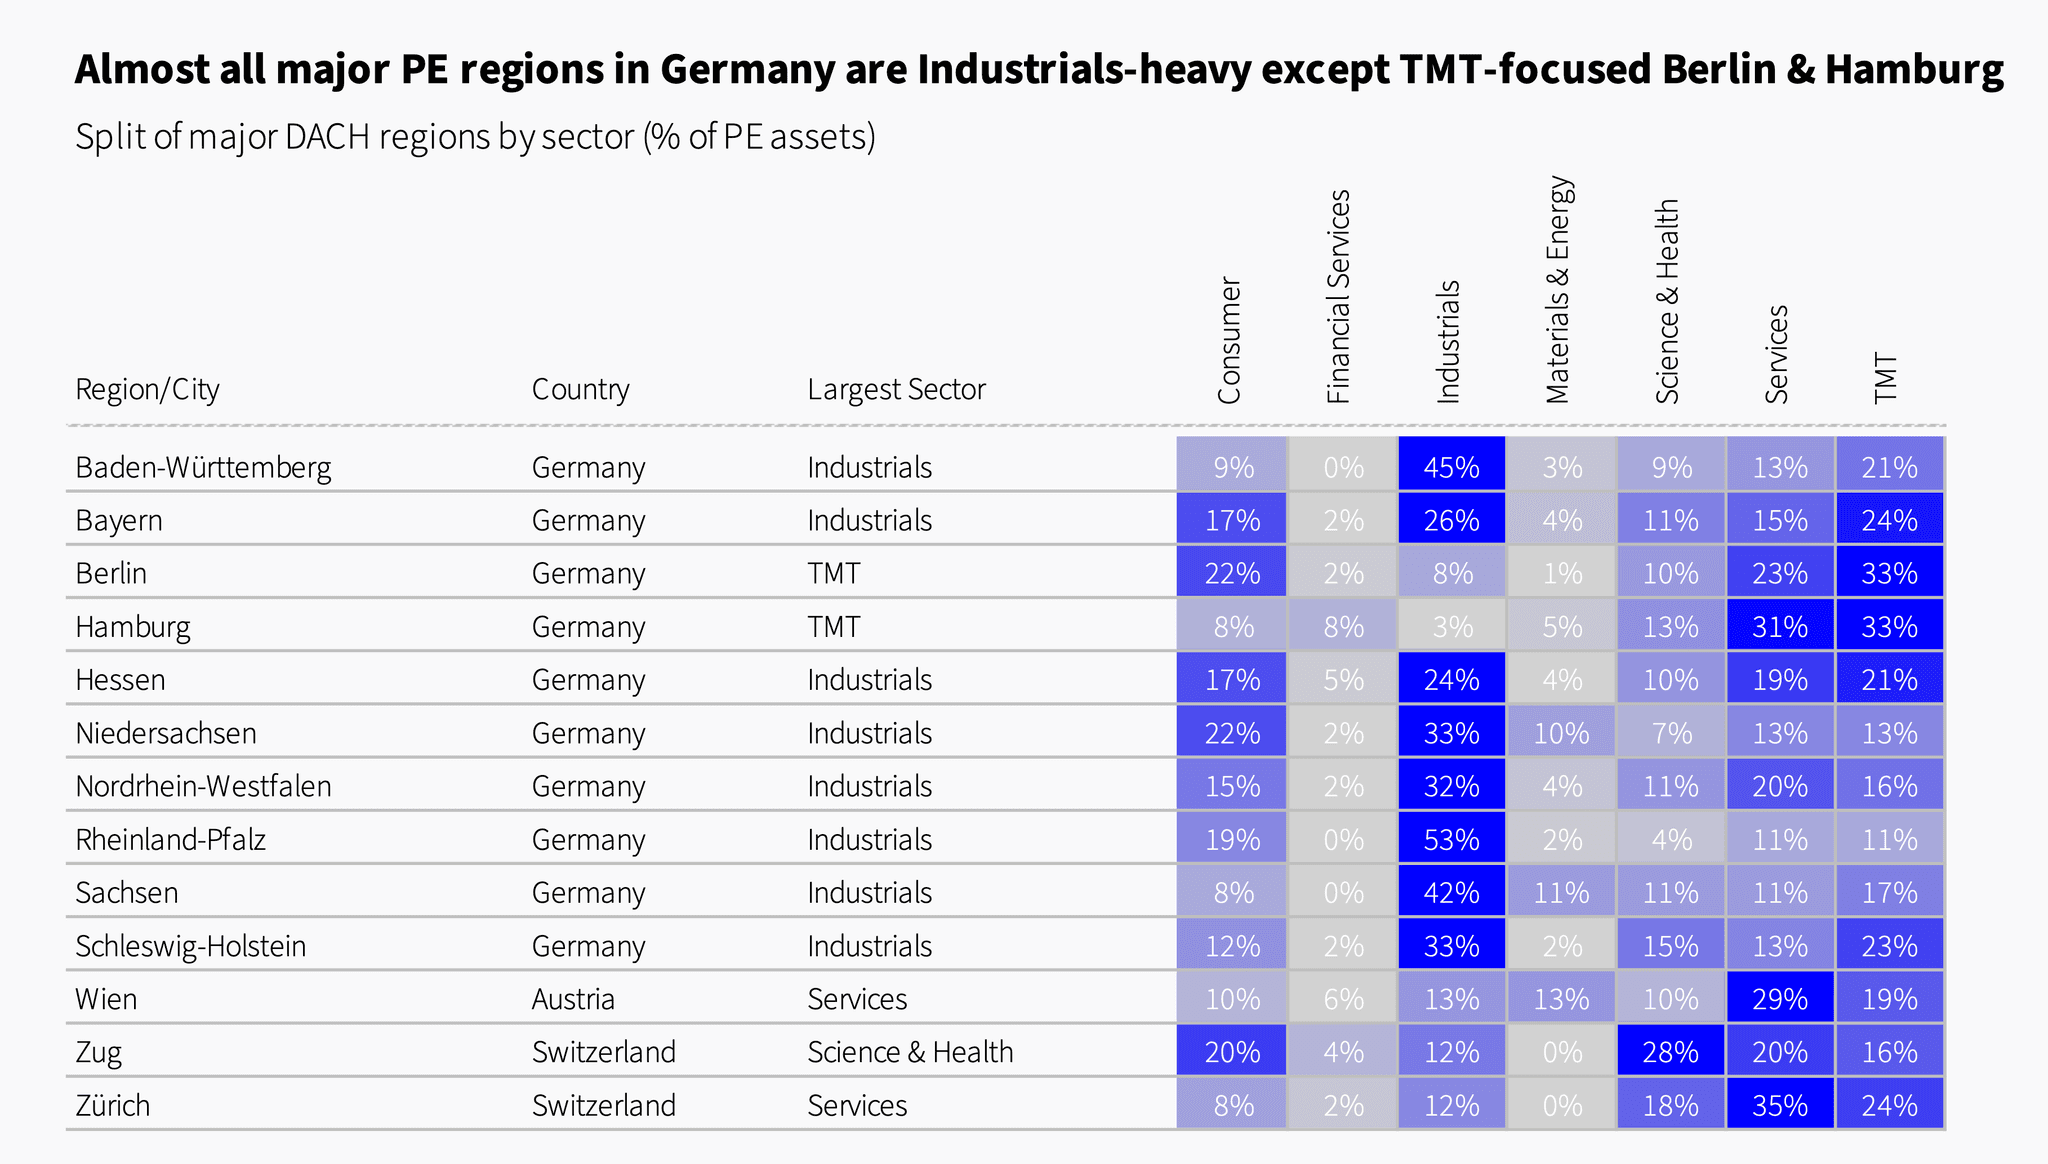
Bayern is a leader in terms of % of assets from various sectors. Nonetheless, there are exceptions such as #1 Financial Services region, Hessen, as well as Baden-Württemberg in Industrials and Nordrhein-Westfalen in Services. Furthermore, we noticed that city-regions like Berlin, Hamburg, Vienna or Zurich hold strong positions in people-focused sectors like Consumer, Financial Services or Science & Health.

Growth and Margin
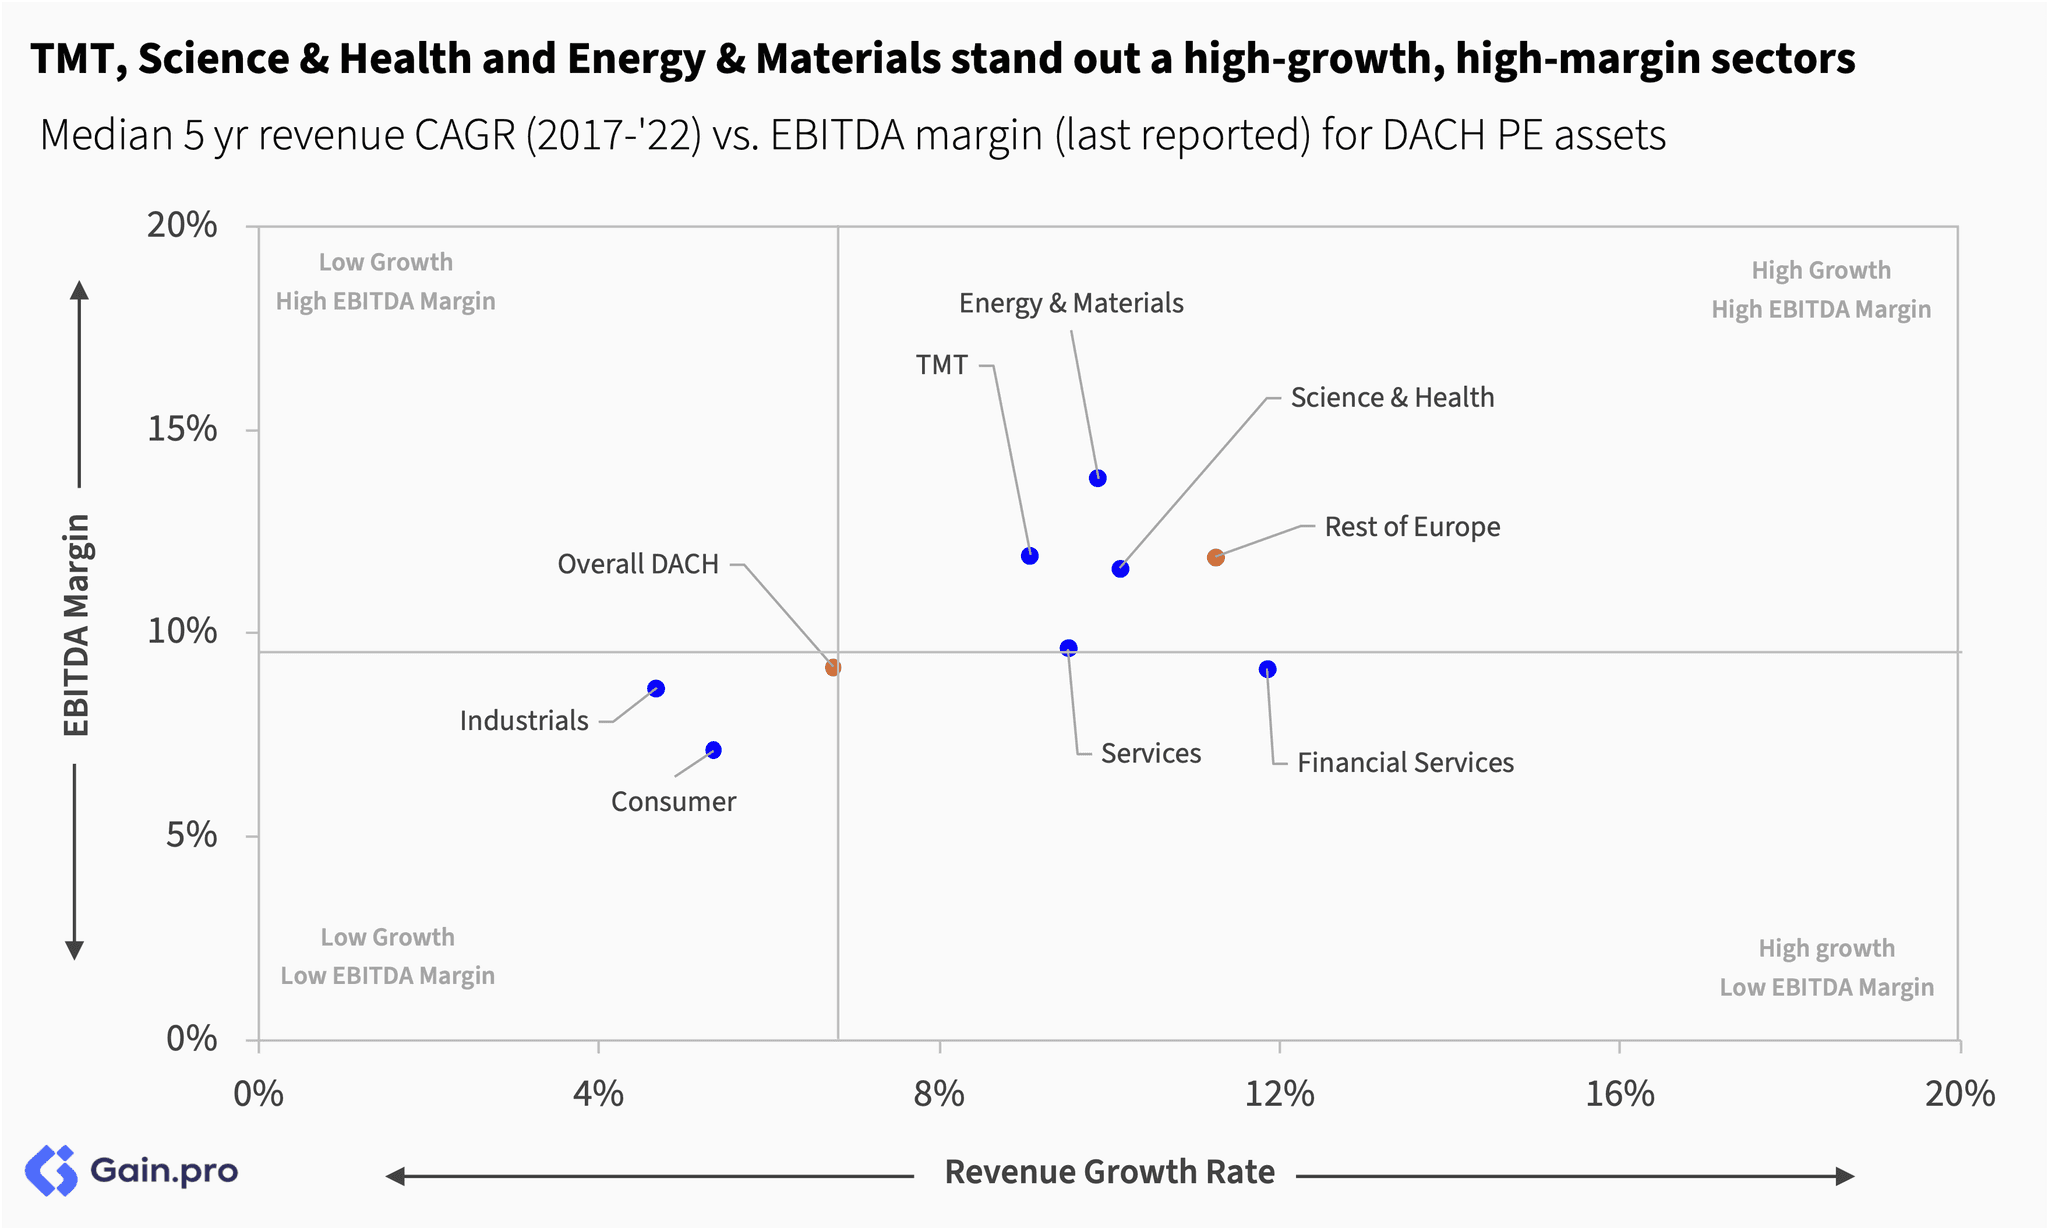
Growth for PE-backed assets in DACH is coming off from cycle highs although they remain above pre-pandemic levels. To add to it, growth in DACH is slower than the Rest of Europe, driven by geographical sector mix and exposure to low-growth end-markets such as automotive.
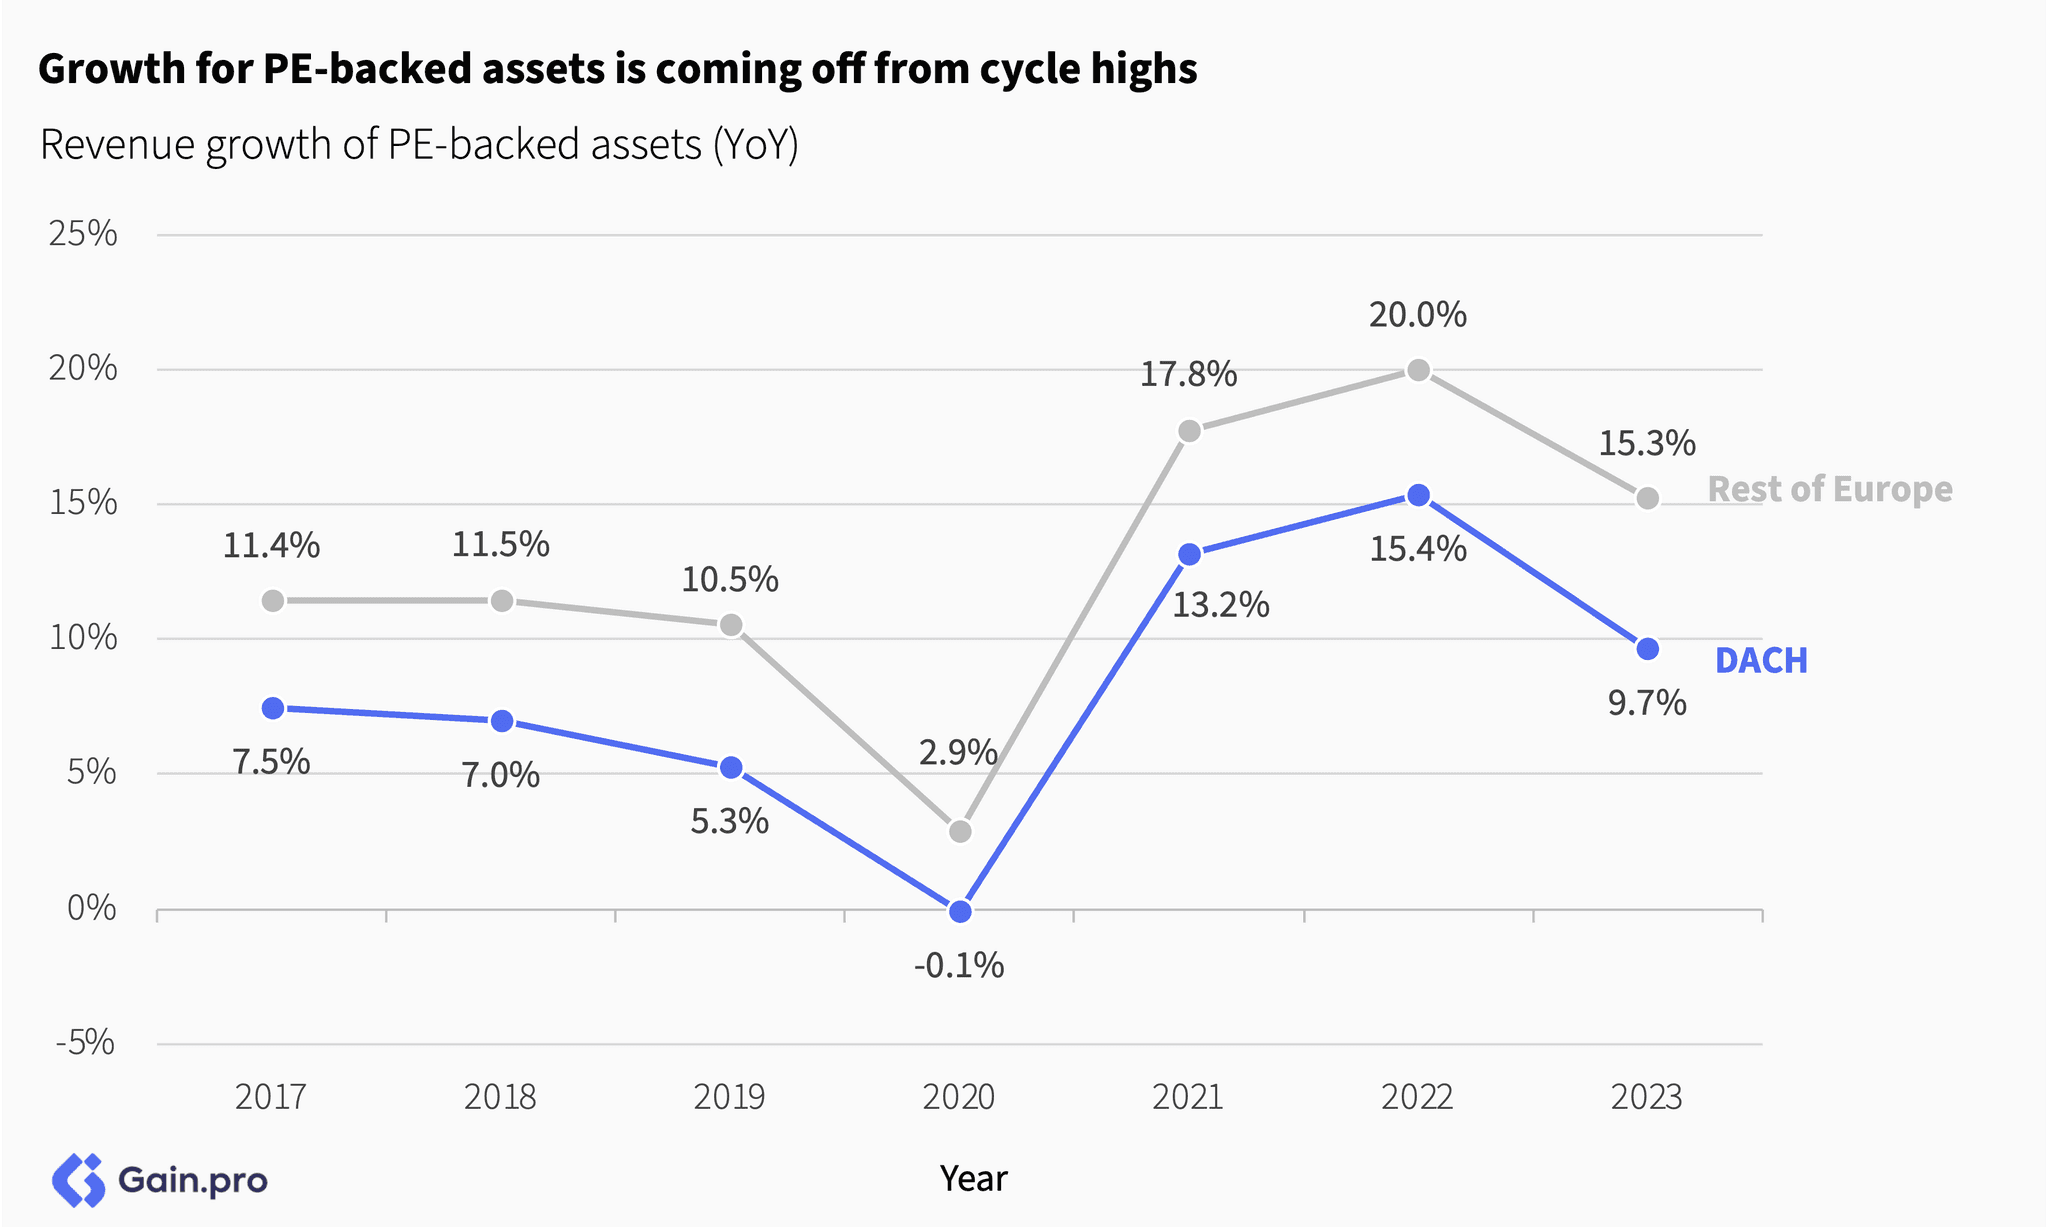
Margins for DACH PE assets have been stable over the last 6 years. Compared to the Rest of Europe, margins are also lower in DACH, driven by a high proportion of lower-margin Industrials sectors.

TMT, Science & Health and Energy & Materials stand out as high-growth high-margin sectors. In contrast, Industrials and Consumer assets have both lower growth rates and margins.