The US 100

Executive Summary
Key takeaways from our analysis:
Blackstone has emerged as the largest private equity investor in the US, managing a total estimated EV of $156bn. Other investors in the top 5 include KKR ($100bn), Thoma Bravo ($81bn), Apollo ($77bn), and Hellman & Friedman ($65bn).
Collectively, the US 100 investors manage an EV of $2.2tn. The market is fairly concentrated at the upper end with the top 10 investors accounting for one-third of total EV. Despite its significant size, the aggregated US 100 EV is just 4% of the >$60 trillion US public equity market.
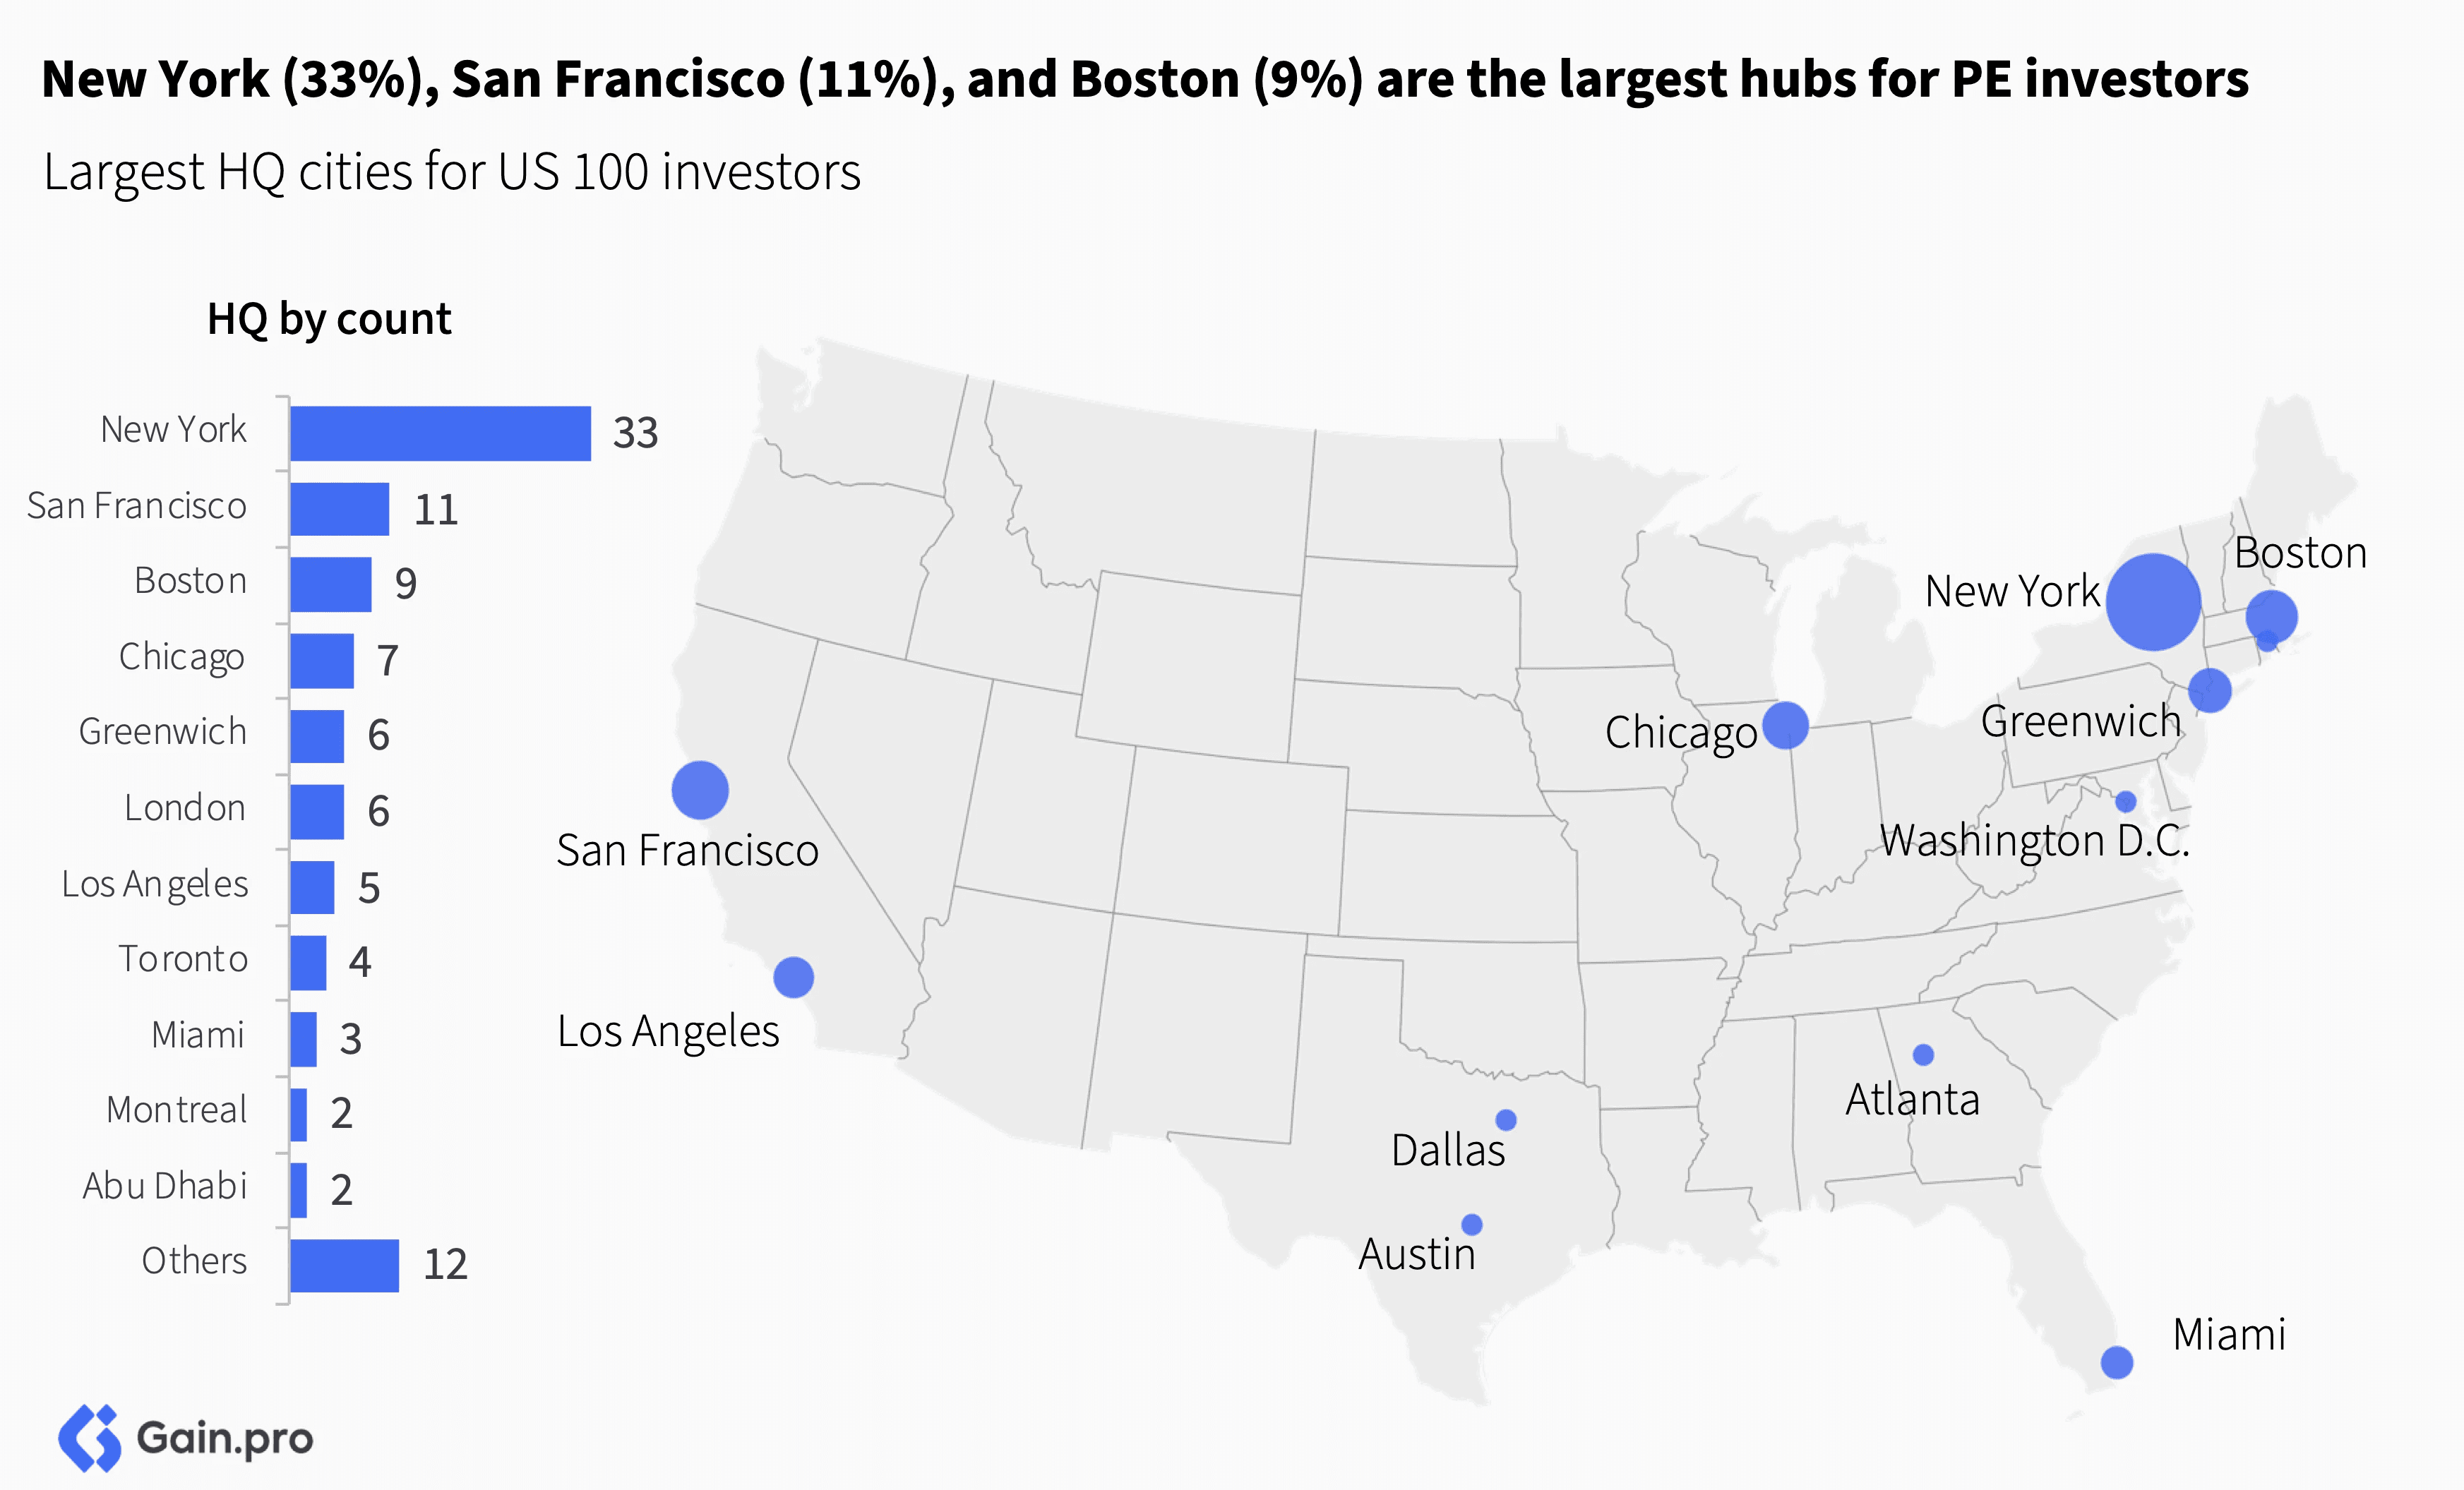
New York is the largest hub for US 100 investors, accounting for 33% of HQs, followed by San Francisco (11%), Boston (9%), Chicago (7%), and Greenwich (6%). Sponsors headquartered in the US manage 85% of the total EV.
Holding periods for US 100 investors reached record highs in 2024, with a median of 5.3 years, up from 4.2 years in 2021. Notably, 56% of assets exited in 2024 had been held for over five years, compared to 37% in 2020.
TMT and Services assets make up 53% of the US 100 portfolio. Geographically, the assets are concentrated in California (13%), Texas (12%), New York (7%), Florida (6%), and Illinois (6%), with the top 16 states representing 80% of PE assets.


Chapter 01: US 100 Ranking
Blackstone has emerged as the largest private equity investor in the US, managing a total estimated EV of $156bn, followed by KKR (managing an EV of $100bn,) and Thoma Bravo ($81bn).
Other investors in the top 10 include Apollo Global Management ($77bn), Hellman & Friedman ($65bn), Bain Capital ($59bn), Vista Equity Partners ($54bn), Carlyle ($48bn), TPG Capital ($45bn), and EQT ($44bn).
Collectively, the top 100 investors in the US manage an estimated EV of $2.2tn across 3,207 assets. On average, they have a portfolio EBITDA of $125m and manage 32 companies each.
Over the last 6 years, US 100 investors have invested in 2.5x as many new portfolio companies as they have exited. Specifically, there have been 2,685 new investments and 1,085 exits from these sponsors.
The table below lists all the top 100 investors in the US. Use the search bar or the arrows at the top to navigate through the ranking.

Dominant Investor HQs
American investors dominate the US 100 ranking. Sponsors headquartered in the US manage 85% of the aggregate US 100 EV. Notable investors HQ’d outside the US include EQT (managing EV of $44bn in the US), GIC ($26bn), Permira ($24bn), Partners Group ($24bn), and CVC ($19bn).

New York is the largest hub for US 100 investors, accounting for 33% of HQs, followed by San Francisco (11%), Boston (9%), Chicago (7%), and Greenwich (6%). Secondary hubs include Miami, Atlanta, Dallas, Washington, D.C., and Austin. Hubs outside the US include London and Toronto.
Investor Concentration
The US 100 landscape is fairly concentrated at the upper end, with the top 10 investors managing roughly one-third of the aggregated US 100 EV. Private equity firms, like other large asset managers, benefit from inherent scale advantages, and recent fundraising trends have also favored larger investors.

Despite its significant size, the US private equity market remains small compared to the vast US public equities market. US 100 investors manage $2.2 trillion in enterprise value — just 4% of the >$60 trillion US public equity market. In fact, the aggregated US 100 EV is smaller than individual giants like NVIDIA, Microsoft, and Apple, with ‘The Magnificent 7’ companies alone accounting for seven times the US 100 EV.

Private equity remains a scale game, which takes time and commitment to build. This is evidenced by the distribution of managed EV based on investors' founding years. Investors established in the 1990s or before manage 82% of the total EV. 9 out of the top 10 largest private equity firms in the US 100 ranking were founded during or before the 1990s. Vista Equity Partners, founded in 2000, Roark Capital in 2001, and Clearlake in 2006 stand out as larger young entrants.

Chapter 02: Sector Insights
Top Investors
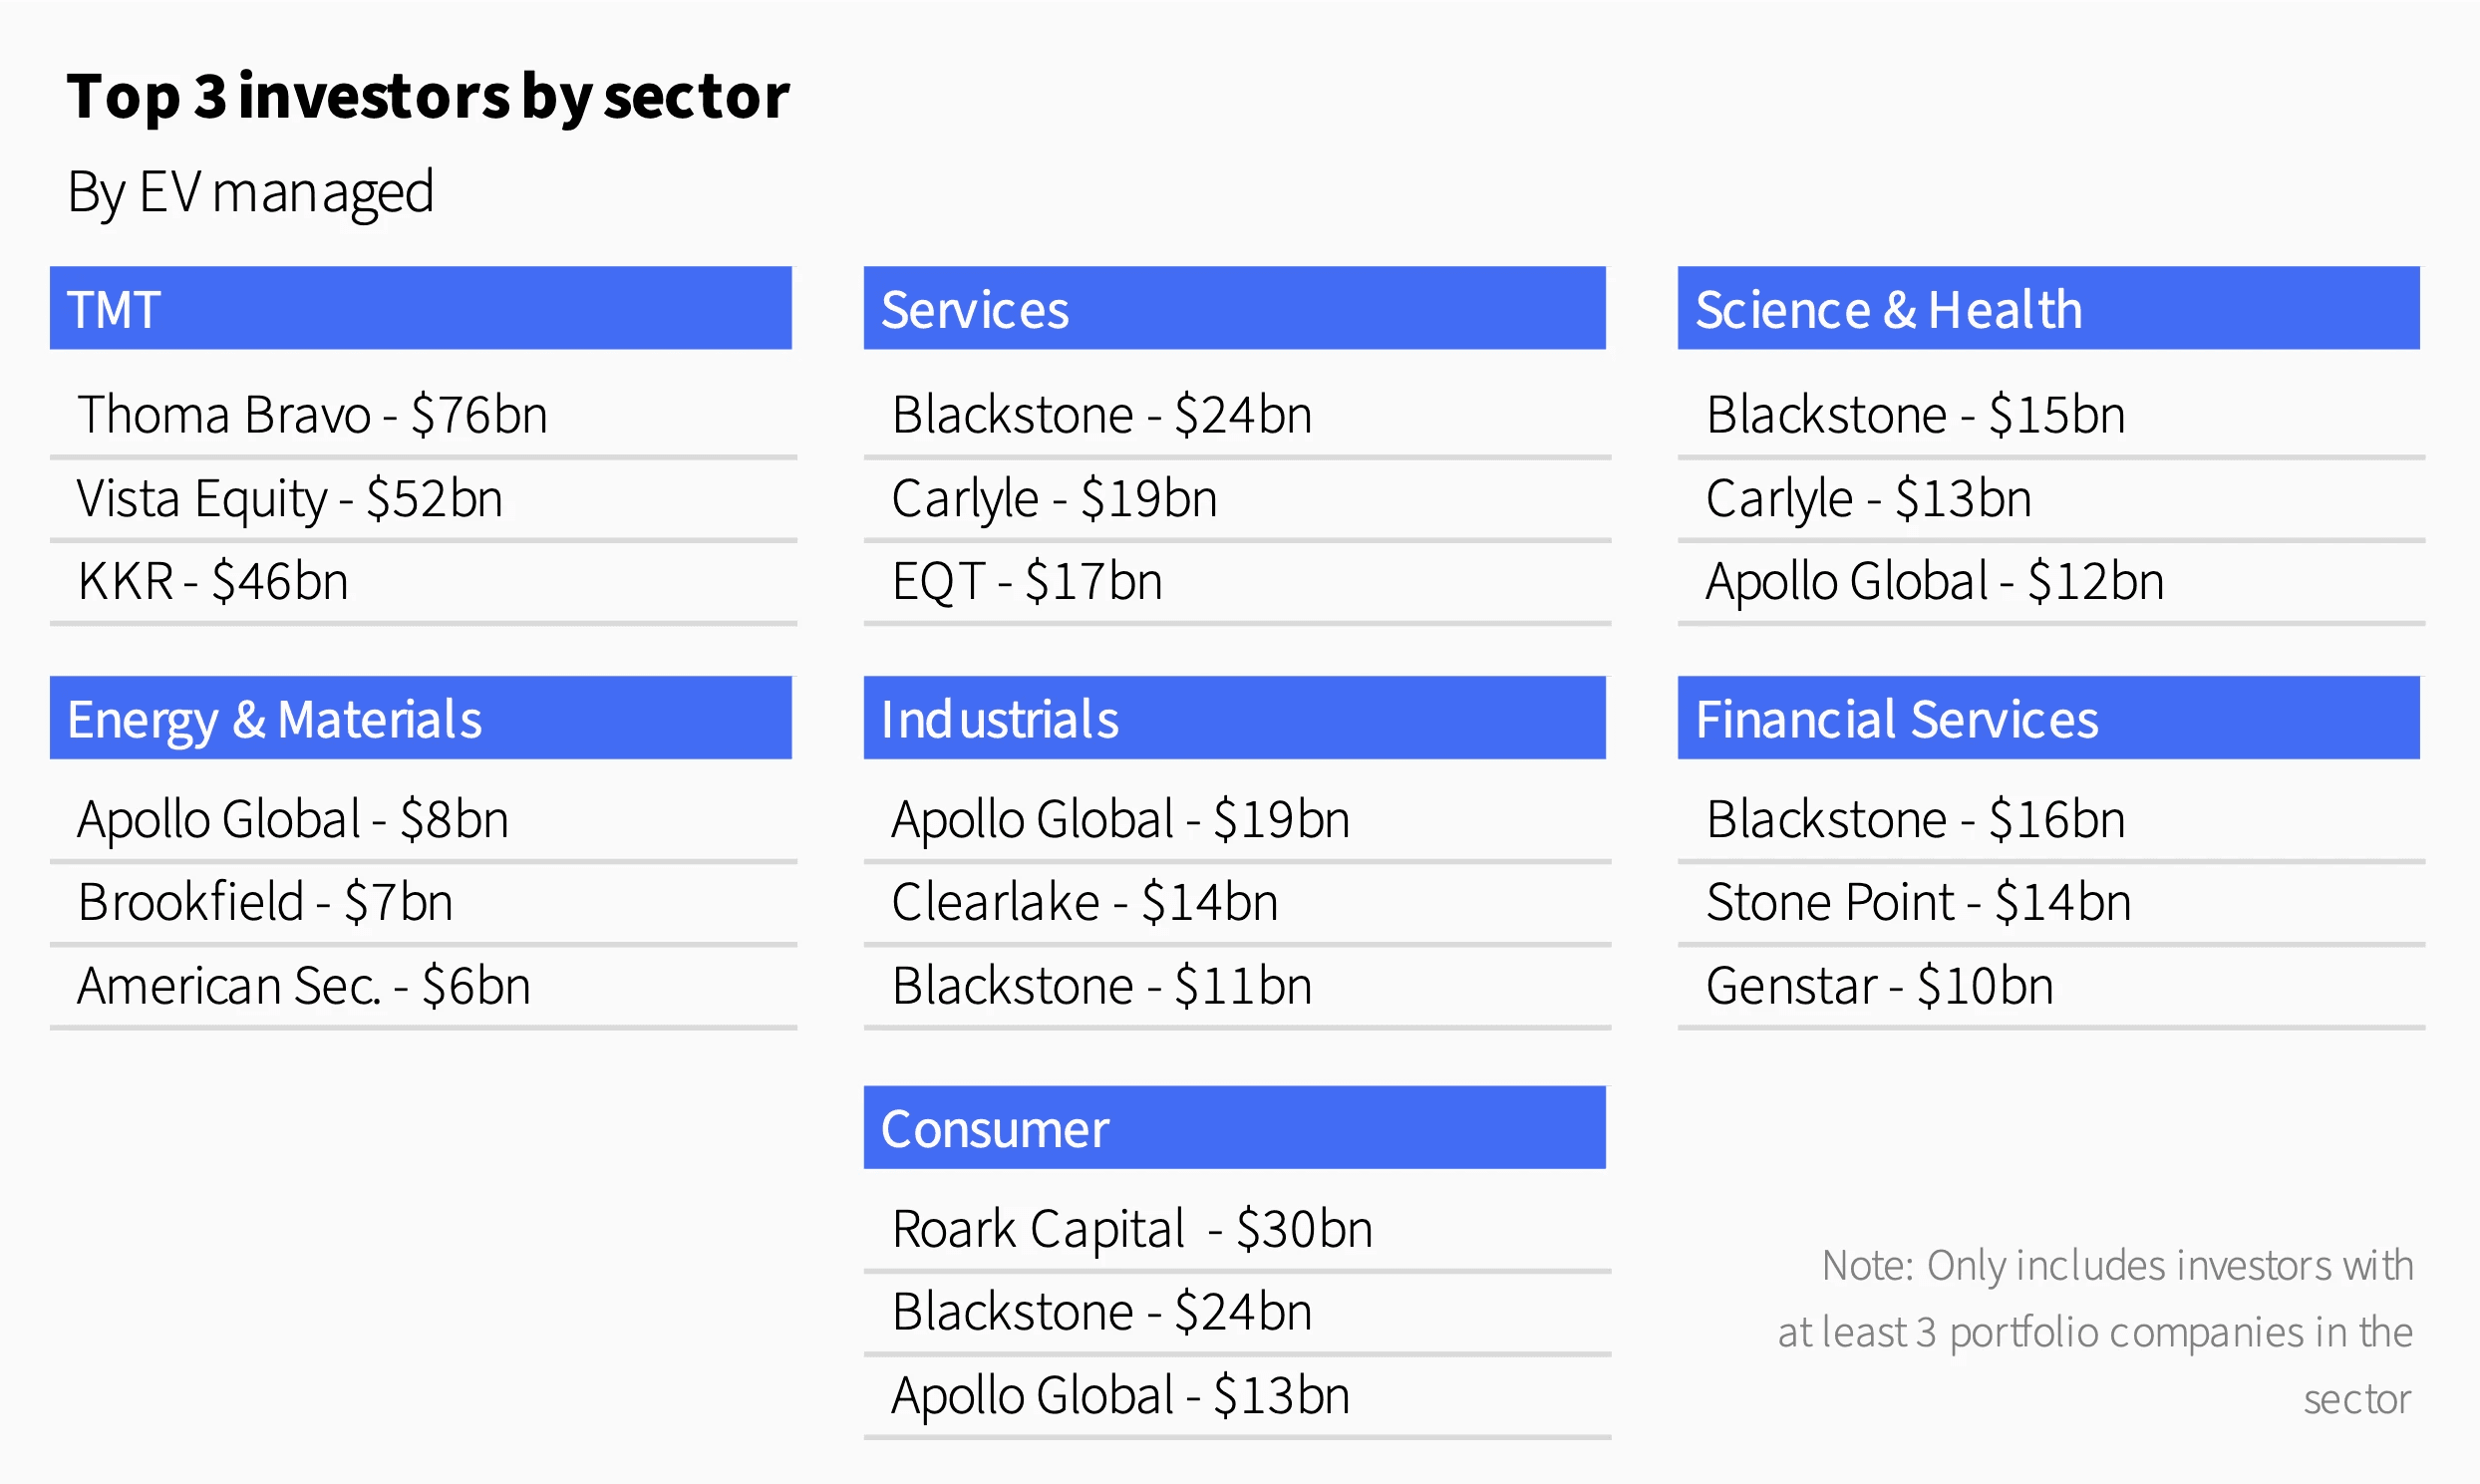
Leading investors by enterprise value in each sector include Thoma Bravo (TMT), Blackstone (Services, Science & Health and Financial Services), Apollo Global Management (Energy & Materials and Industrials), and Roark Capital (Consumer). Thoma Bravo in TMT and Roark Capital in Consumer stand out for their strong sector focus, with 94% and 59% of their portfolios concentrated in these areas, respectively.
Sector Focus
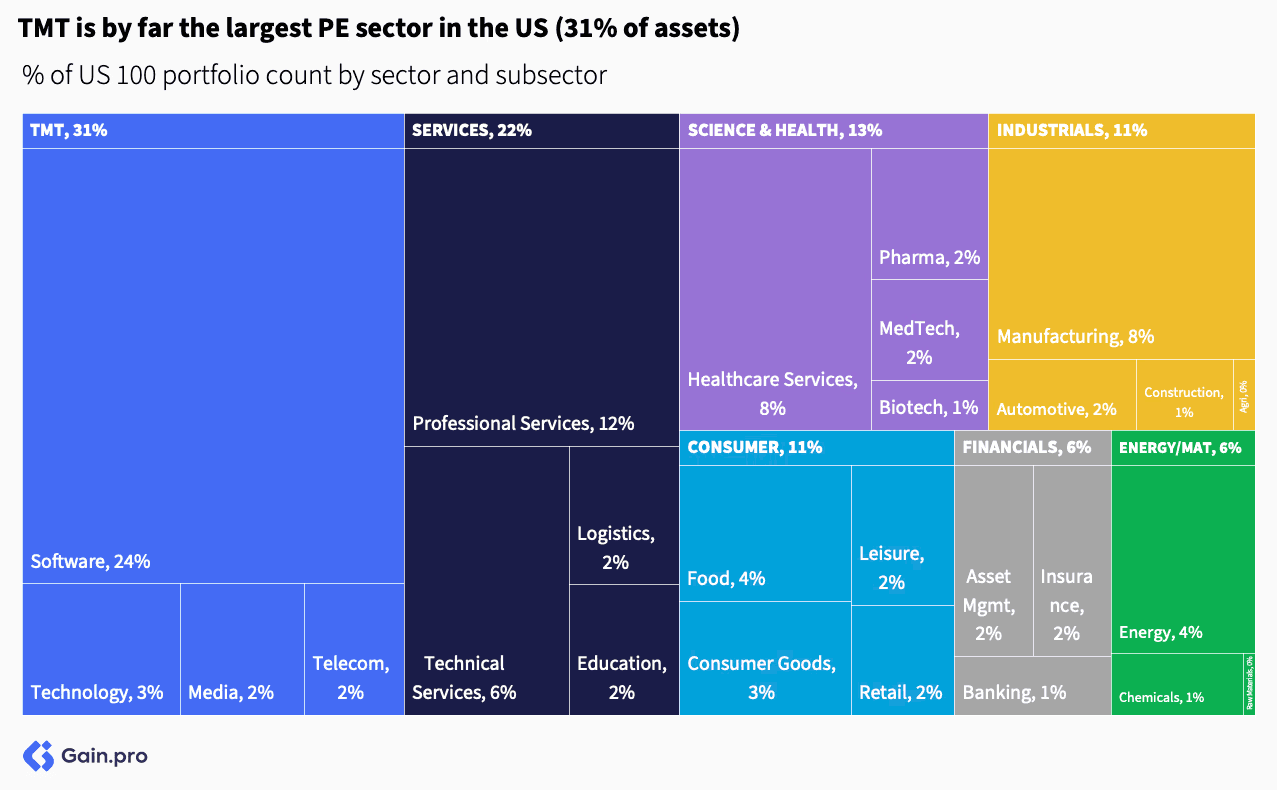
By sector, TMT (31%), Services (22%), and Science & Health (13%) make up two-thirds of the US 100 portfolio, with Software (24%), Professional Services (12%), and Healthcare Services (8%) leading at the subsector level. For comparison, the largest sector in the S&P 500 by weight is Information Technology at 31%, followed by Financials at 15%, and Healthcare at 11%. The broader Rusell 2000 has only 11% of its weight in Technology, with Industrials being the largest sector at 19%.
The sector mix for PE entries has changed. The share of TMT (+12pp) has grown since 2012 as investors gravitate towards asset-light and fast-growing businesses that hold a growing share in the economy. The share of Consumer (-6pp) and Industrials deals (-8pp) has shrunk driven by slowing underlying growth rates and a challenging exit environment.

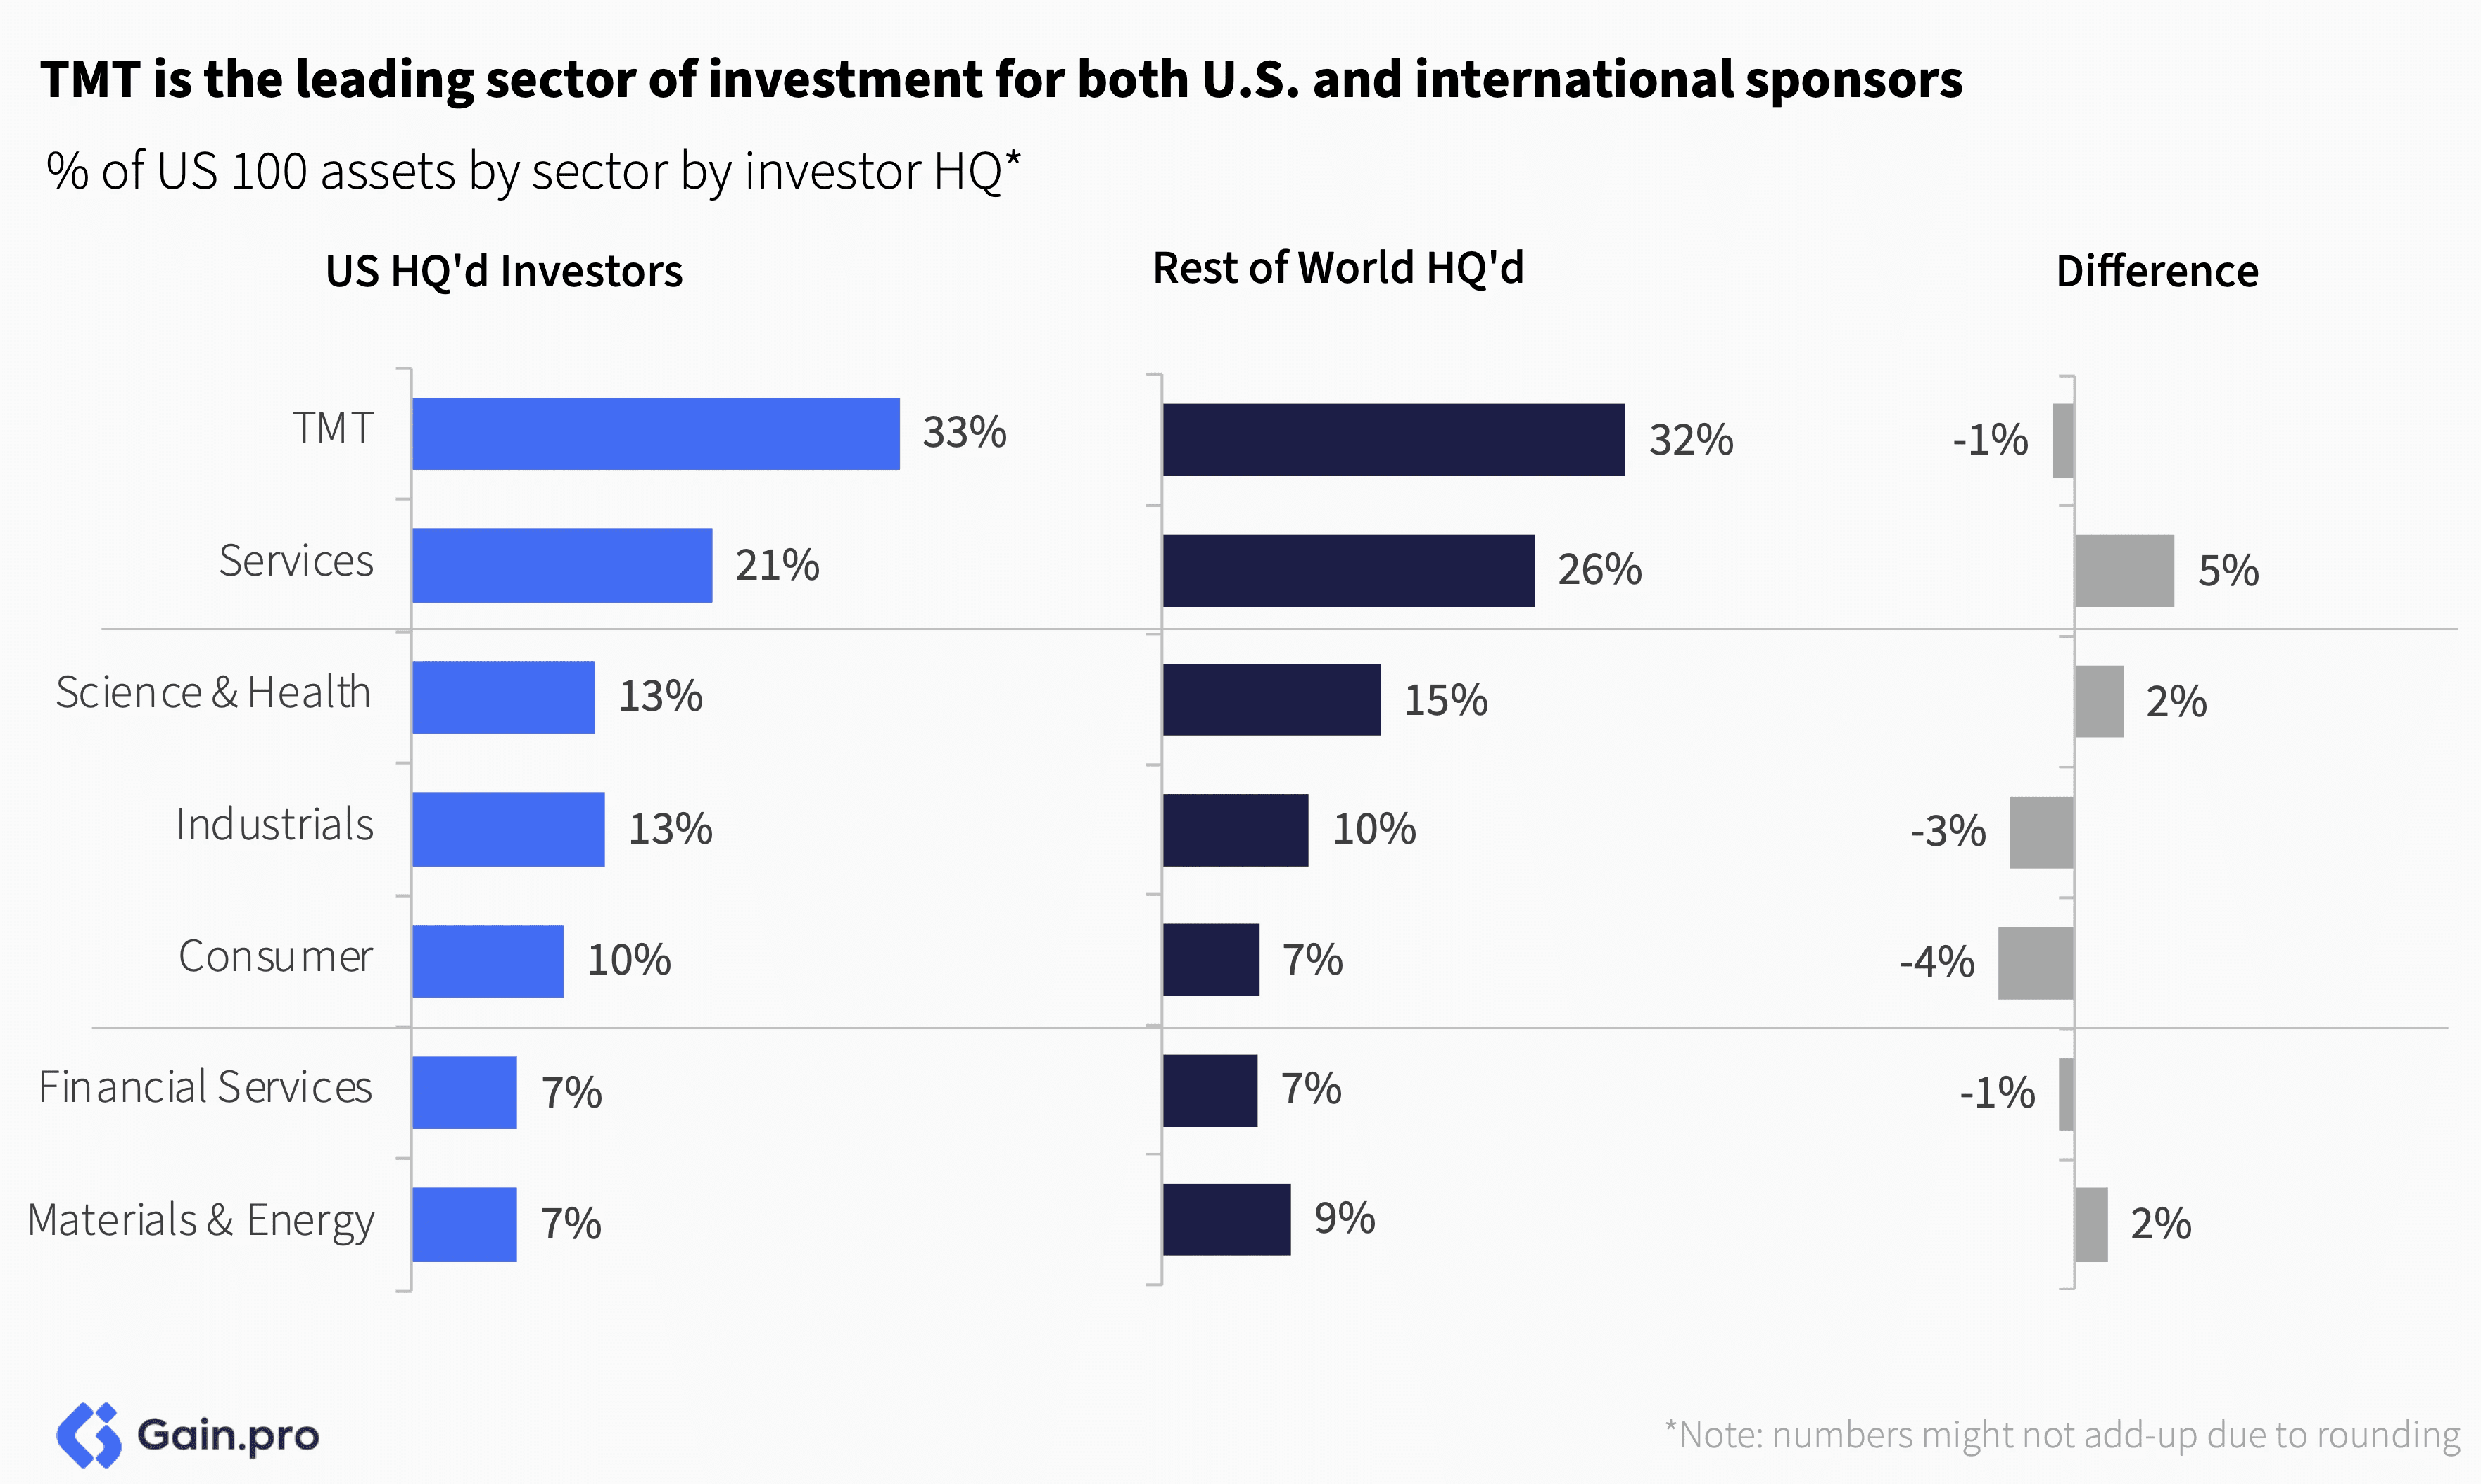
TMT is the leading sector of investment for both US and international sponsors. However, international investors show a stronger preference for Services and Science & Health, while U.S. sponsors lean more toward Industrials and Consumer sectors.
EV Concentration
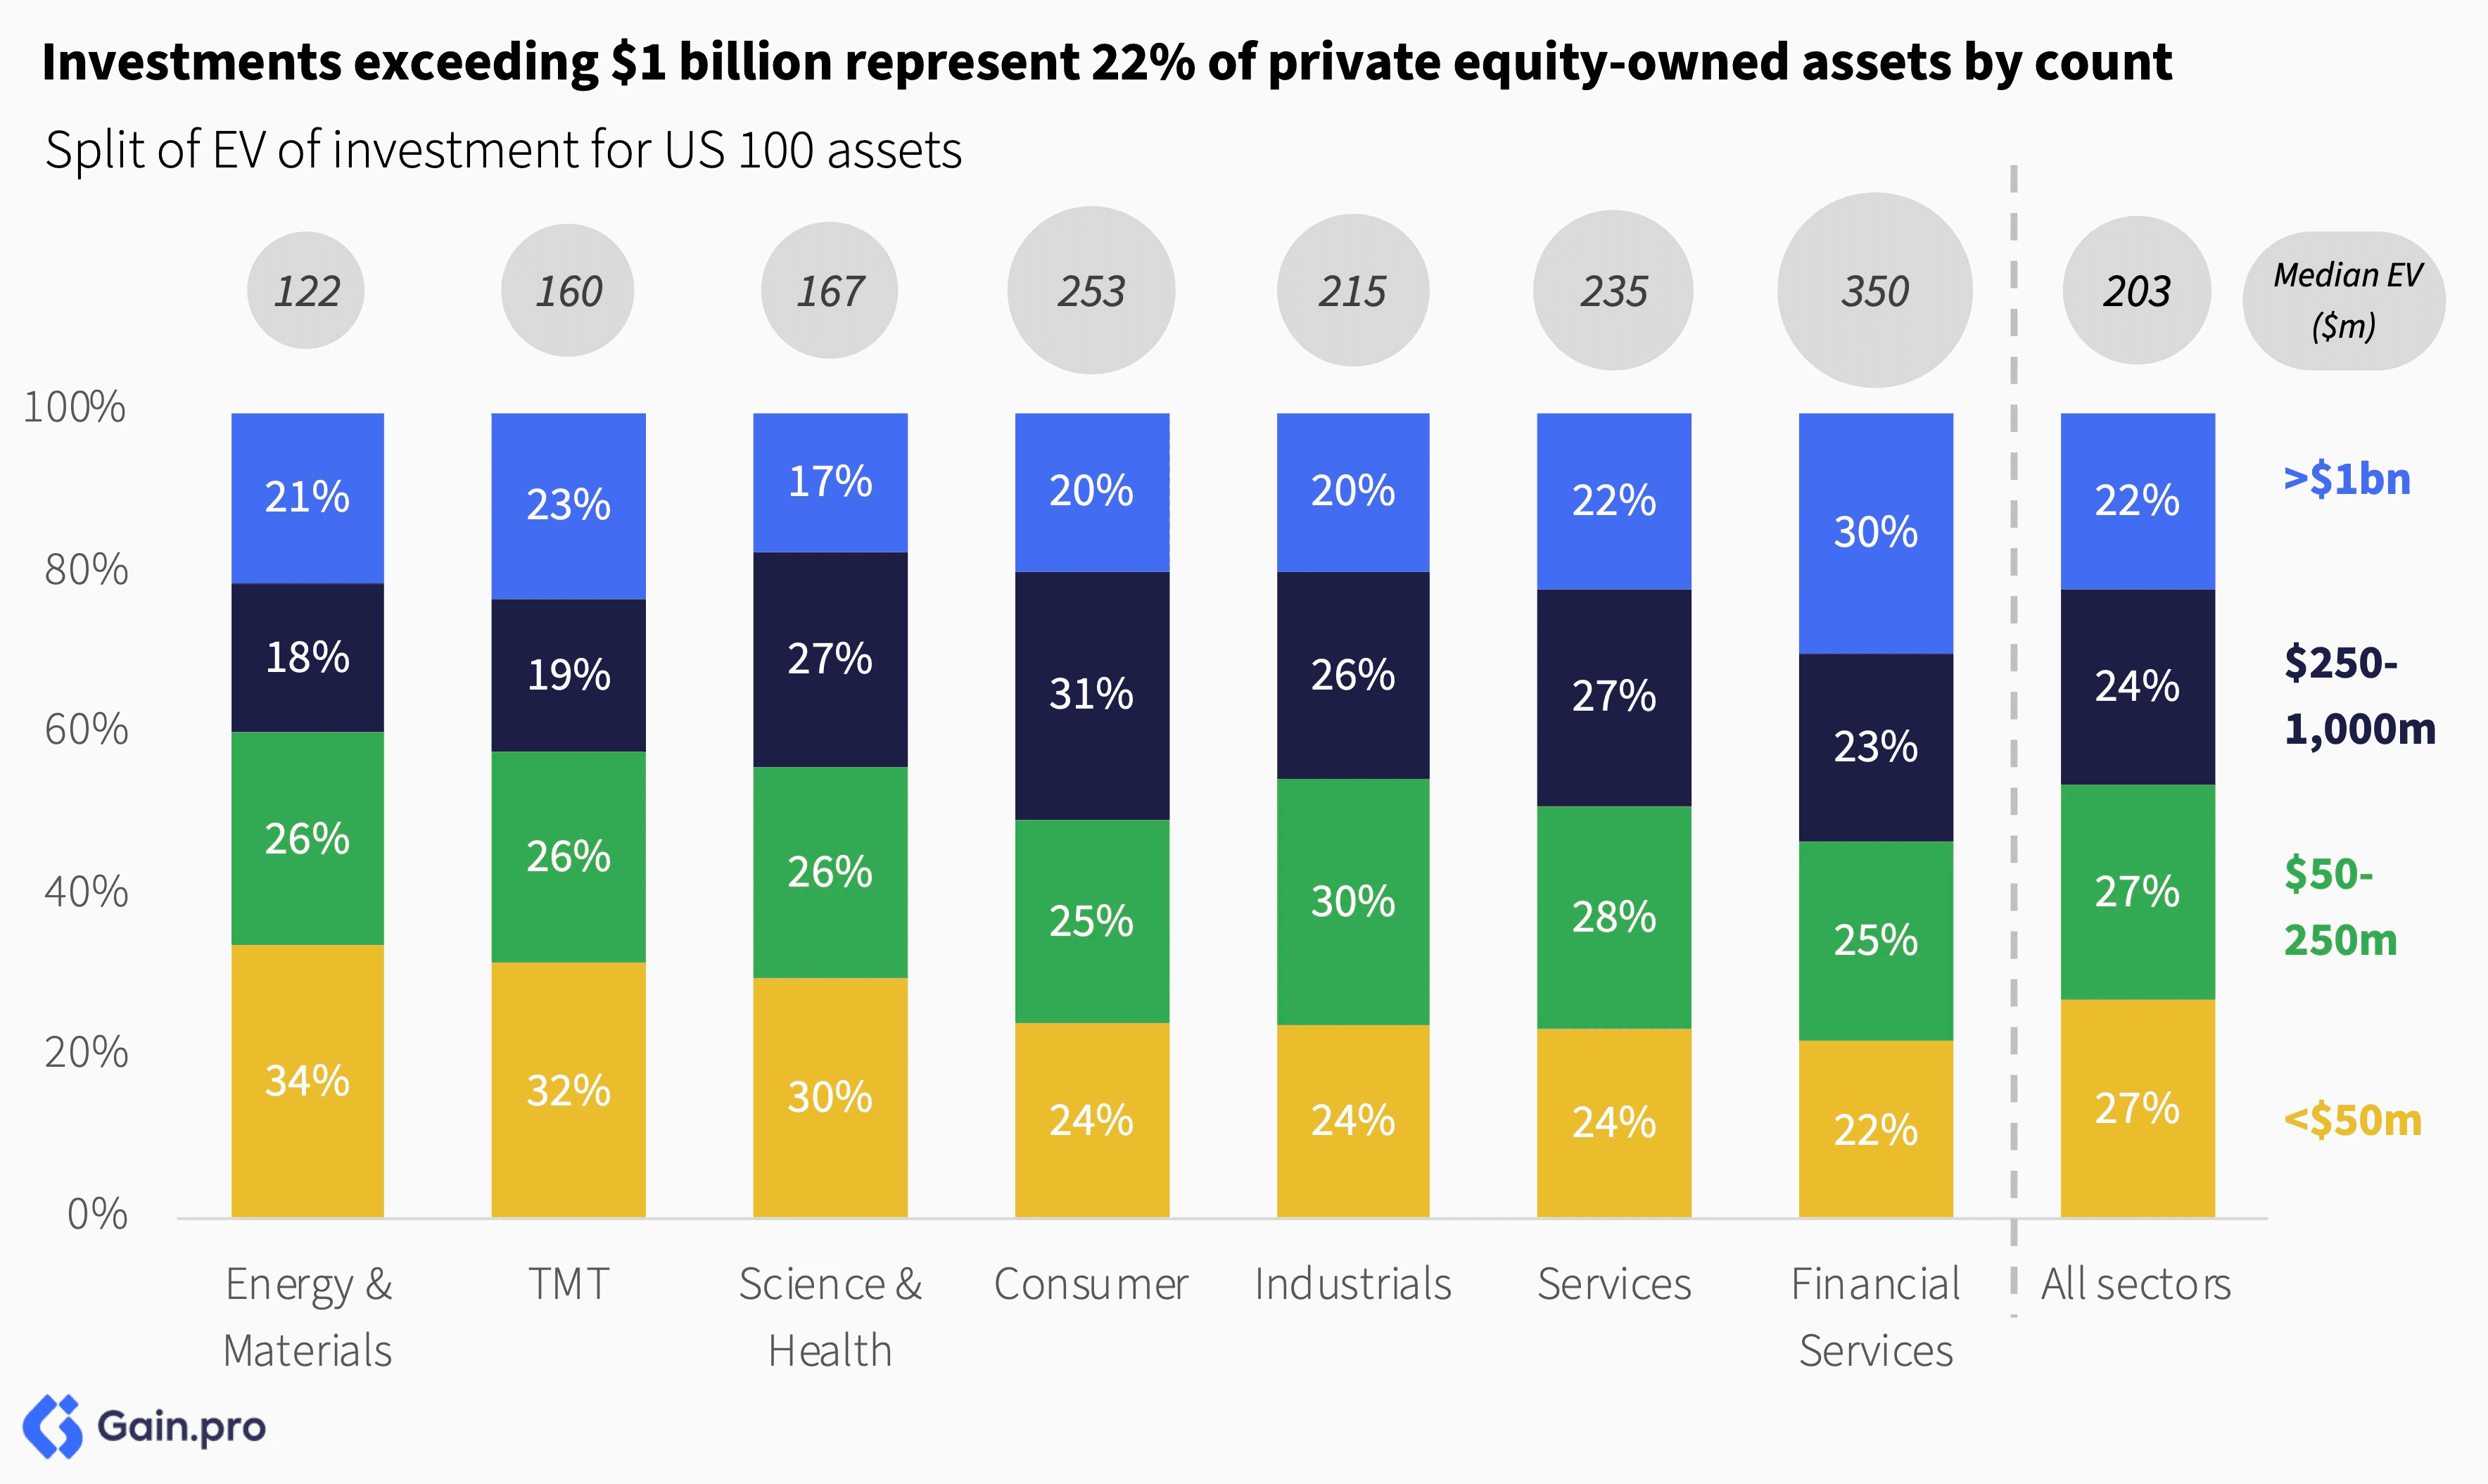
The US 100 enterprise value is predominantly concentrated in larger assets (EV > $1bn). These assets contribute towards 80% of the total EV. Financial Services and TMT lead in concentration, with 86% of their EV concentrated in these large assets. Meanwhile, Consumer, Science & Health, and Services are relatively more fragmented, with ~27% of their EV in sub-$1bn assets.

Investments exceeding $1 billion represent just 22% of private equity-owned assets by count, while those under $50 million account for approximately 27% of total investments. Sector-wise, Energy & Materials, TMT, and Science & Health hold a higher concentration of smaller assets. Notably, TMT stands out as it maintains a significant share of both larger and smaller assets.
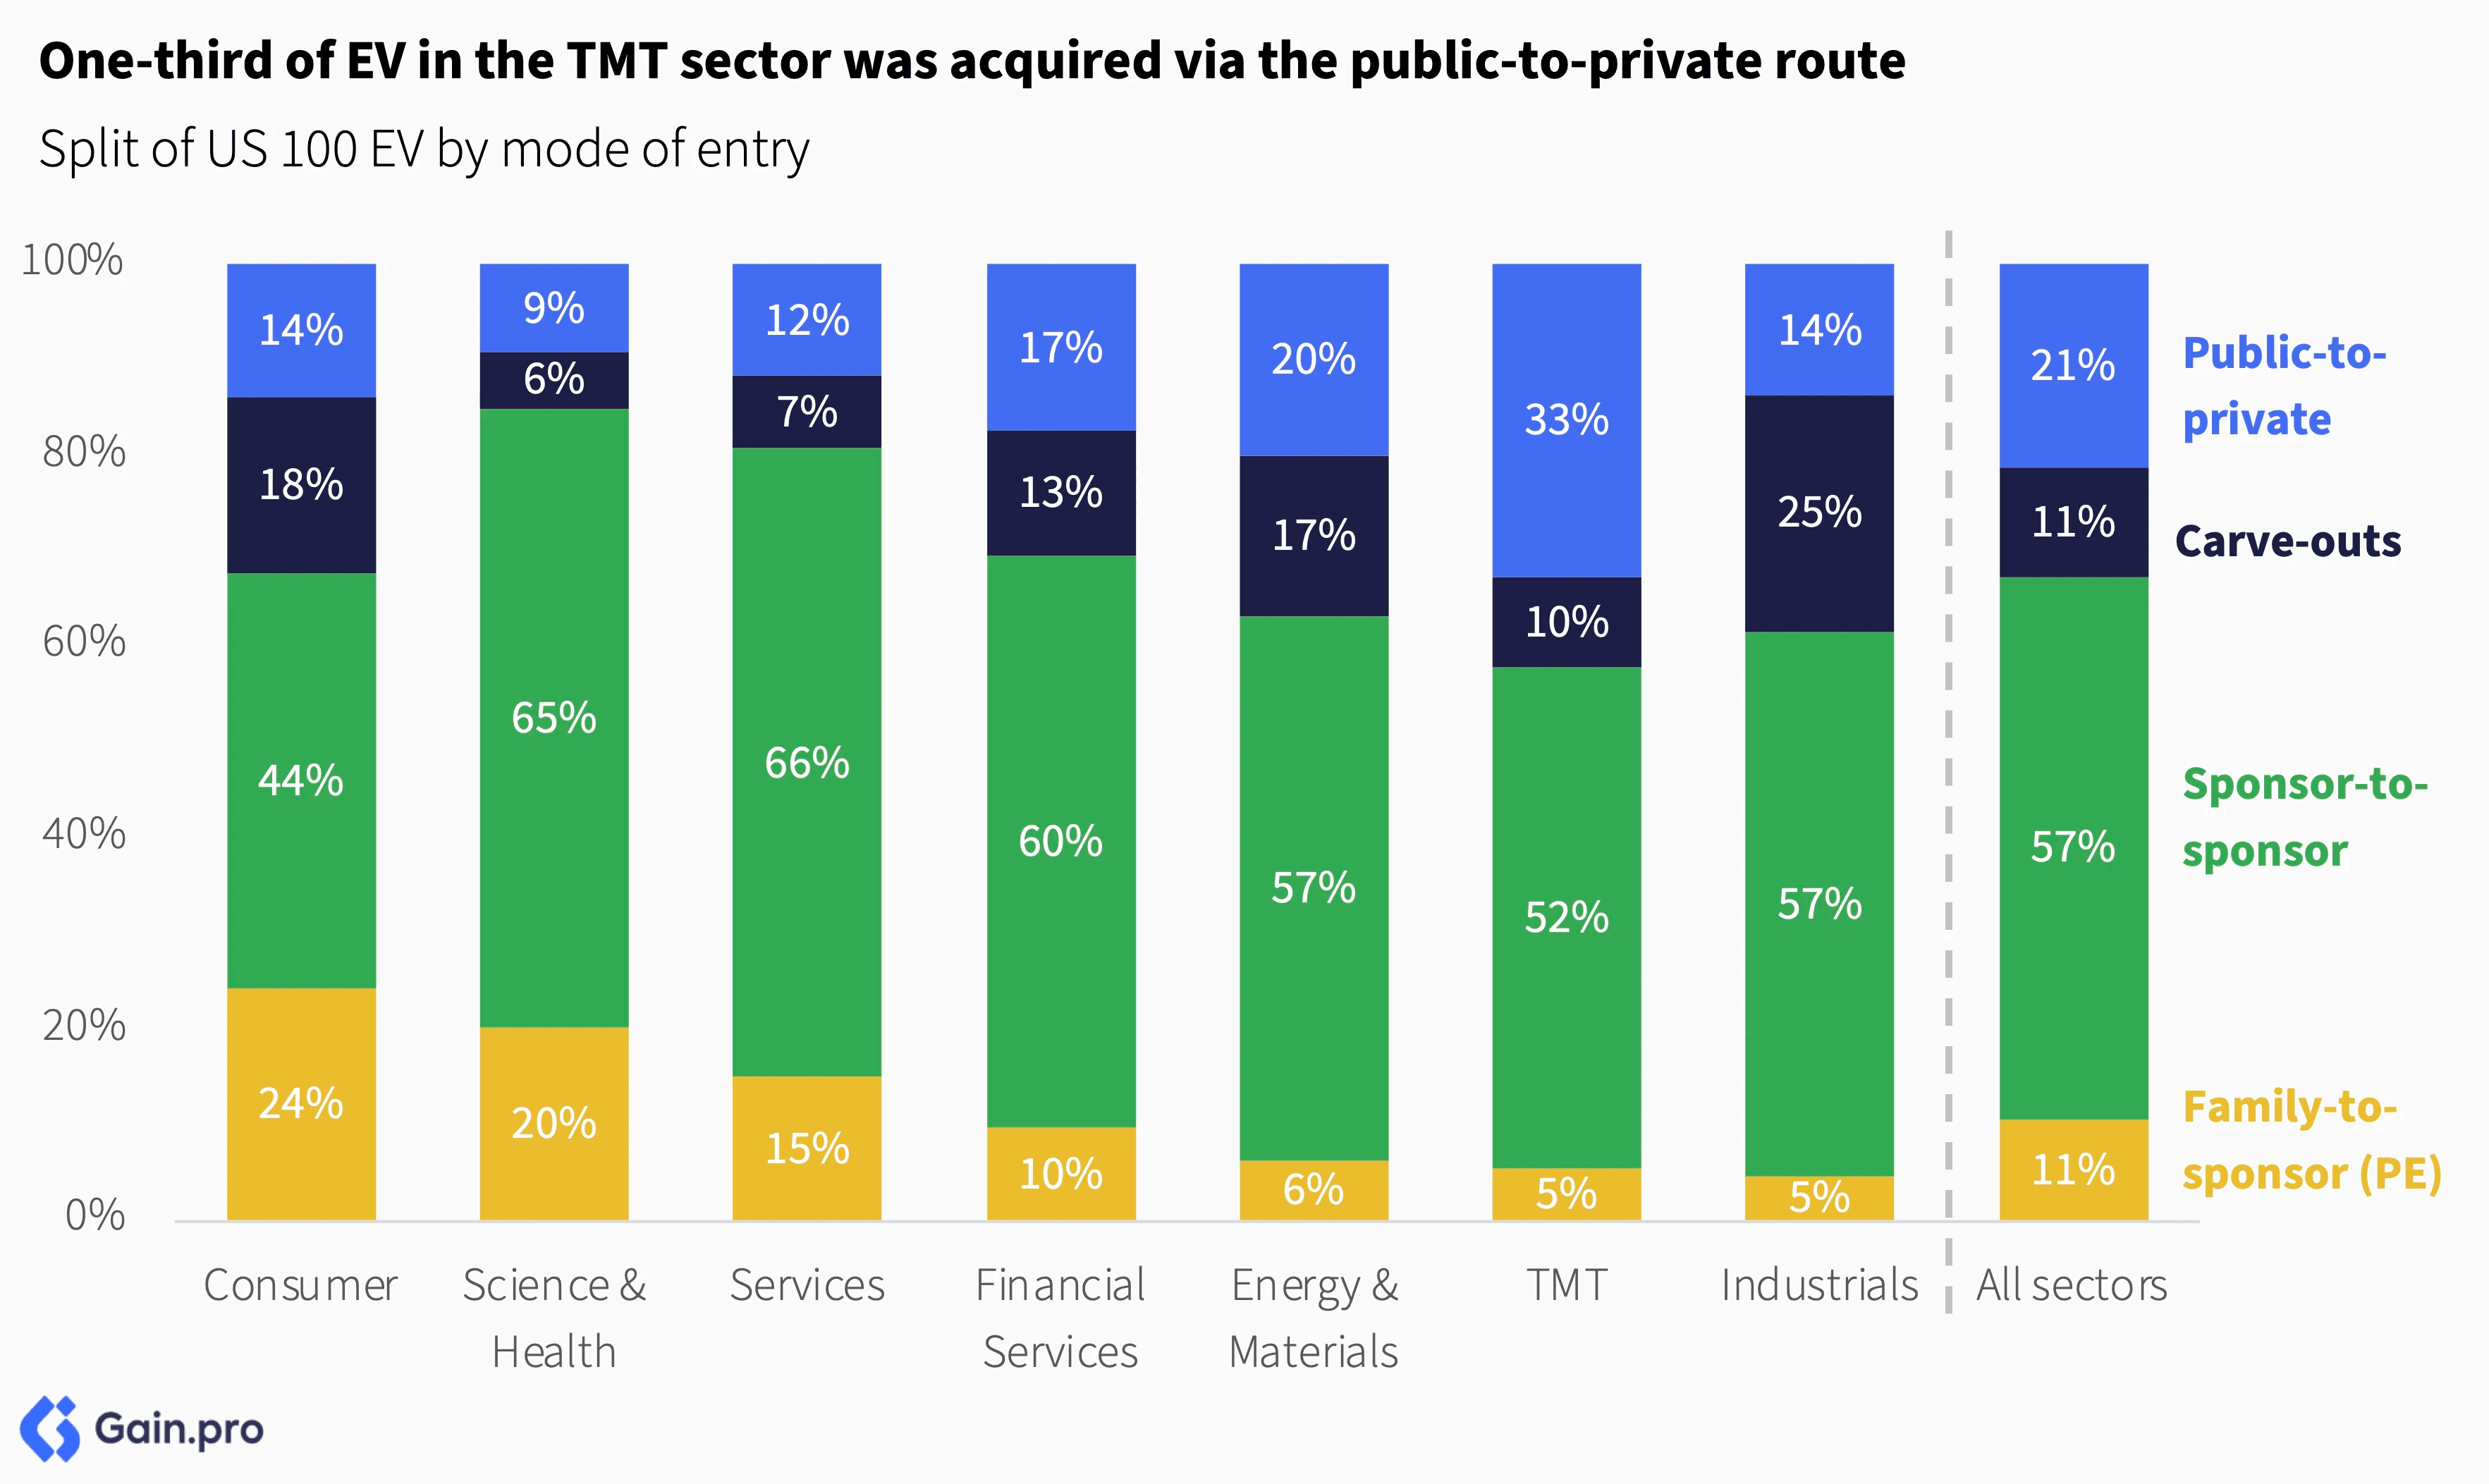
One-third of US 100 EV in TMT was acquired through the public-to-private route — the highest among all sectors. Broadly, the sponsor-to-sponsor route remains the most common, representing approximately 60% of EV acquired across sectors. Carve-outs are notably more prevalent in Industrials (25% EV) and Consumer (18% EV), driven by large-scale conglomerates divesting assets to realign their strategic focus.
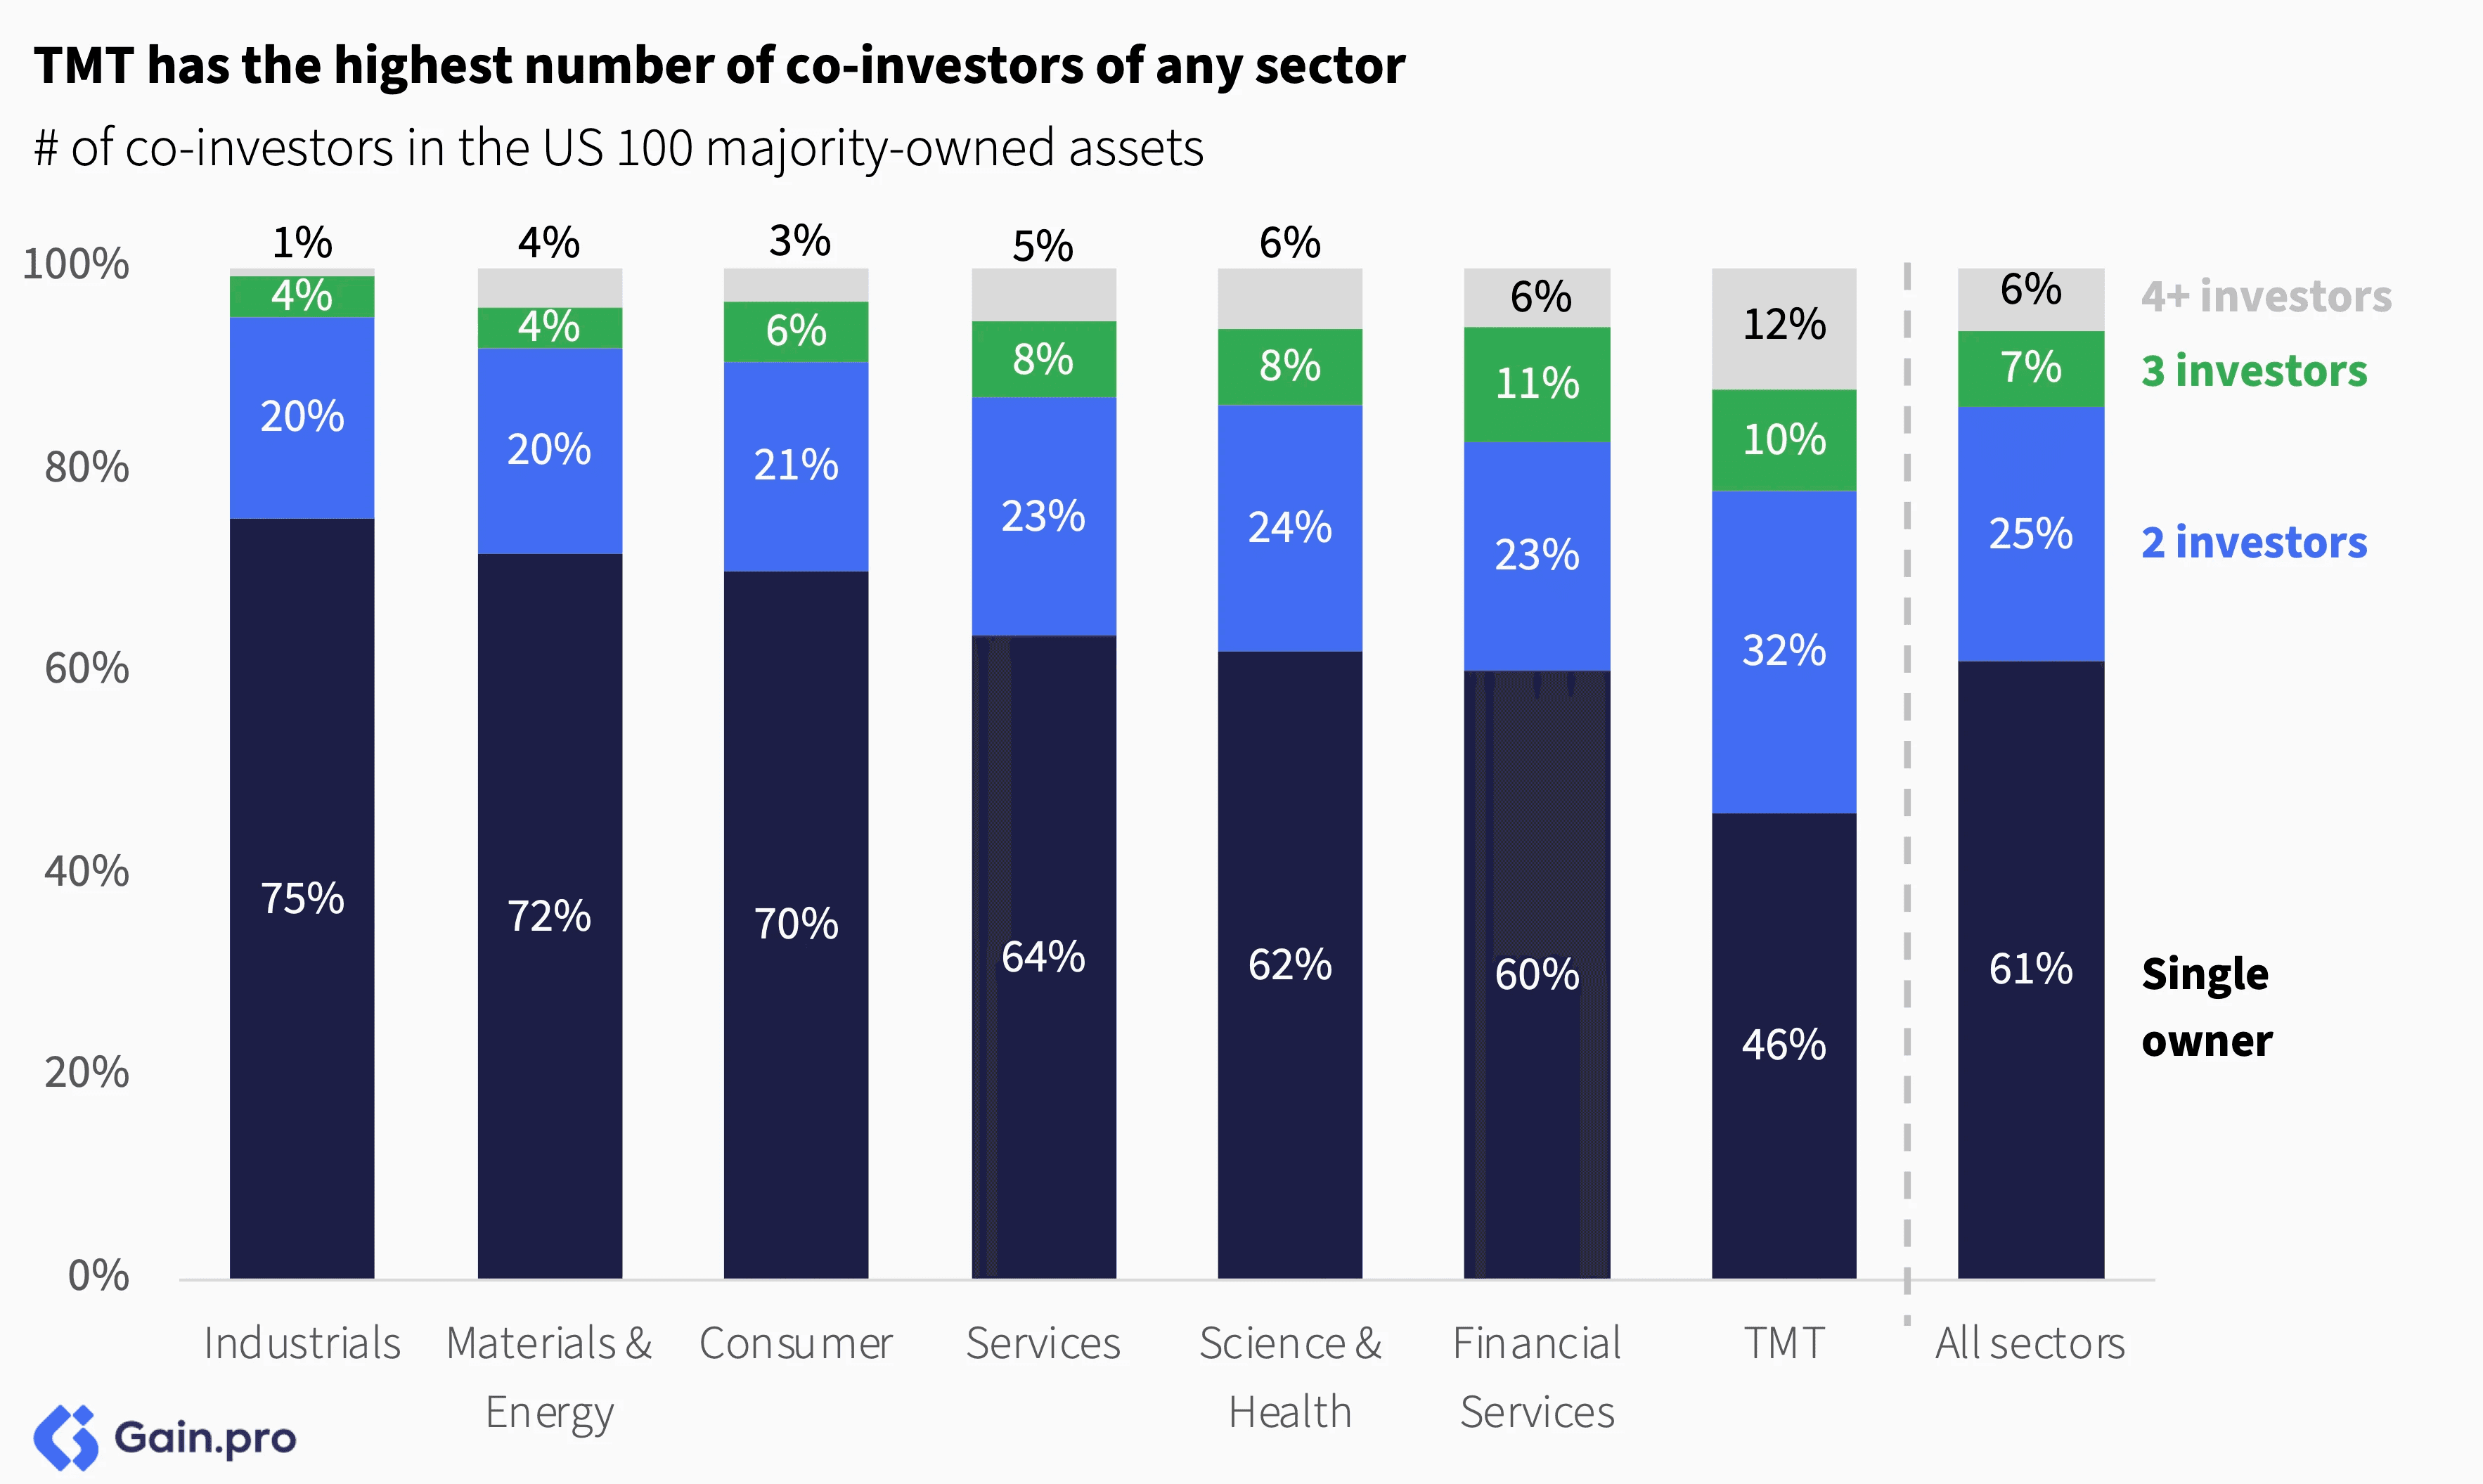
A majority of TMT assets (54%) have at least two co-owners, while 22% have three or more. This is partly because TMT has long attracted VC funding, with early investors from series rounds often retaining shares or reinvesting minority stakes after PE investments. In contrast, sectors like Industrials and Materials & Energy have more concentrated ownership, with over 70% of assets held by a single owner.
Chapter 03: Holding Periods
Overall Trend
Holding periods are top of mind for both GPs and LPs as they prioritize liquidity. They are sitting at record highs in the US. The median US 100 asset that exited in 2024 spent 5.3 years in the portfolio, up from 4.2 years in 2021. 56% of assets that exited in 2024 stayed longer than 5 years in the portfolio, up from 37% in 2020.

Consumer, Science & Health, and Industrials have the highest share of longer-held assets. Over 20% of assets in those sectors haven’t had an ownership transfer in the last 6 years. More broadly, the 2021 vintage year remains the largest, comprising 23% of U.S. PE-owned assets, driven by heightened deal activity during that period.

It’s also too soon to draw any conclusions about exits from the high entry-valuation cohorts of 2021 and 2022. Typically, exits only ramp up in year 4, making 2025 and 2026 pivotal years to watch for those exits to come through.

Chapter 04: Regional Insights
Top Investors
Blackstone stands out as the largest investor across US regions, ranking #1 in the Midwest, West, and South. In the Northeast, Bain Capital — headquartered in the region — takes the top spot, with Blackstone following at #2. Also worth highlighting is the strong and expected presence of Thoma Bravo and Silver Lake in the West, given their tech-focused investments.

By State
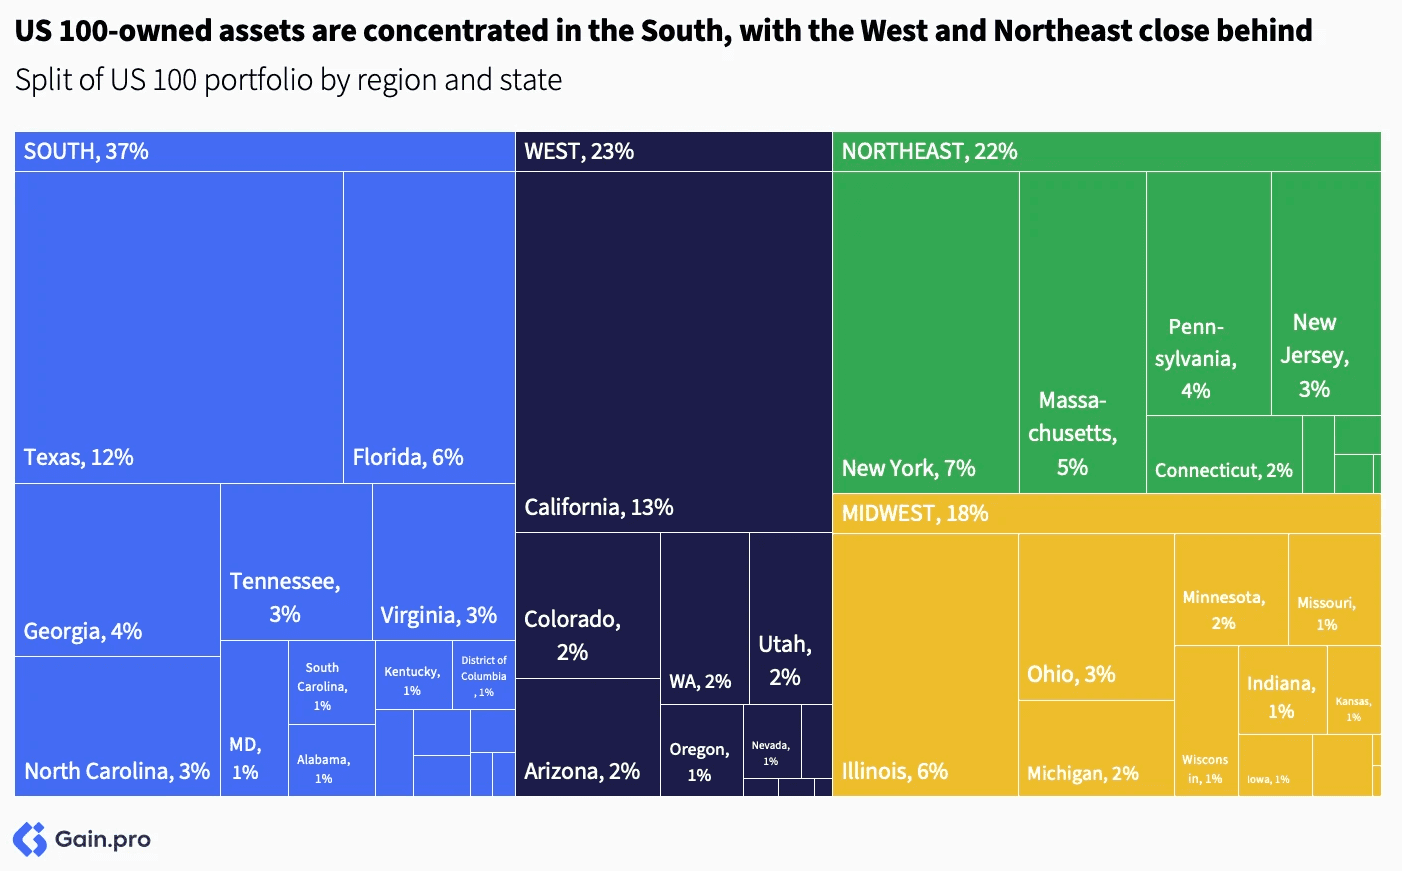
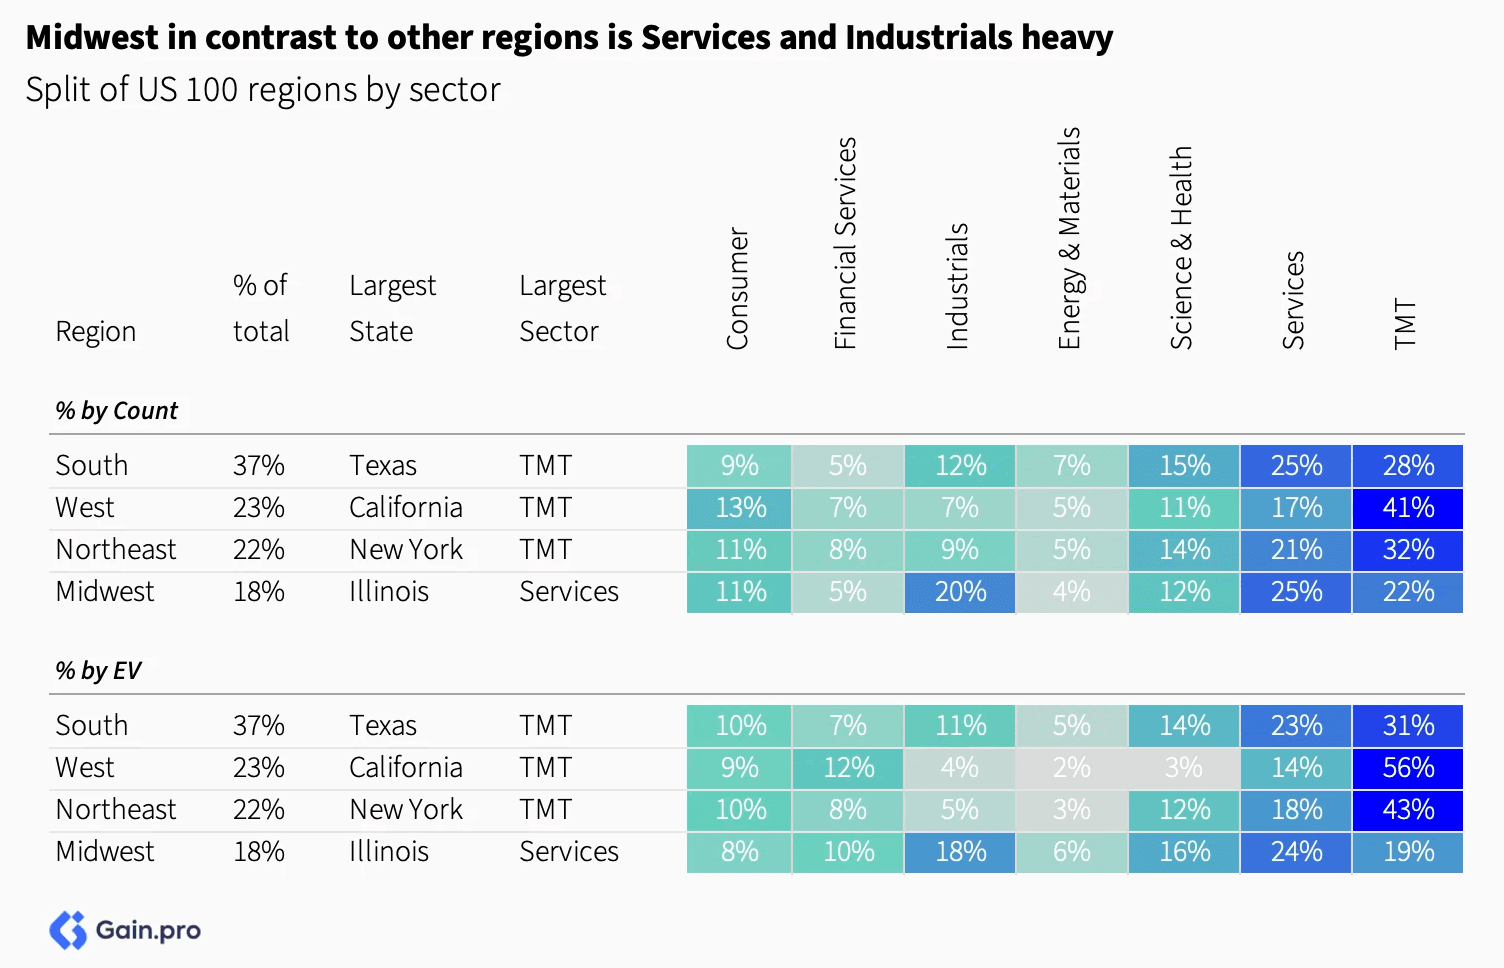
The South holds the largest share of US 100-owned assets, supported by economic hubs like Texas and Florida. California, which contributes 13% — the most of any state — significantly boosts the West’s share. The Midwest has a smaller portion of PE-backed assets, with Illinois as its largest state, while New York dominates in the Northeast. Overall, U.S. 100 assets are highly concentrated, with the top four states holding approximately 40% of PE assets and the top 16 accounting for 80%.
TMT is the largest sector in three of the four US regions, with the Midwest as the exception, where Services and Industrials have a strong presence. In the West, 41% of the US 100 assets and 56% of EV are in TMT, far surpassing other sectors.
TMT and Services alternate as the largest sector in each of the top states, except for Ohio, where Industrials ranks second. Notably, Energy & Materials has a stronger presence in Texas, while Consumer holdings are more prominent in New York and California.

Chapter 05: Portfolio Insights
In this section, we explore the investment portfolios of the top 30 PE investors in the US, analyzing key metrics such as EBITDA range, growth rates, buy-and-build activity, holding periods, and the sector/regional makeup of their US investments.
By Size
Hellman & Friedman (H&F), Clayton, Dubilier & Rice (CD&R), Veritas Capital, and GIC stand out for their exceptionally high median portfolio EBITDA figures. Both H&F and CD&R do larger but fewer deals. Meanwhile, GIC invests mostly in minority stakes.

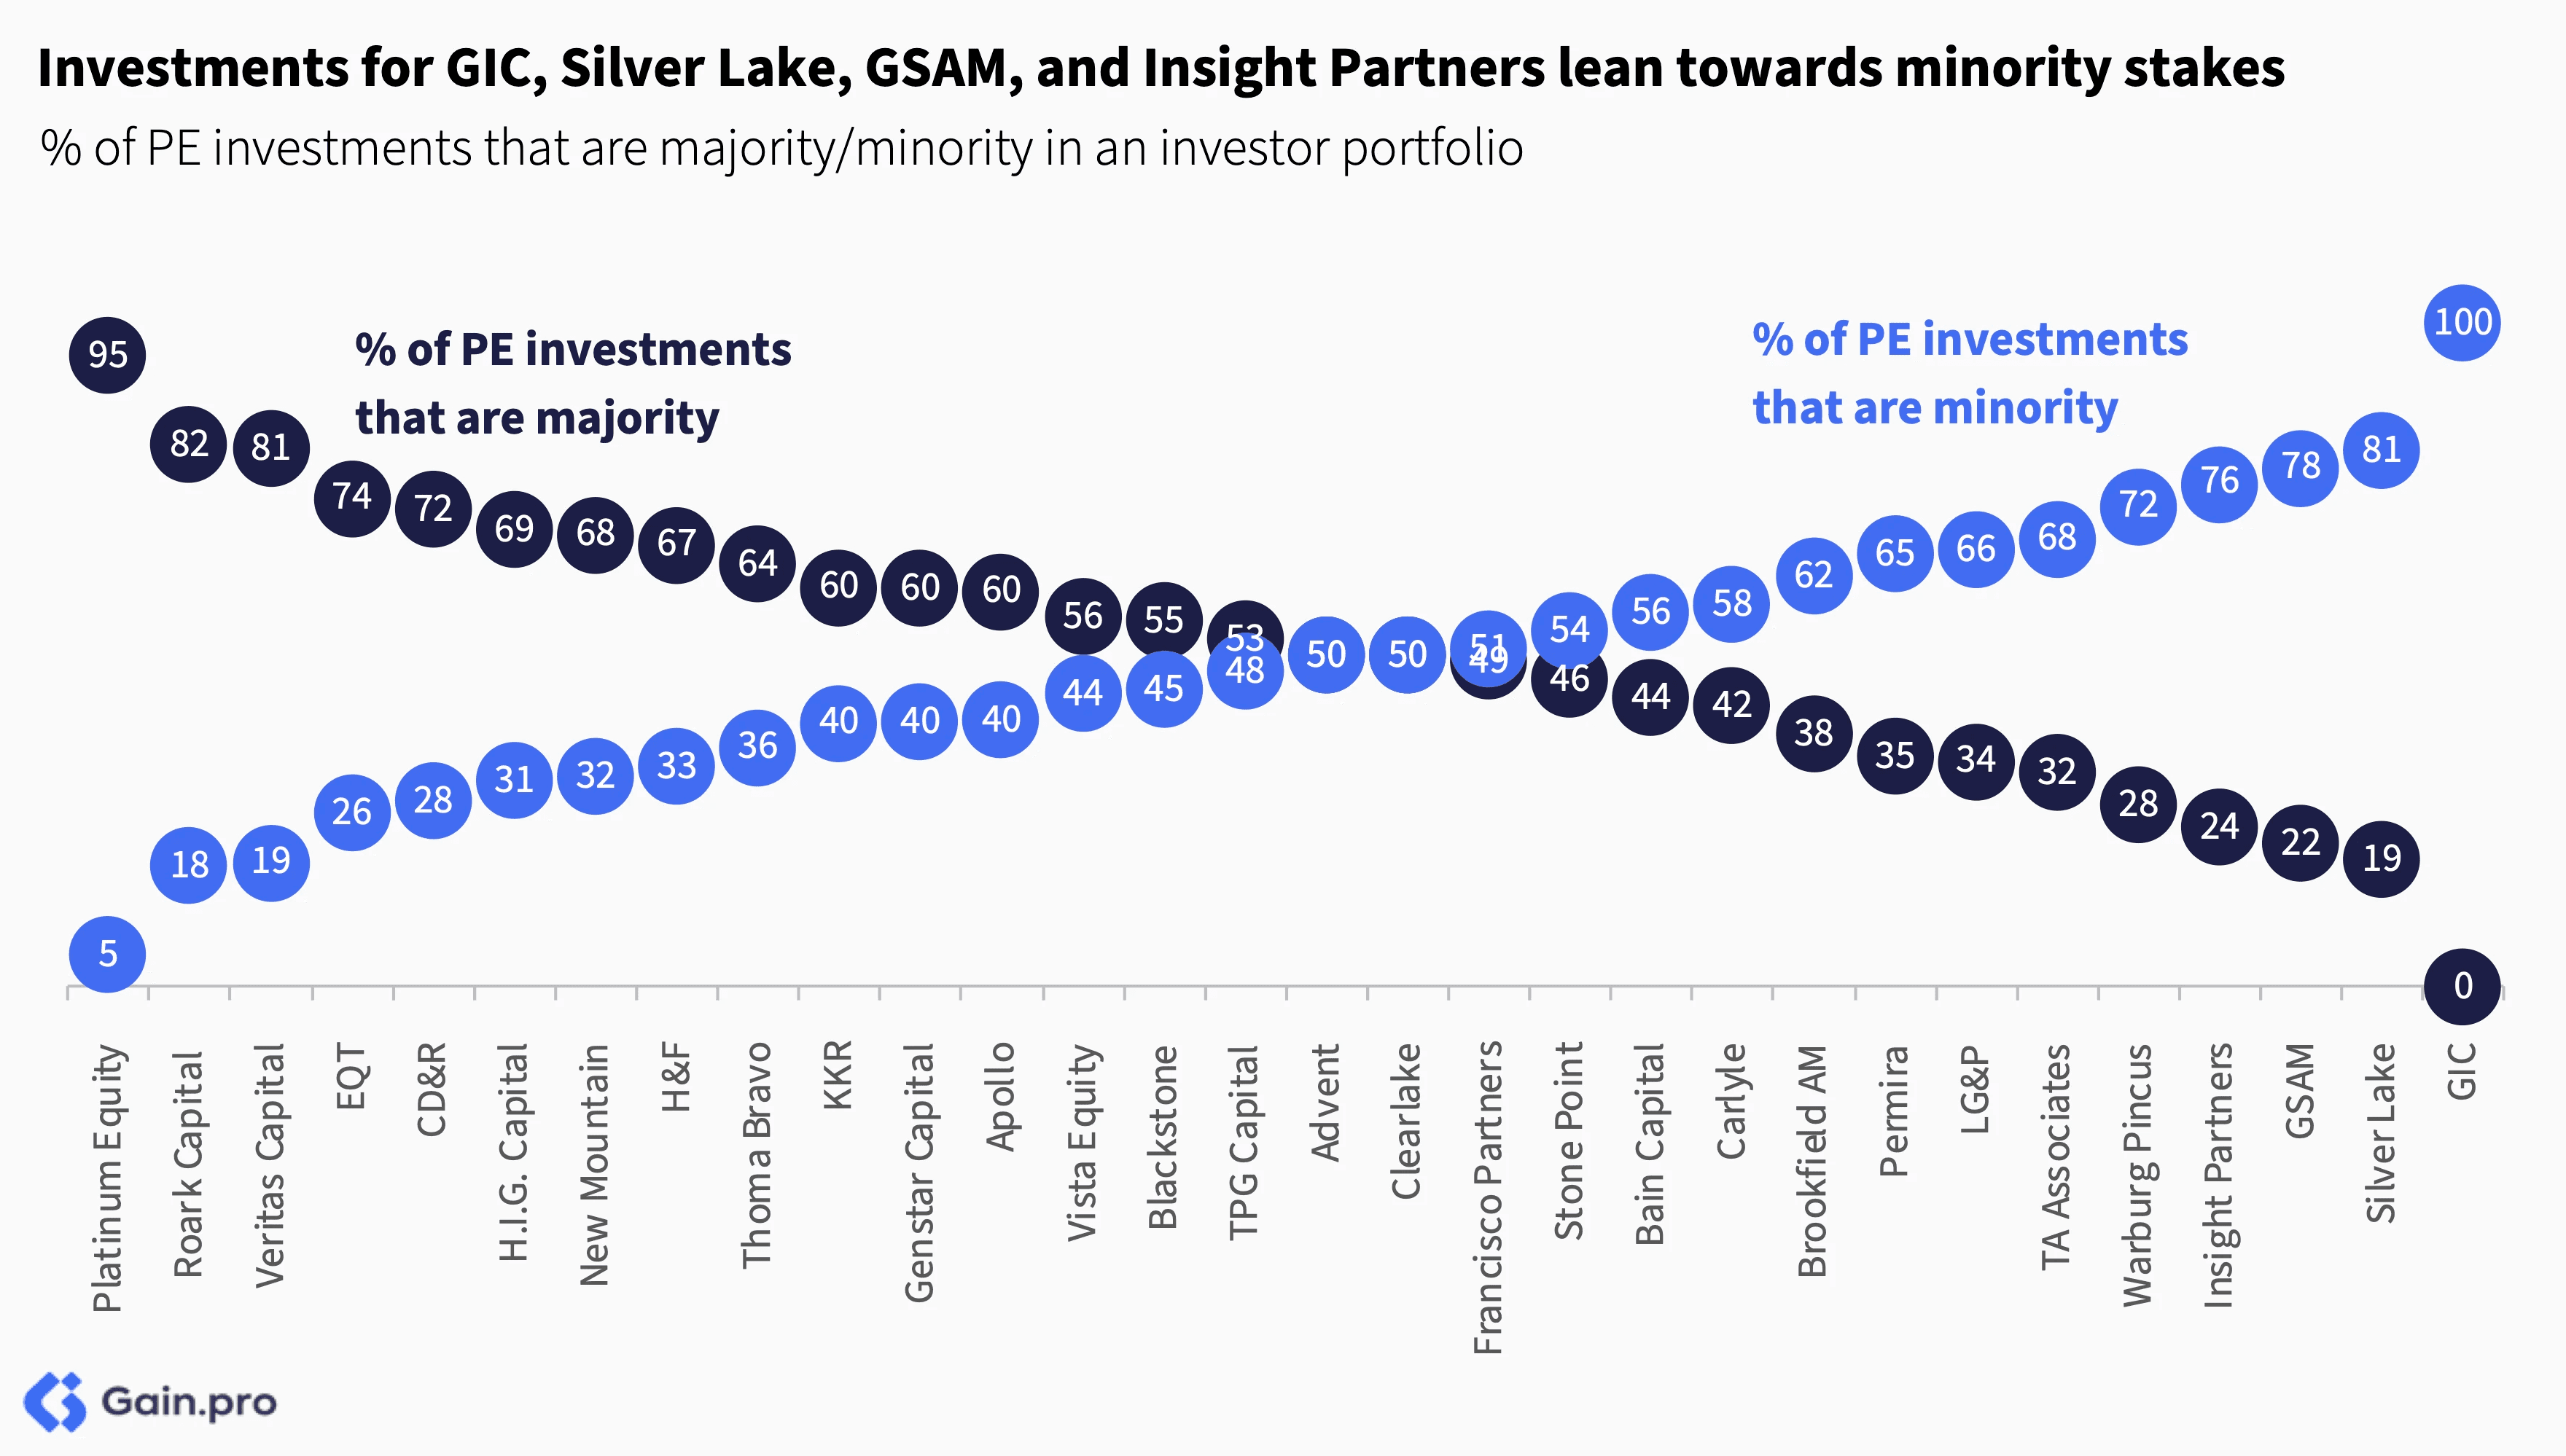
The preference for minority versus majority stakes differs among the top investors. Investments for GIC, Silver Lake, GSAM, and Insight Partners lean towards minority stakes, whereas Platinum Equity, Roark Capital, and Veritas Capital typically default to majority deals.
GSAM, Insight Partners, TA Associates, and Francisco Partners have relatively smaller ticket sizes. They allocate over 45% of their portfolios to fast-growing TMT businesses. In contrast, H&F, Advent, and Veritas Capital target larger businesses with substantial investments.

H.I.G. Capital, Bain Capital, and Stone Point Capital emerge as leading acquirers of family/founder-owned businesses, while Apollo, Veritas Capital, Thoma Bravo, GIC, H&F, and CD&R stand out for their focus on public-to-private transactions. Yet, across the board, sponsor-to-sponsor remains the most popular entry type.

By Sector & Region
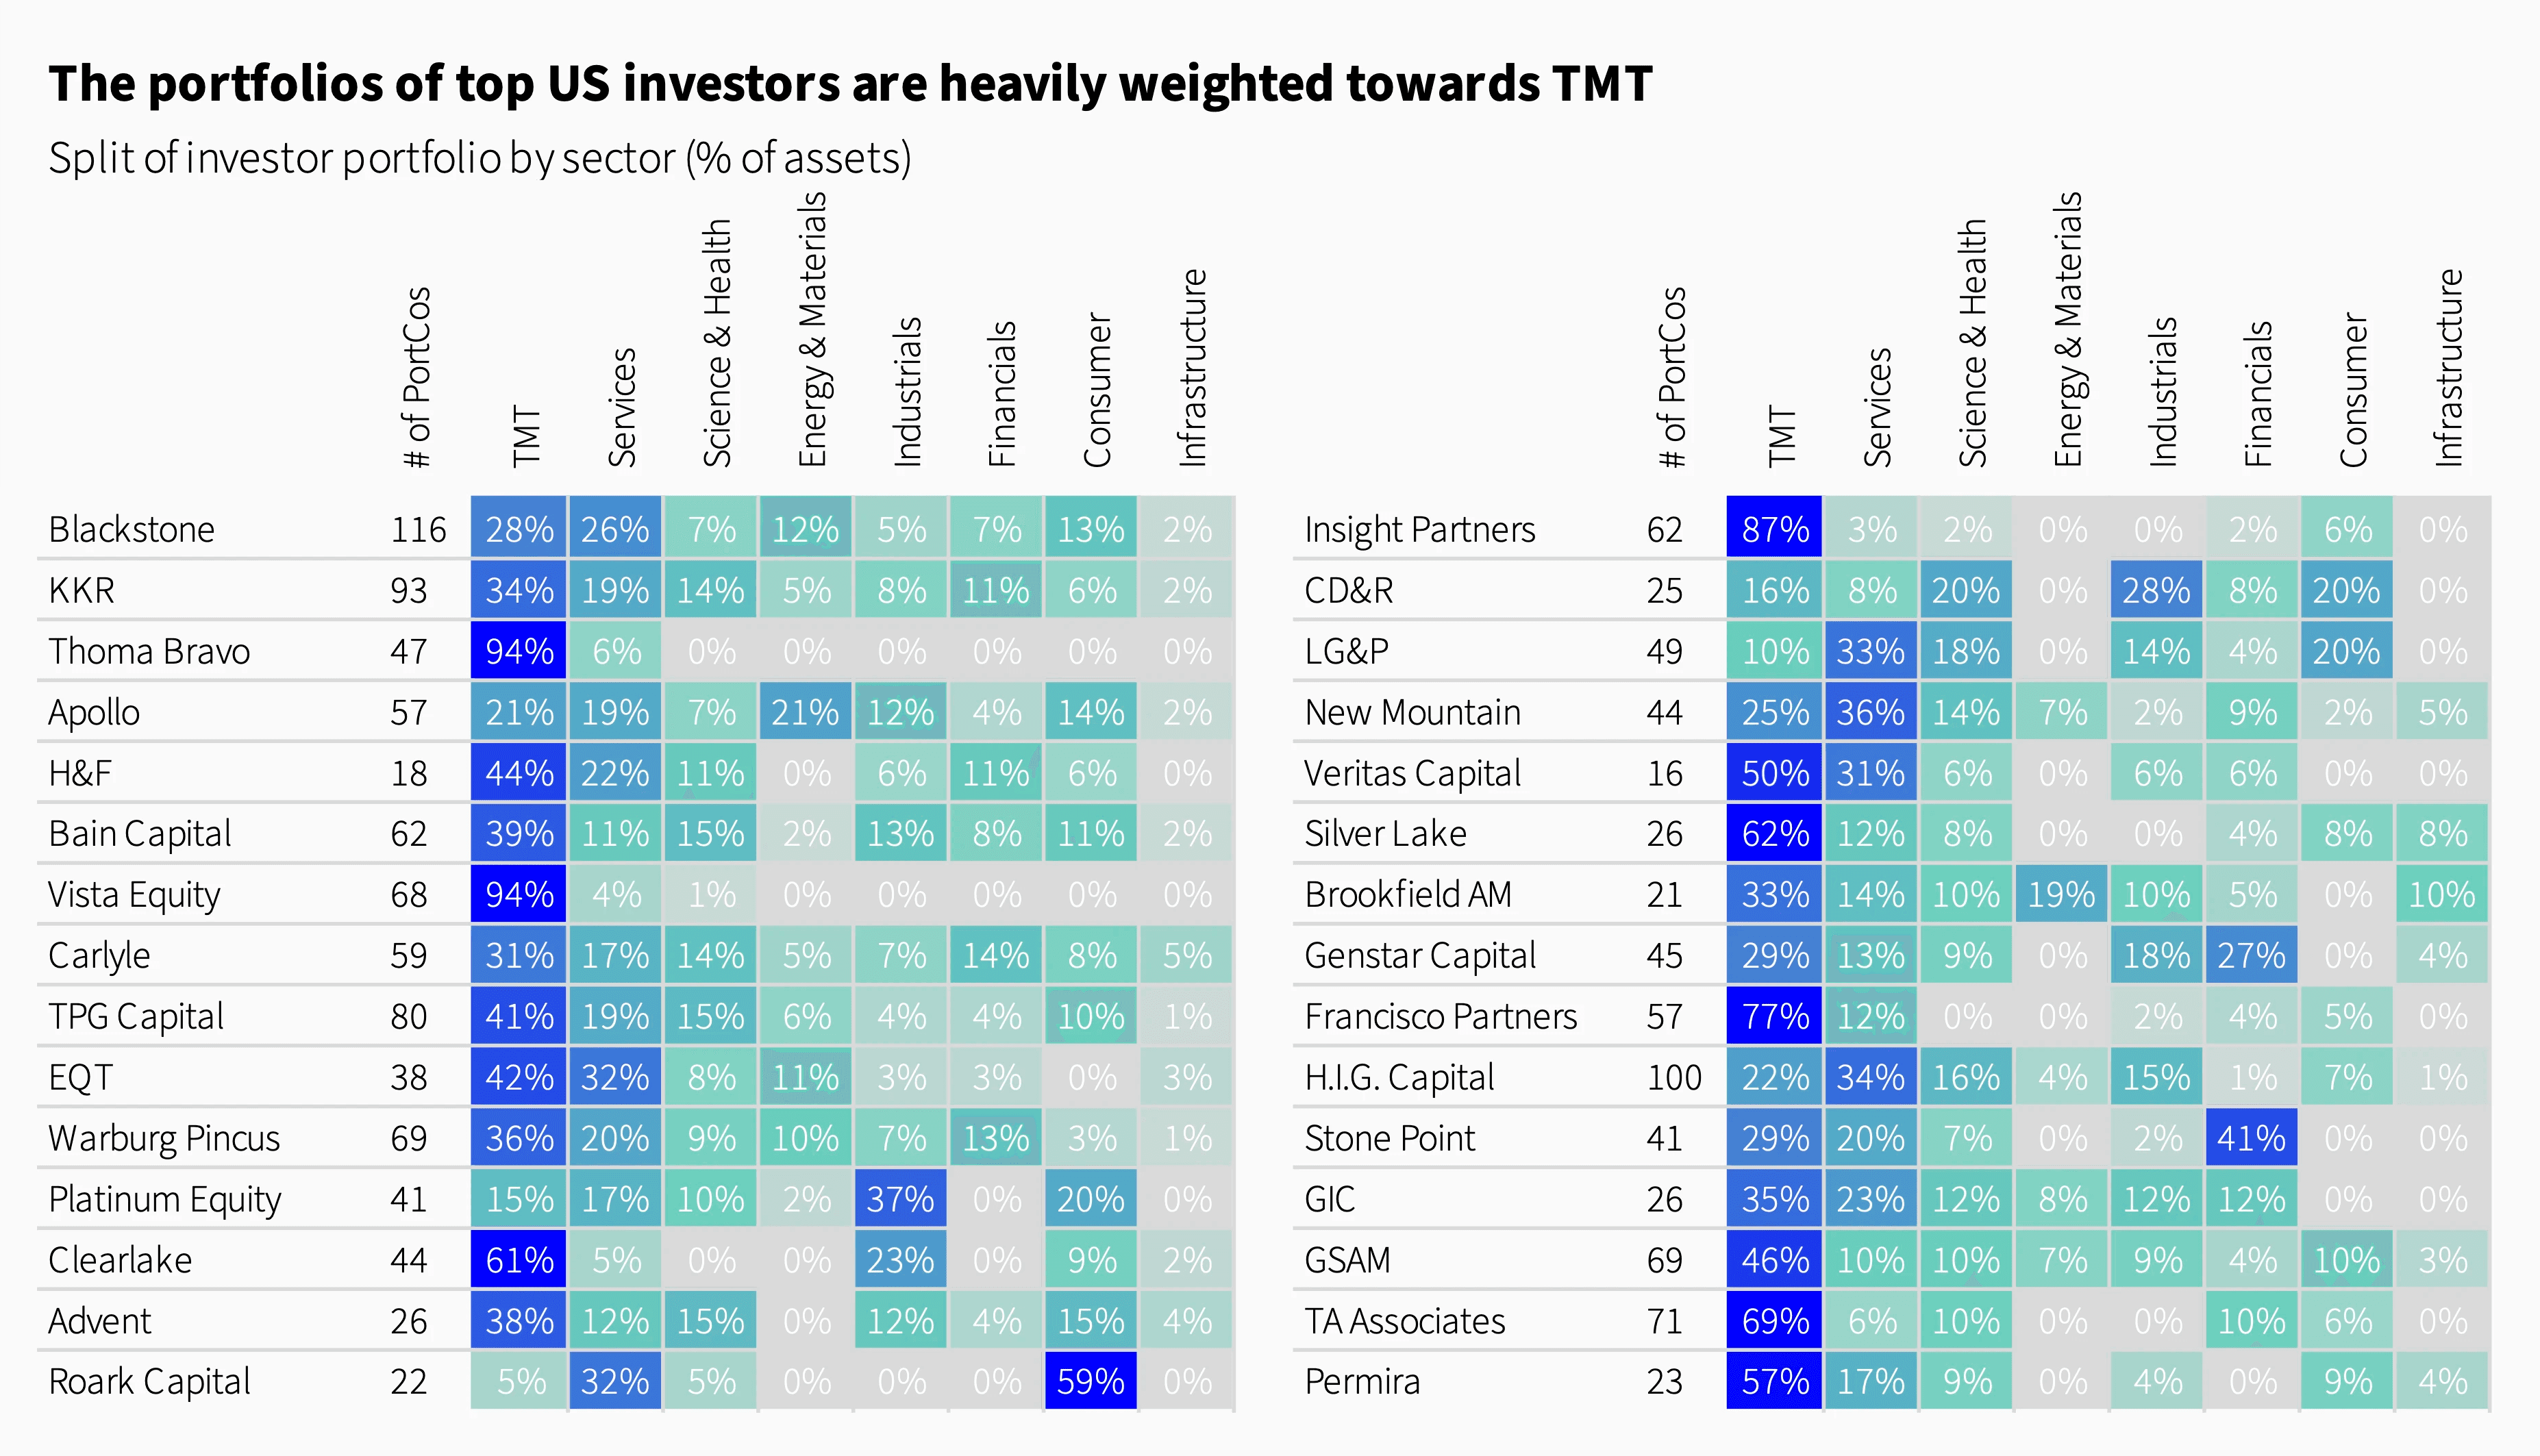
The portfolios of top US investors are heavily weighted towards TMT. Thoma Bravo, Vista Equity Partners, Clearlake, Insight Partners, Francisco Partners, Silver Lake, and TA Associates all have over 60% of their portfolios in TMT assets. Other notable sector specialists include Platinum Equity, with 37% of its portfolio in Industrials; Roark Capital, with 59% in Consumer; and Stone Point Capital, with 41% in Financial Services.
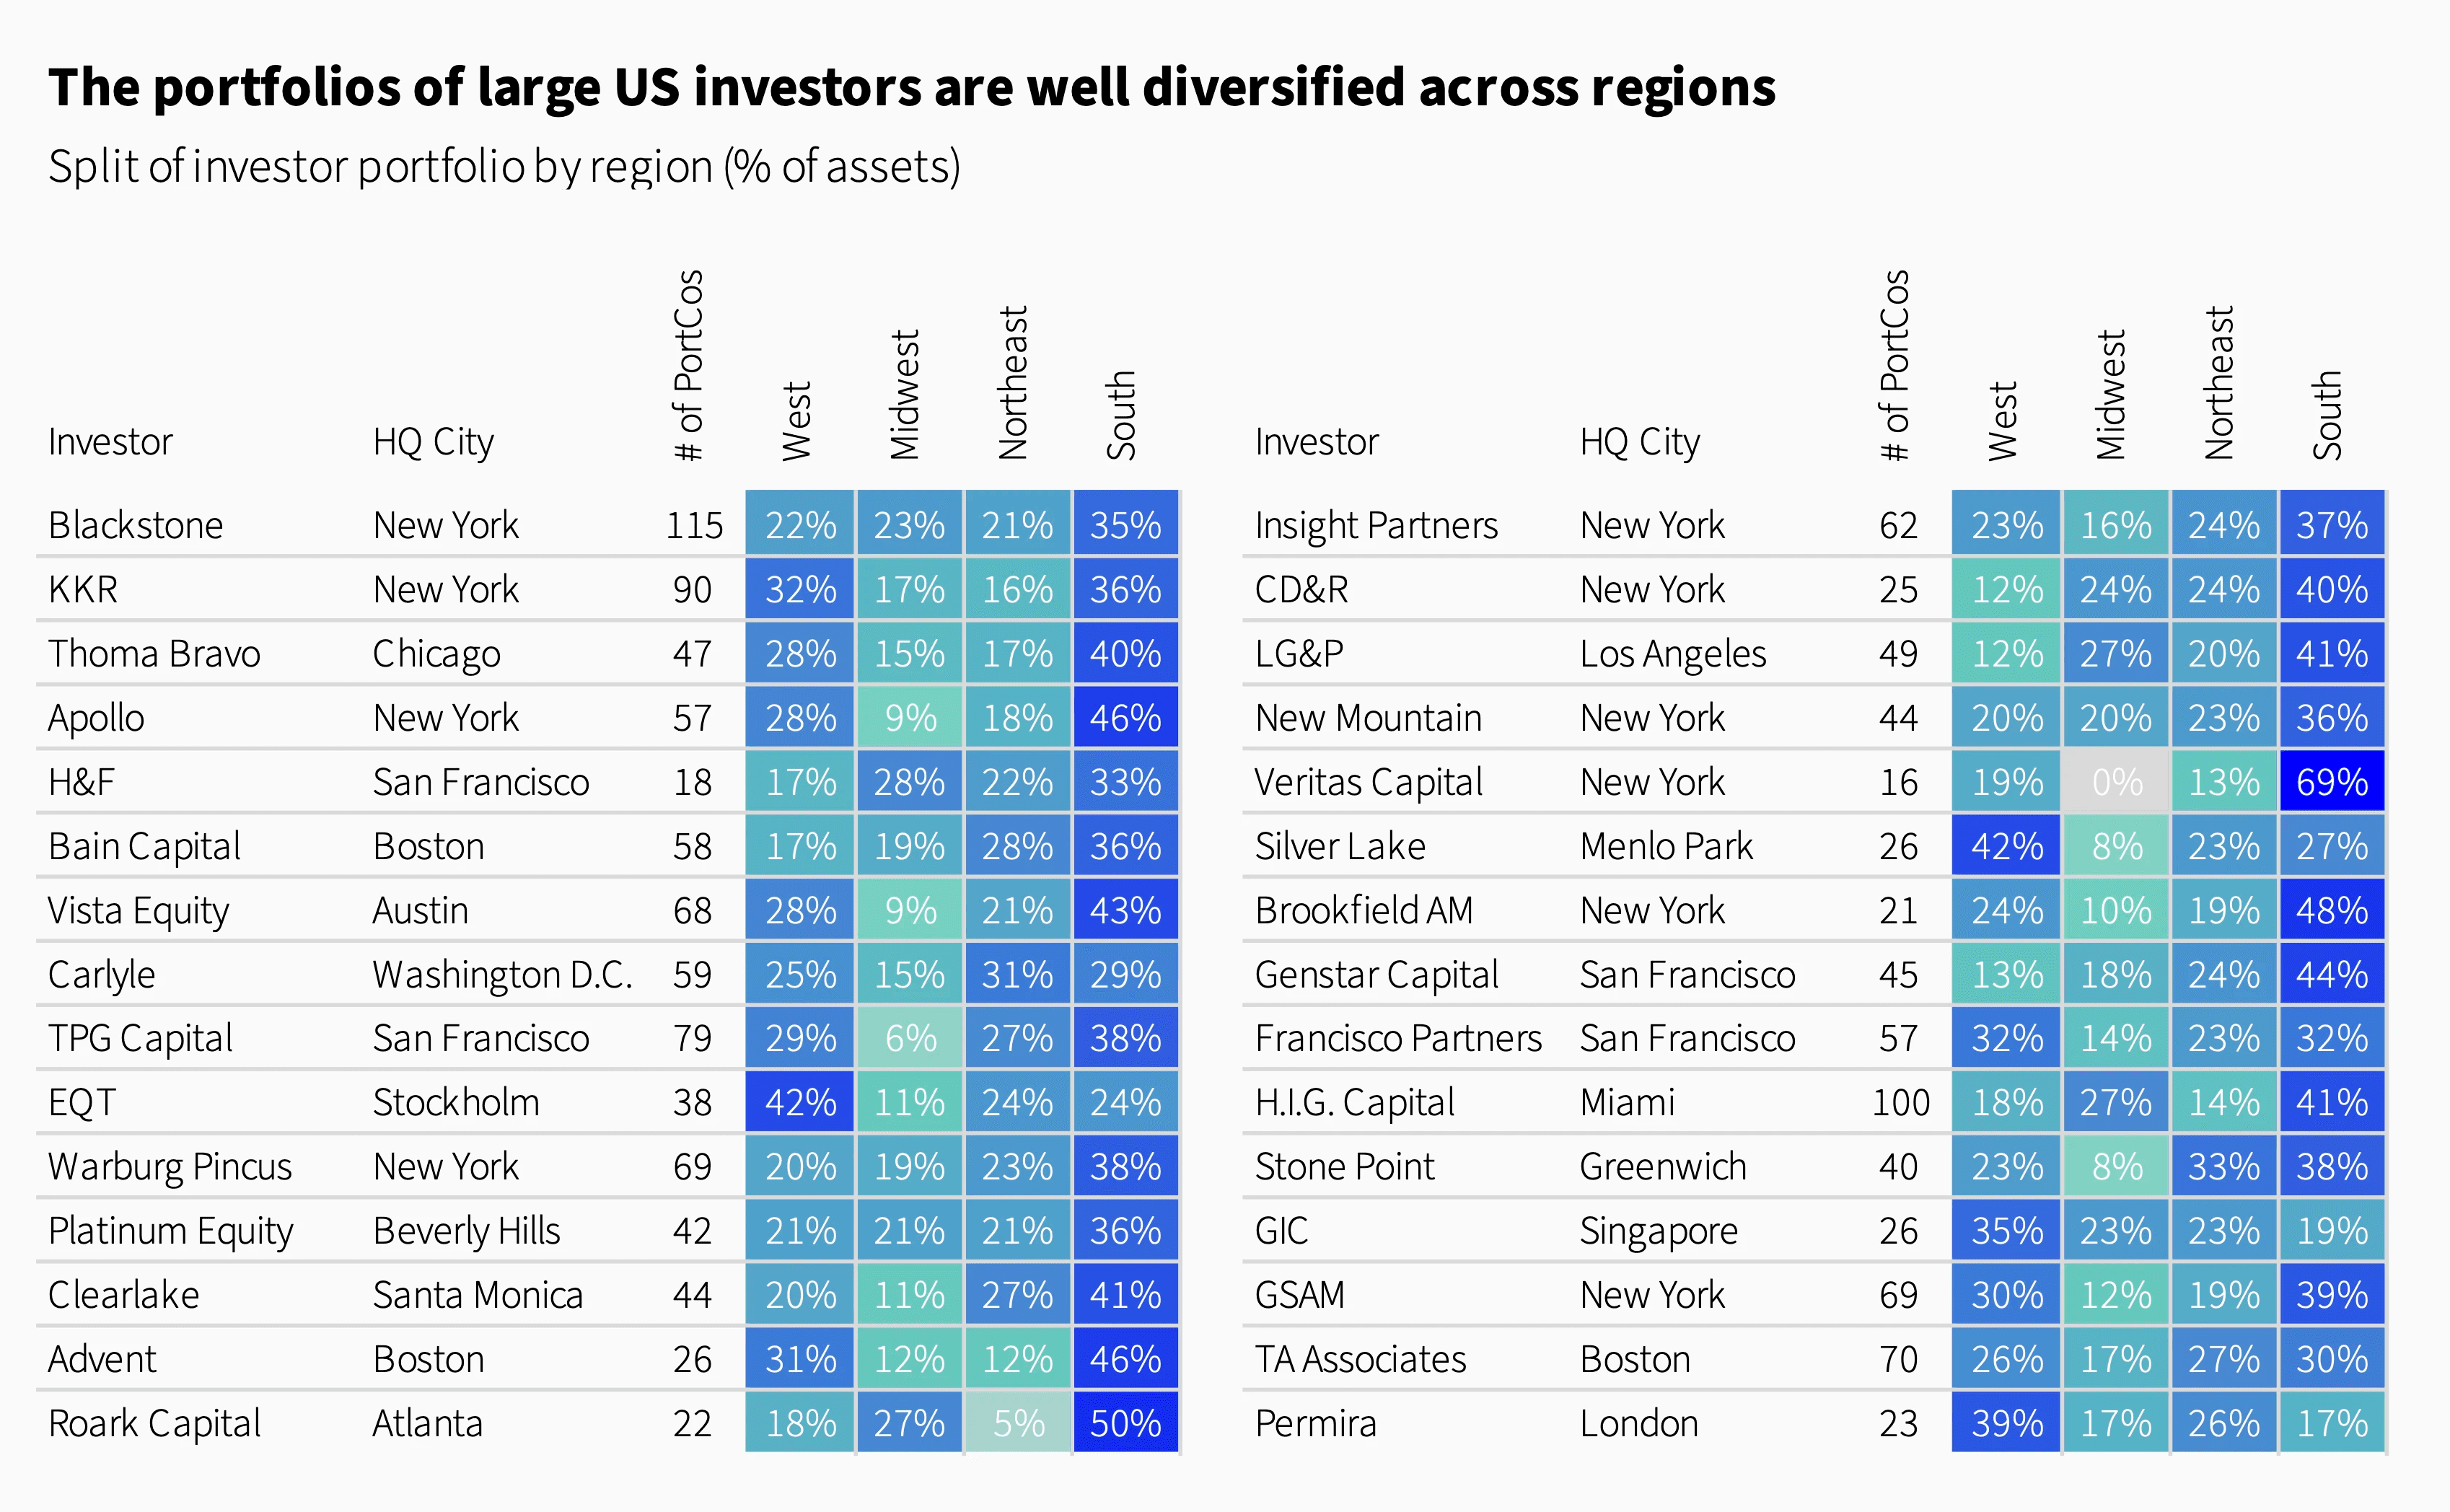
The portfolios of large US investors are well diversified across regions. This is especially visible when looking at the portfolio of Blackstone, KKR, H&F or Bain Capital. However, some regional specialists stand out — Veritas Capital, with 69% of its portfolio in the South and Silver Lake with 42% in the West.
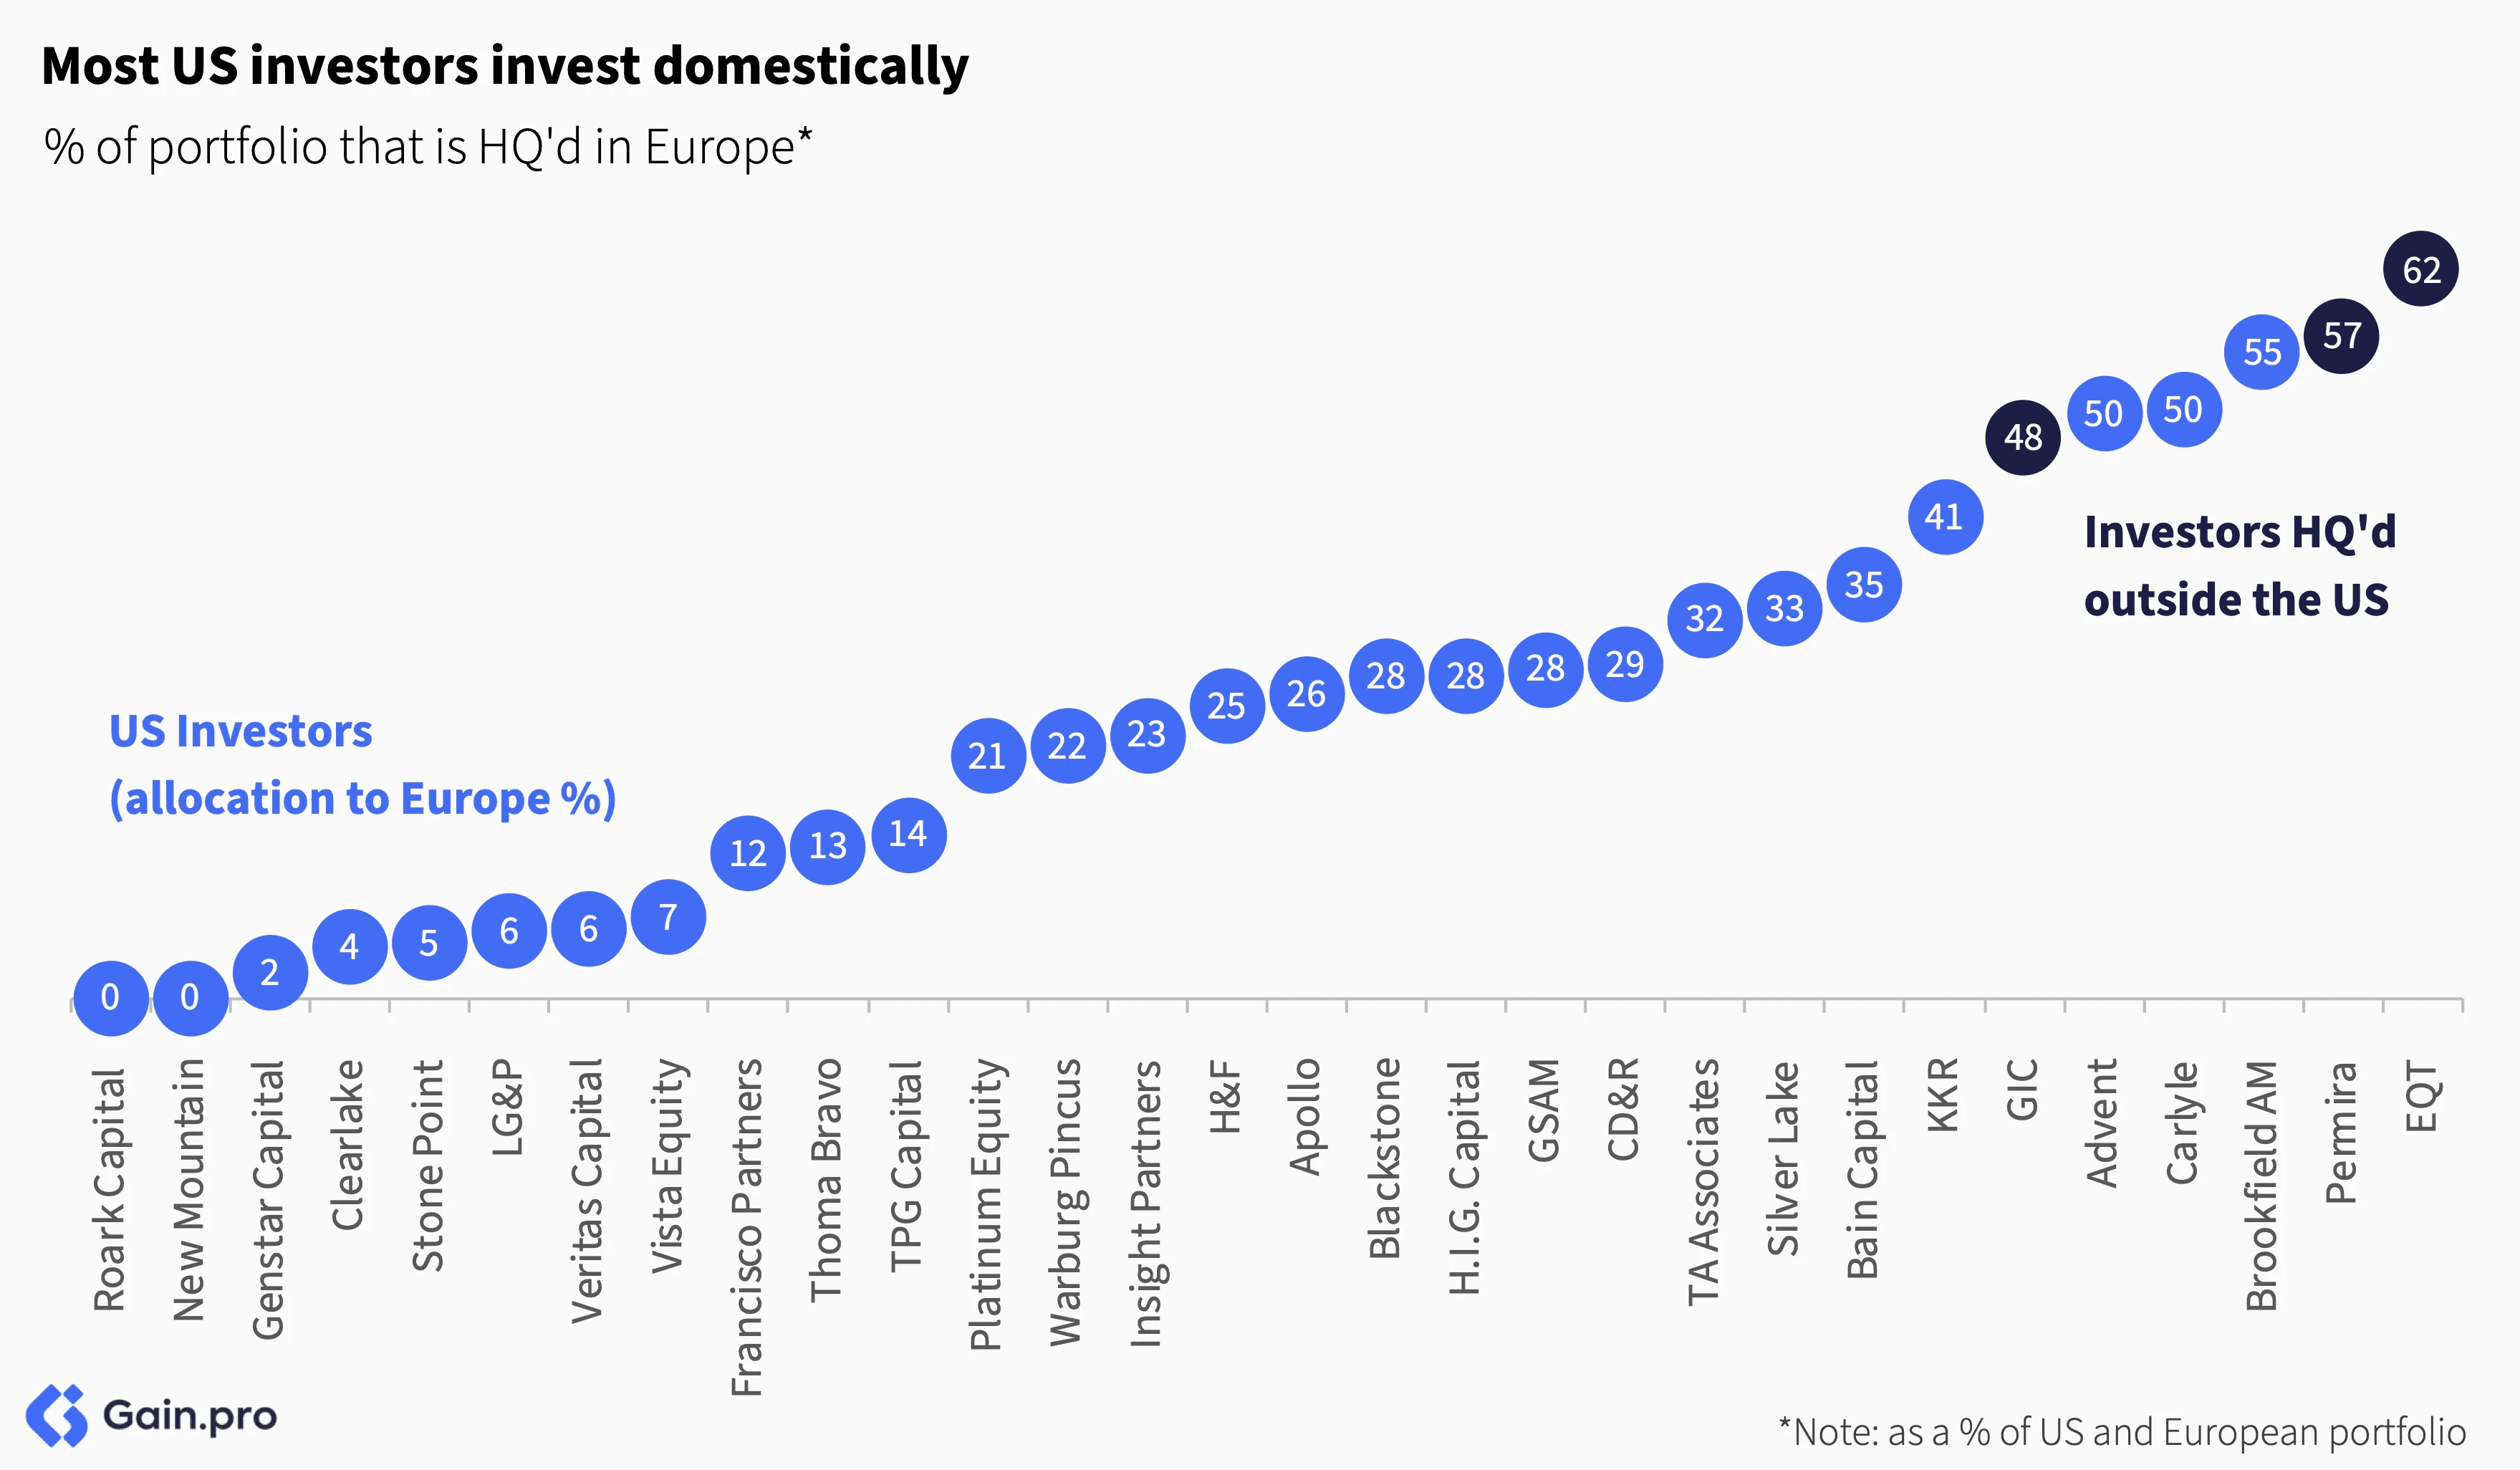
The majority of US investors concentrate on domestic markets. Only Advent, Carlyle, Brookfield, and KKR have more than 40% of their portfolios in Europe. However, more recently, North American investors have been showing increasing interest in the European markets.
Holding Periods
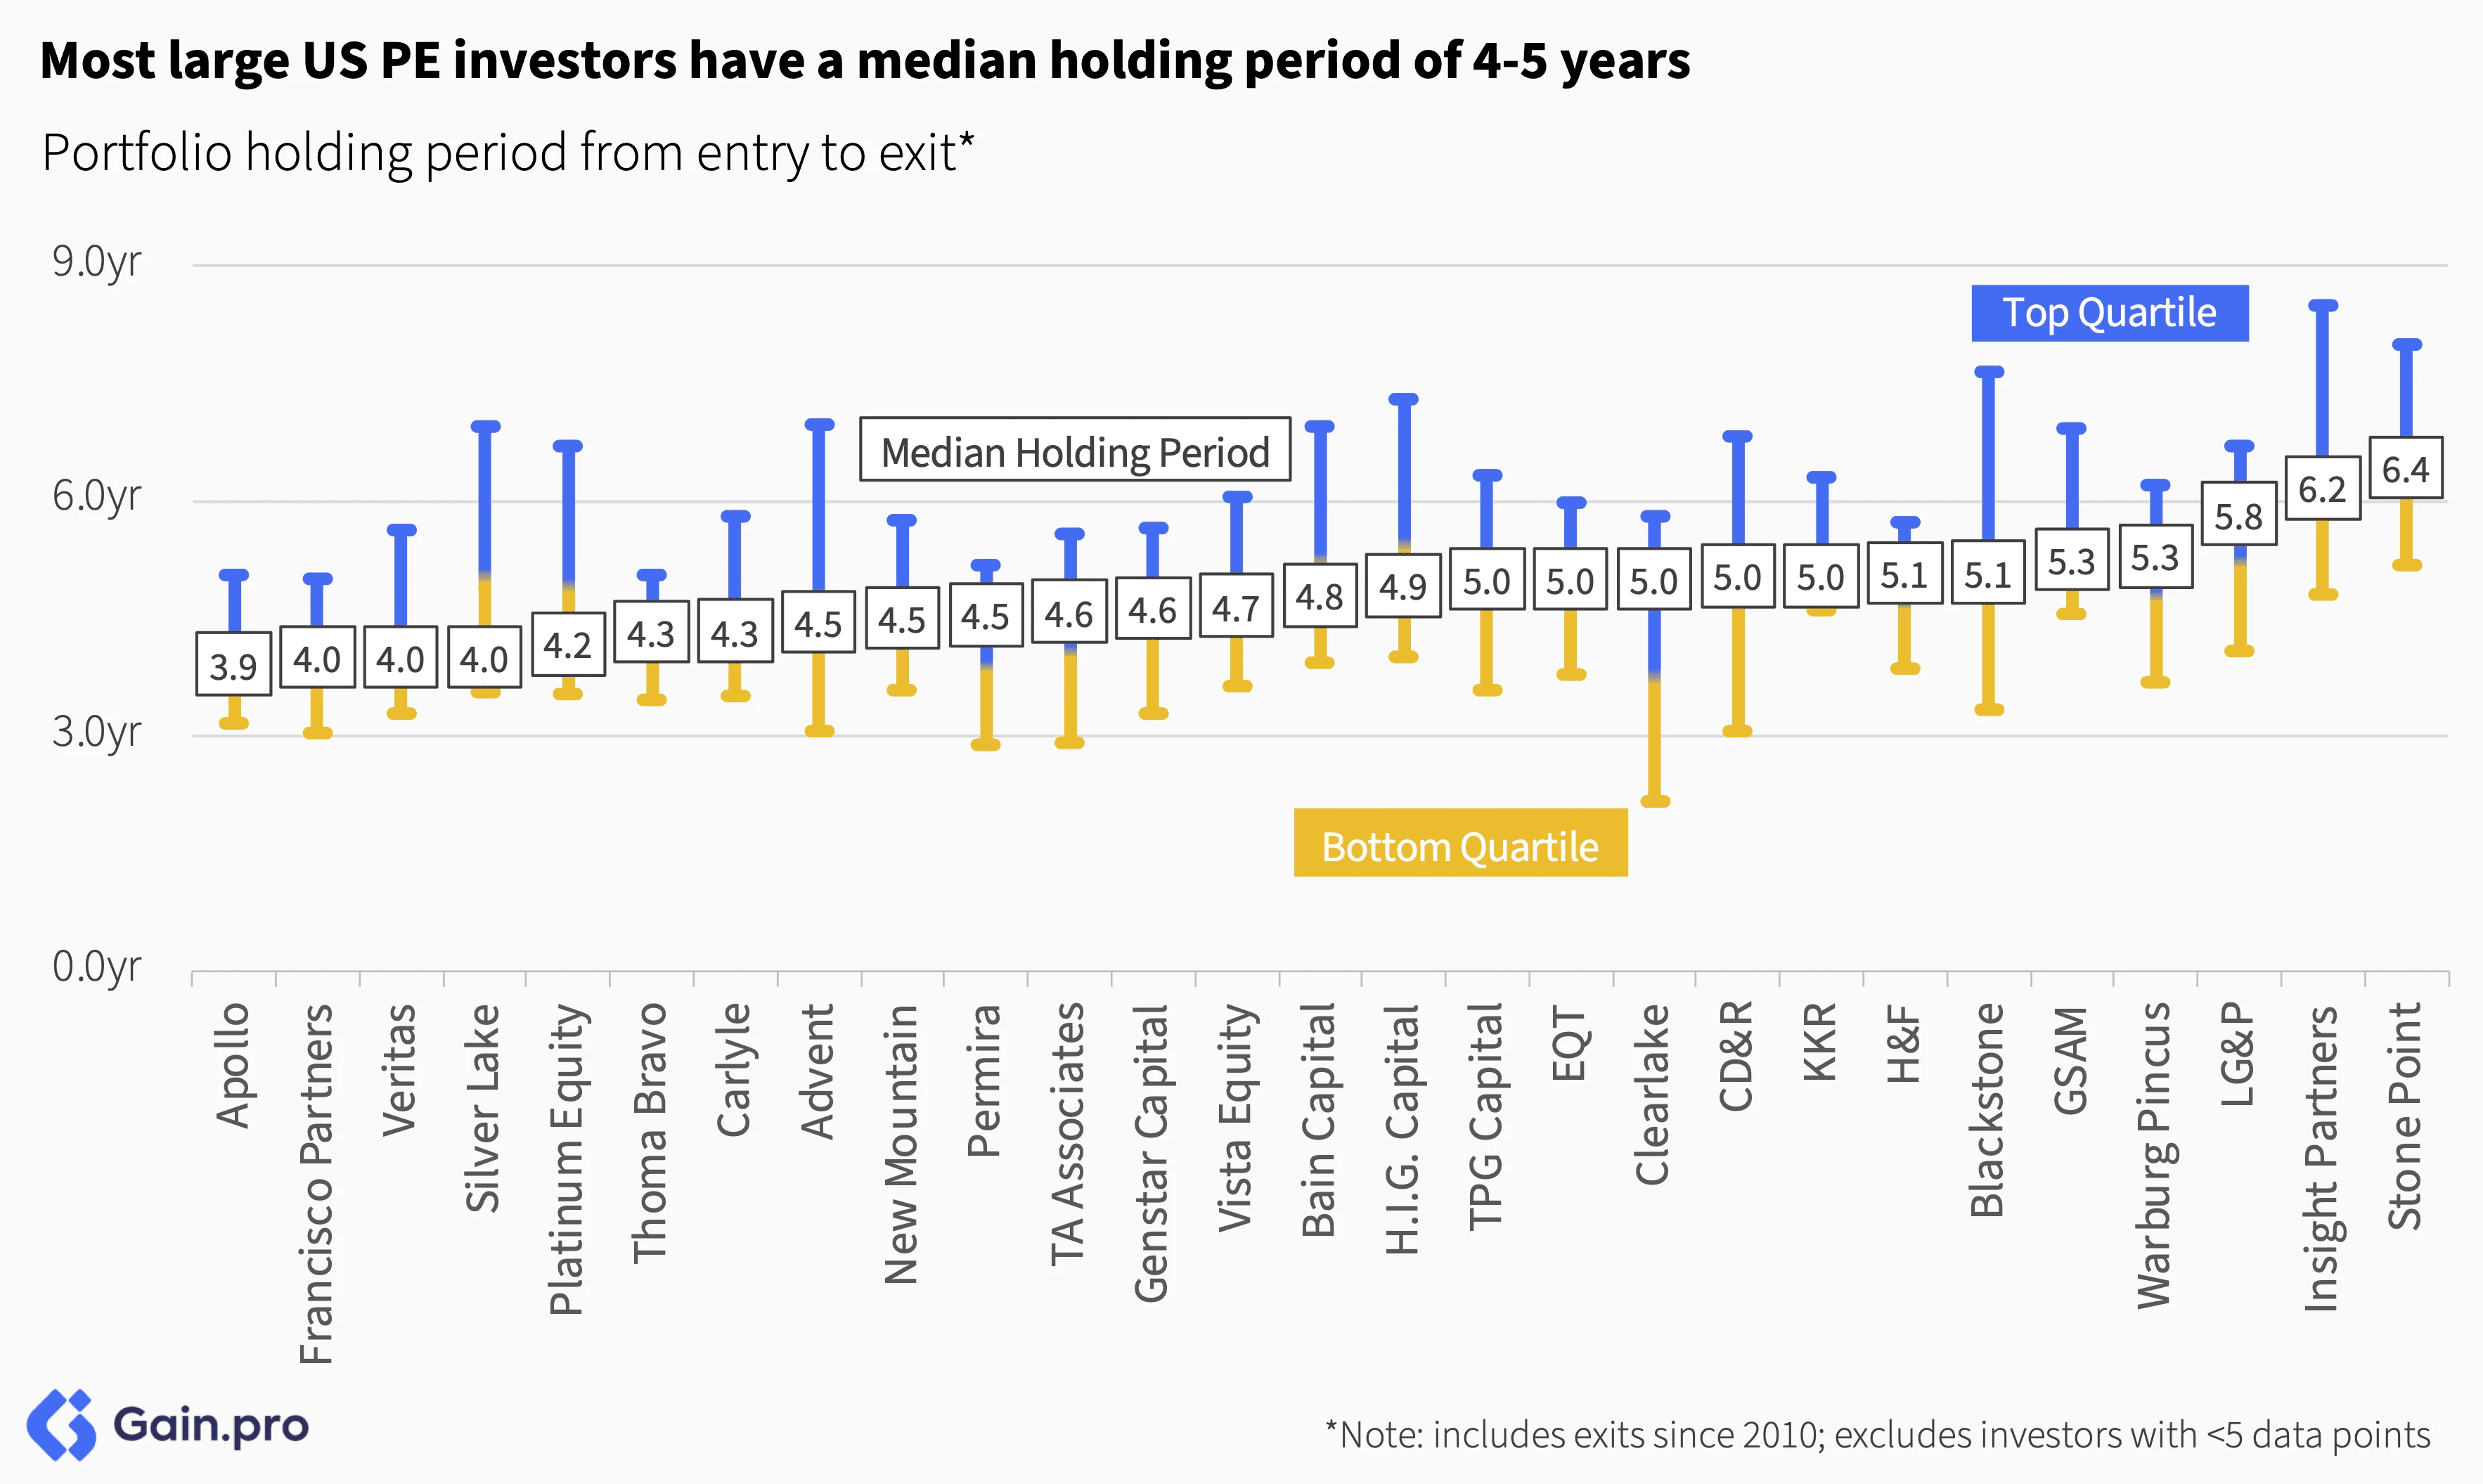
Most large US PE investors have a median holding period of 4-5 years, though Stone Point, Insight Partners, and Leonard Green & Partners tend to hold investments longer, averaging about 6 years.
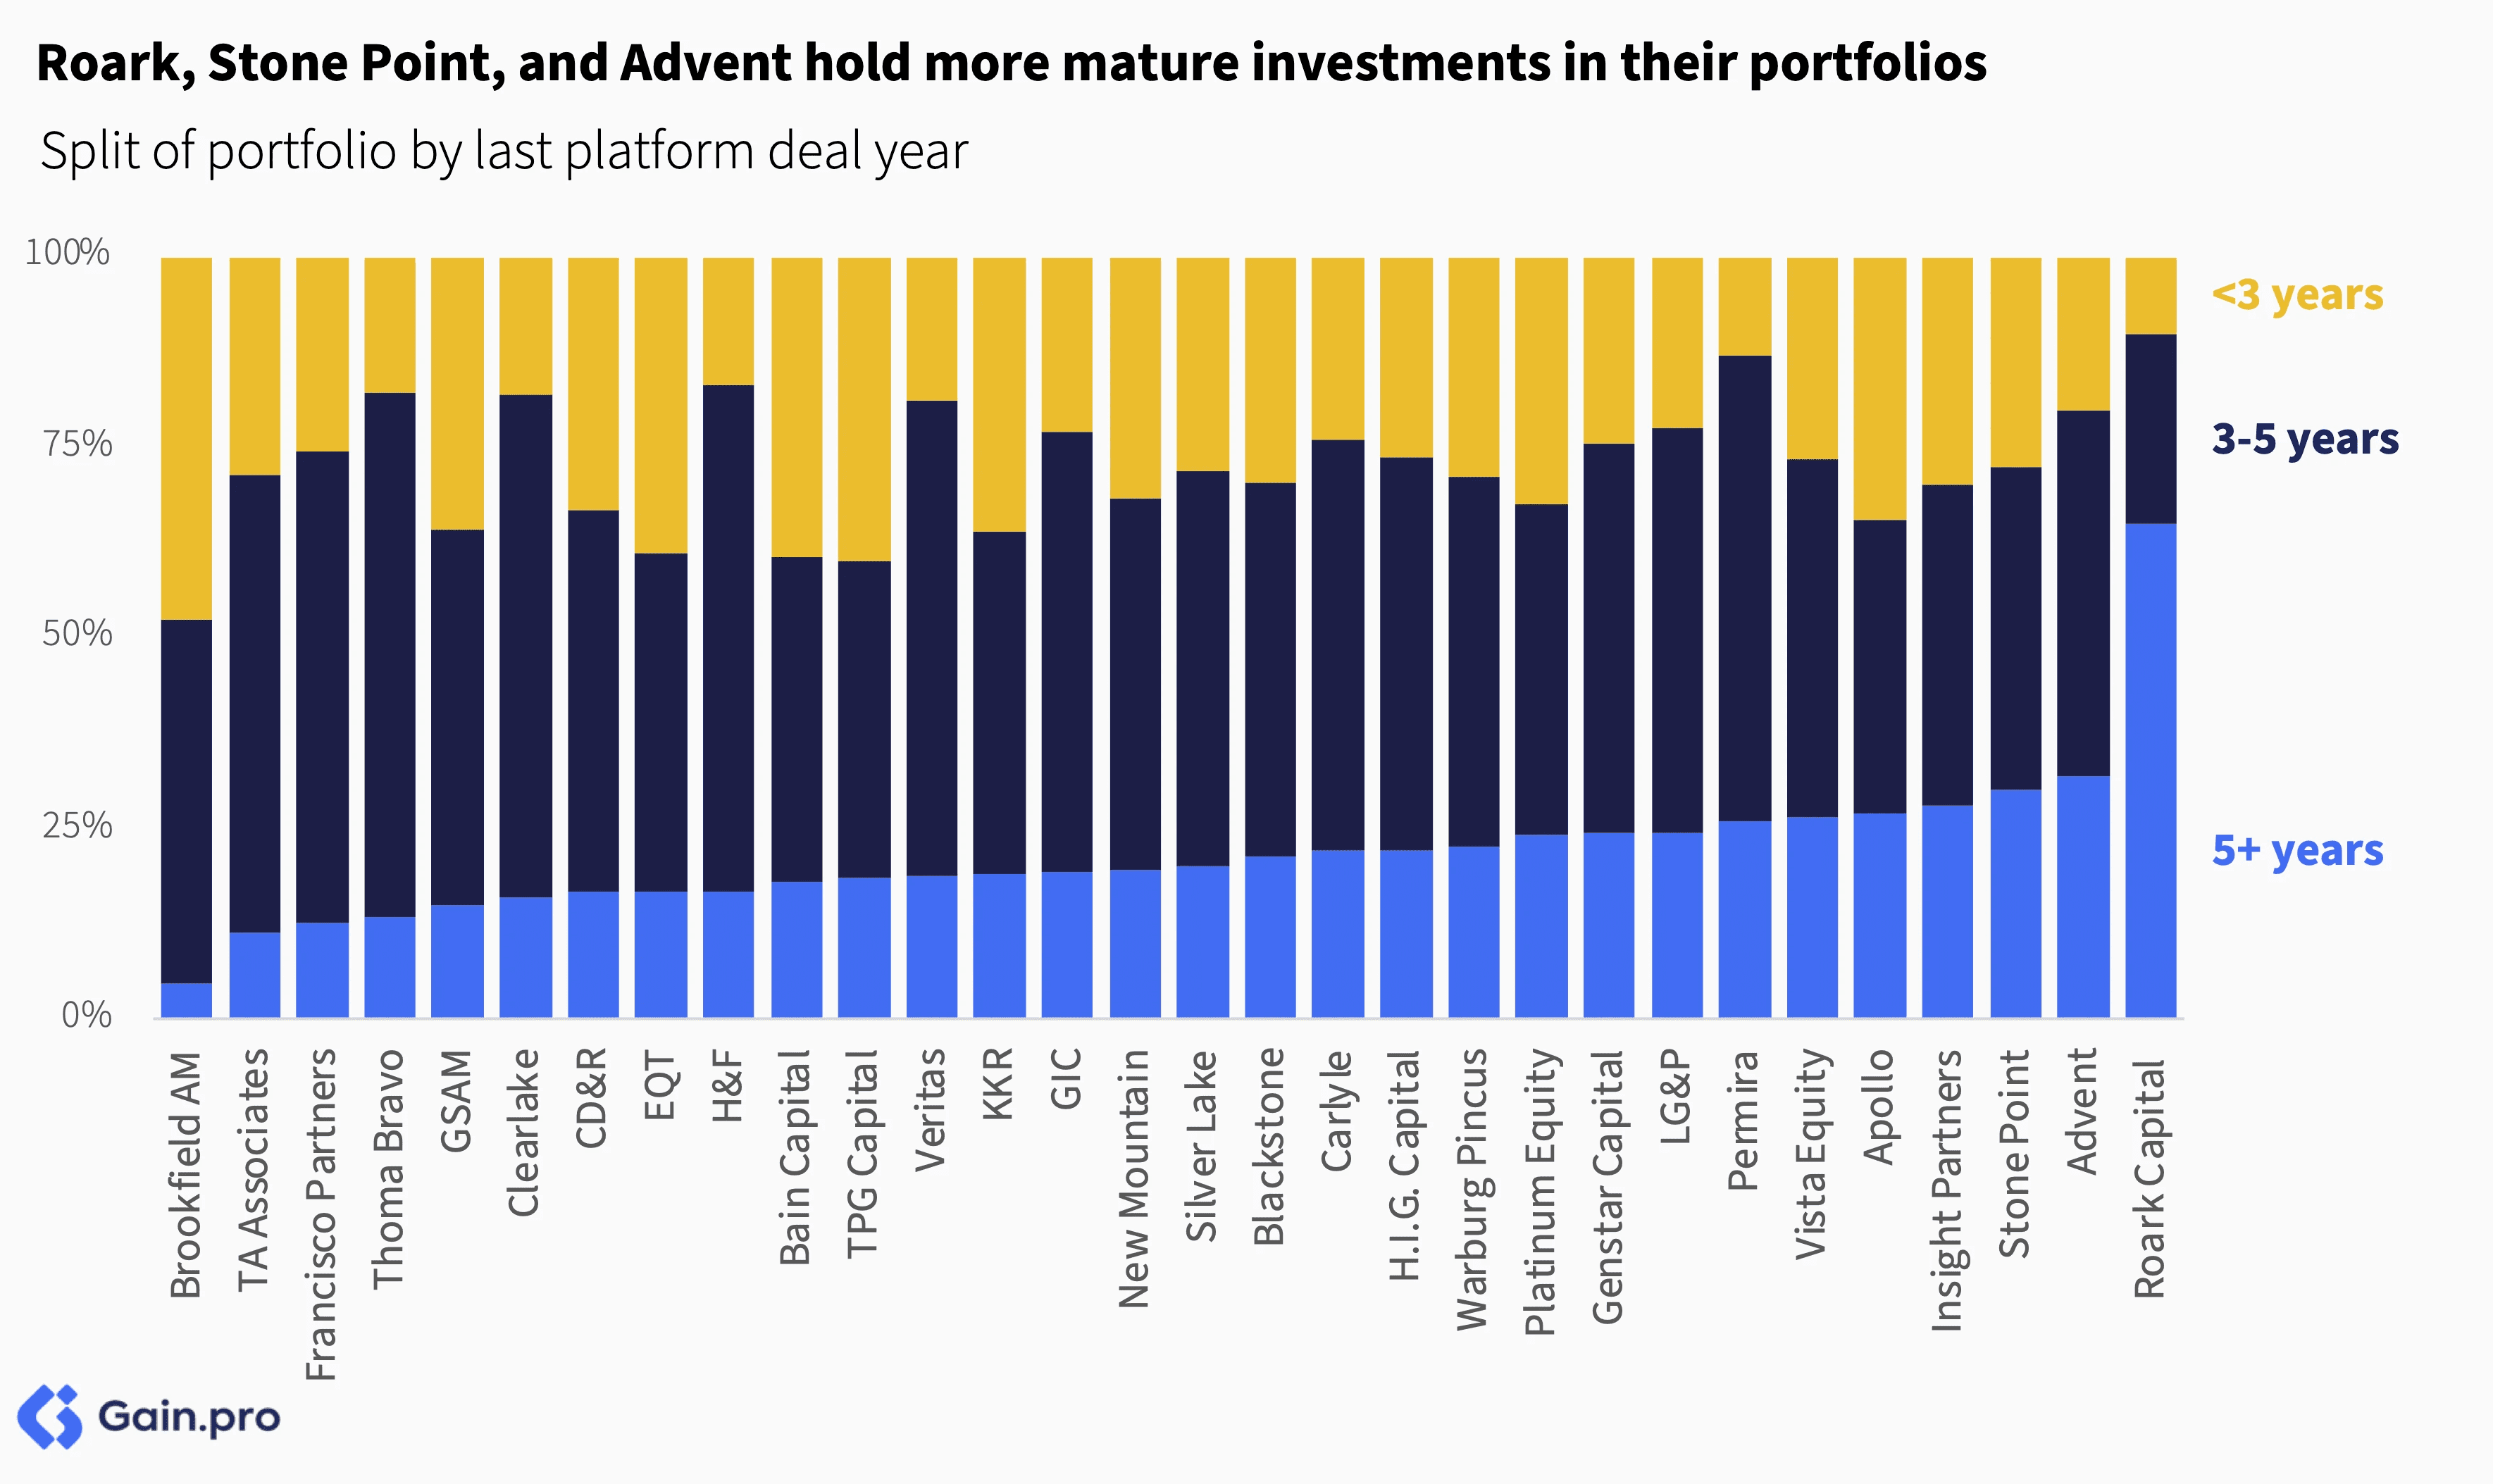
Roark Capital, Stone Point Capital, and Advent have portfolios with a higher share of mature investments, with 30% of investments tied to platform deals made more than five years ago. In contrast, investors like Brookfield and TA Associates have portfolios more heavily weighted toward recent acquisitions.
Growth Rates
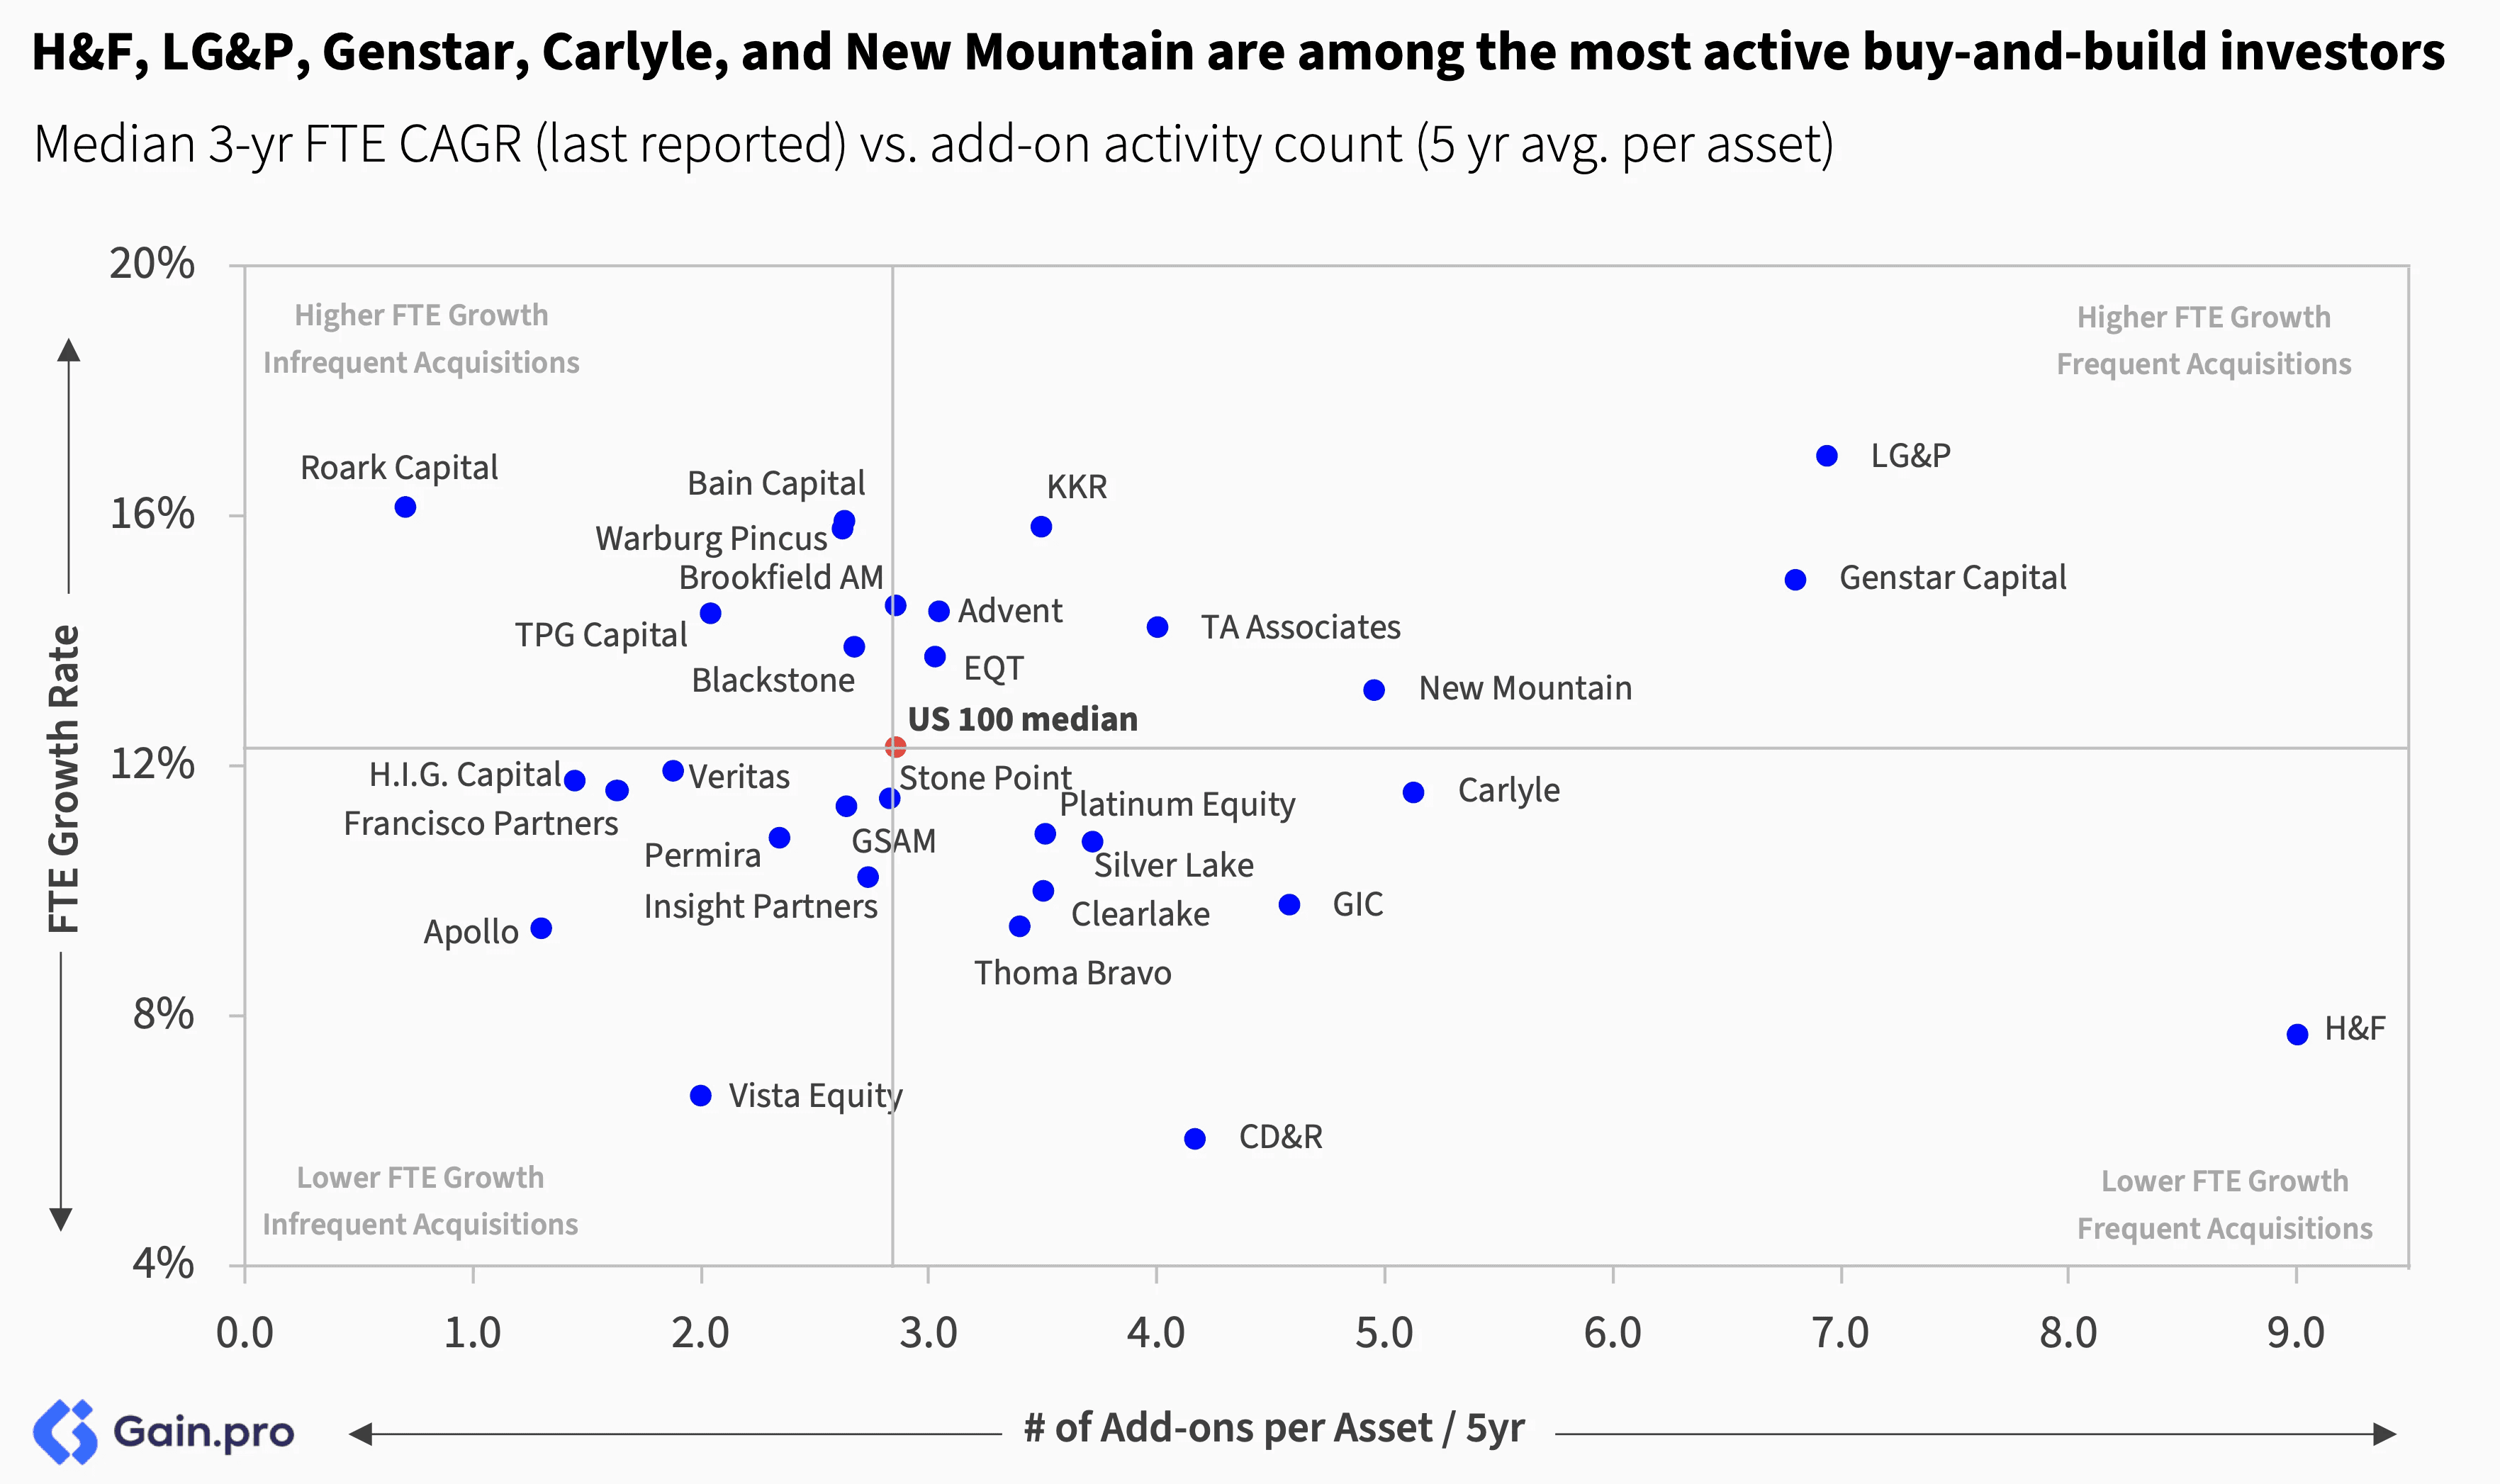
Hellman & Friedman (H&F), Leonard Green & Partners (LG&P), Genstar Capital, Carlyle, and New Mountain Capital are among the most active buy-and-build investors. For example, HUB International — a company backed by both H&F and LG&P — has executed 95 acquisitions in the past five years alone.
Roark Capital, Warburg Pincus, Blackstone, and KKR stand out as leading job creators, with strong FTE growth. Roark Capital owns a vast restaurant portfolio, including Subway, Arby’s, Buffalo Wild Wings, Jimmy John’s, Dunkin’, and Baskin-Robbins. Warburg Pincus, meanwhile, is a key investor in Allied Universal, the world’s largest private security agency.

Glossary
AUM – Assets Under Management
DPI – Distributions to Paid-In Capital
EBITDA – Earnings Before Interest, Taxes, Depreciation, and Amortization
EV – Enterprise Value
GP – General Partner
HQ – Headquarters
IRR – Internal Rate of Return
LP – Limited Partner
PE – Private Equity
PortCo – Portfolio Company
TMT – Technology, Media, and Telecommunications
US – United States of America
Methodology
We take a novel approach to our ranking, which is based on total managed enterprise value (EV) in the US. At Gain.pro, we track over 14,100 investor portfolios in detail.
To estimate the enterprise value (EV) of each company in an investor's portfolio, we begin with the last reported deal value, where publicly available. We then scale this figure based on full-time employee (FTE) growth to approximate the current value. We then adjust the EV for estimated ownership share.
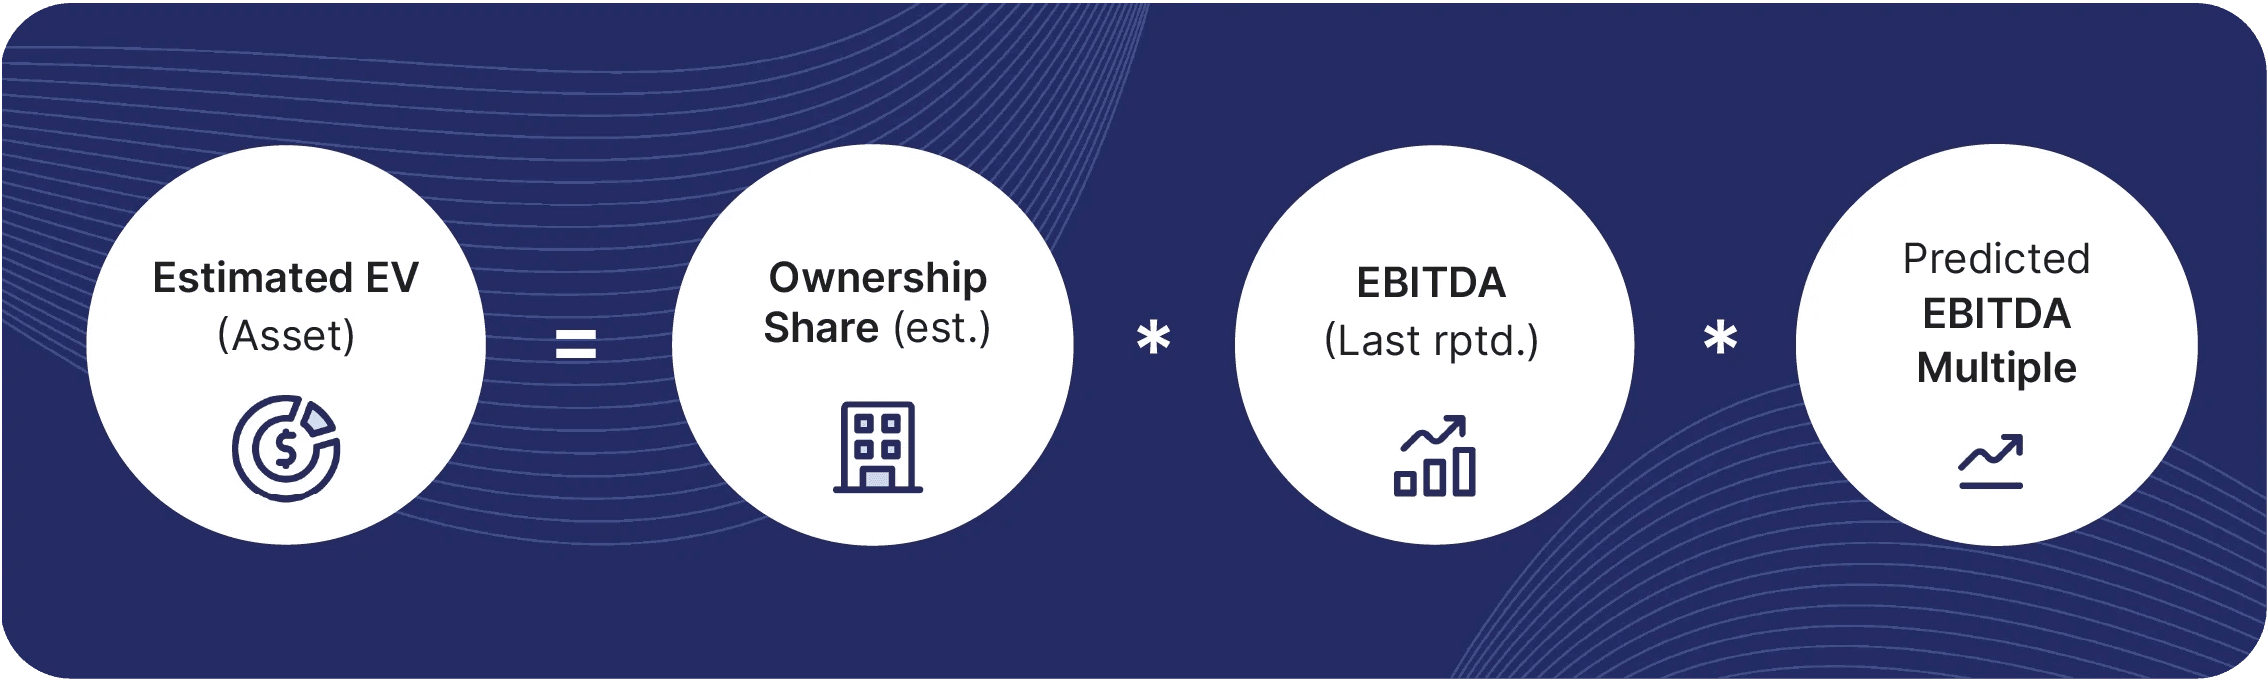
For assets without publicly available deal values, we estimate EV by multiplying EBITDA by the estimated ownership share and a predicted exit multiple. The total EV is then aggregated at the investor level.
Where EBITDA figures are unavailable, we estimate them using the asset’s revenue, subsector margins, and educated revenue/FTE estimates.
Our ranking includes only majority buyout and minority-owned private equity (PE) assets headquartered in the US. We exclude venture capital (VC) investments and publicly listed stakes. To predict exit multiples, we consider an asset’s sector, size, growth rate, margin profile, and cash generation.
Additionally, we include only active investors in the ranking, defined as those with:
i) At least five portfolio companies in the US
ii) At least five new investments since 2019
Unless otherwise stated, all metrics and calculations are based solely on an investor’s US portfolio.