The State of European
Private Equity


Executive Summary
Entries — PE deal activity made a comeback in 2024, up 12% year-over-year. Investors are starting to deploy dry powder as overall market conditions improve. Cross-border deal activity from North American investors is rising, up by +3pp in the last 6 years.
Add-ons — Add-on deal activity in Europe is slightly muted compared to previous years (down ~14% yoy). Services was still the largest sector for add-ons (43% of deals), followed by TMT (18%) and Industrials (15%).
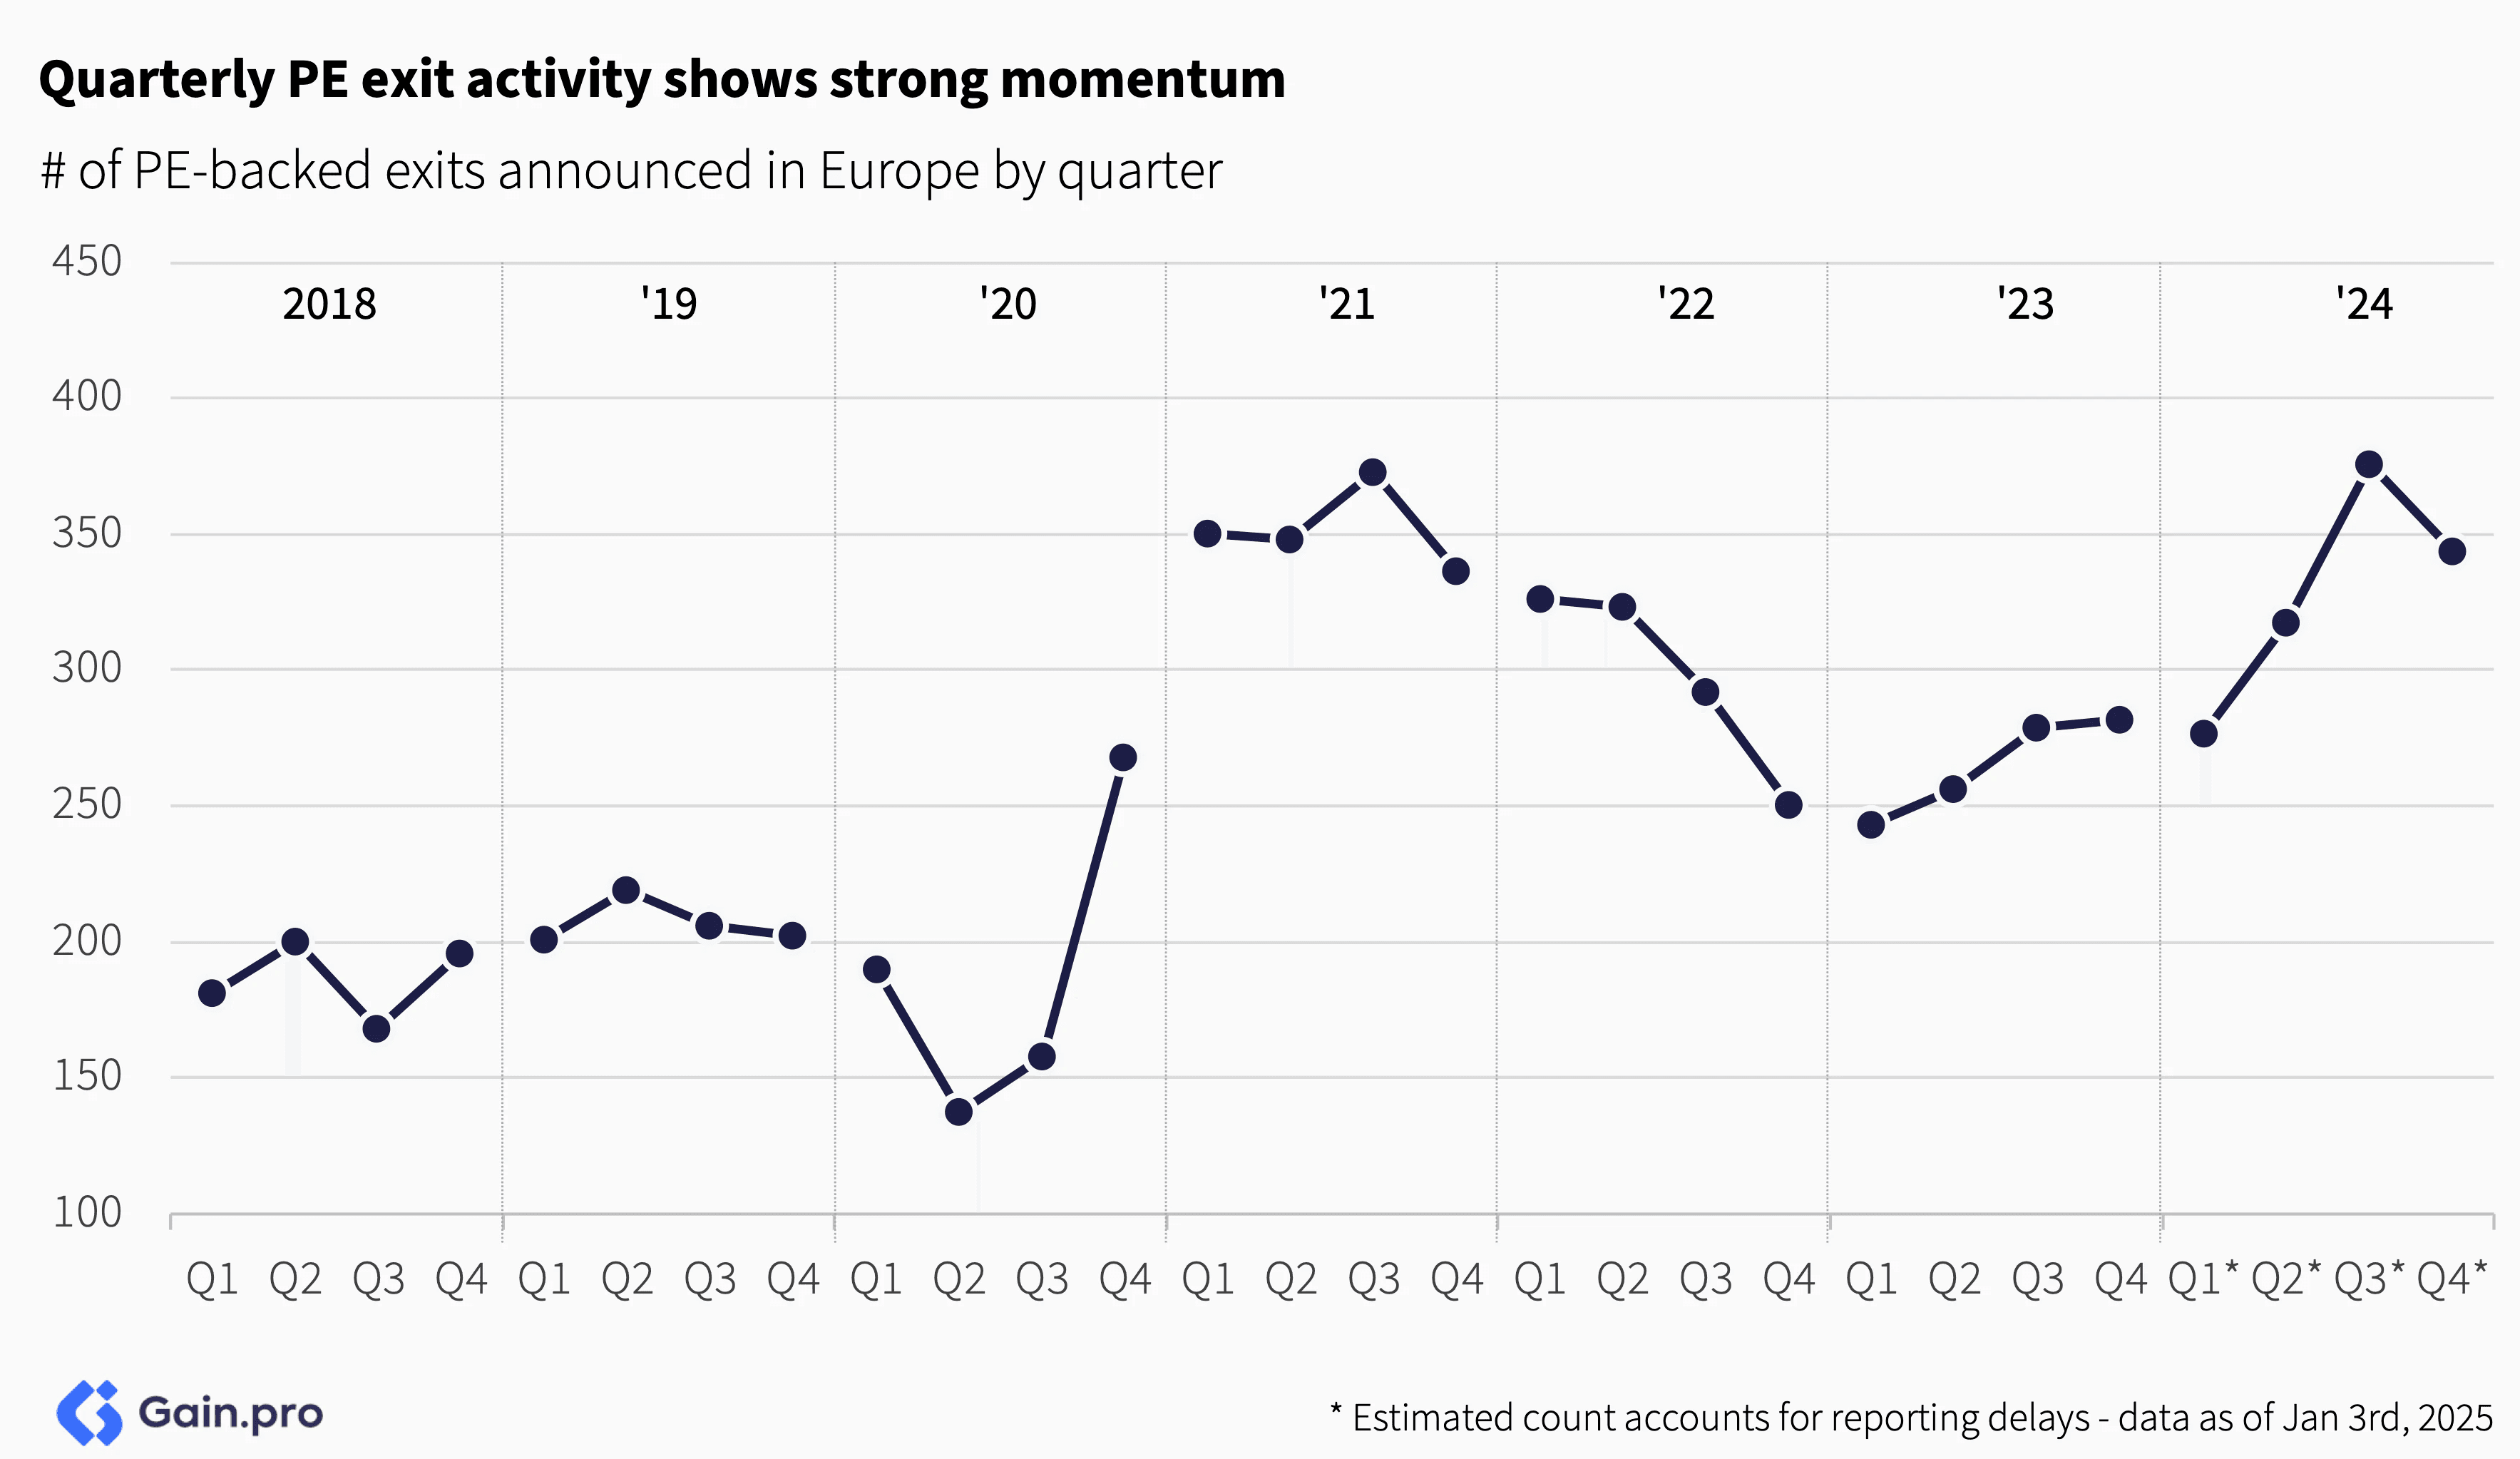
Exits — PE exit activity picked up in 2024, up 24% year-over-year. Quarterly data shows a ‘V’ shape recovery in exit volumes. Despite subdued valuations, investors are prioritizing liquidity for LPs, bringing a backlog of delayed exits to the market.
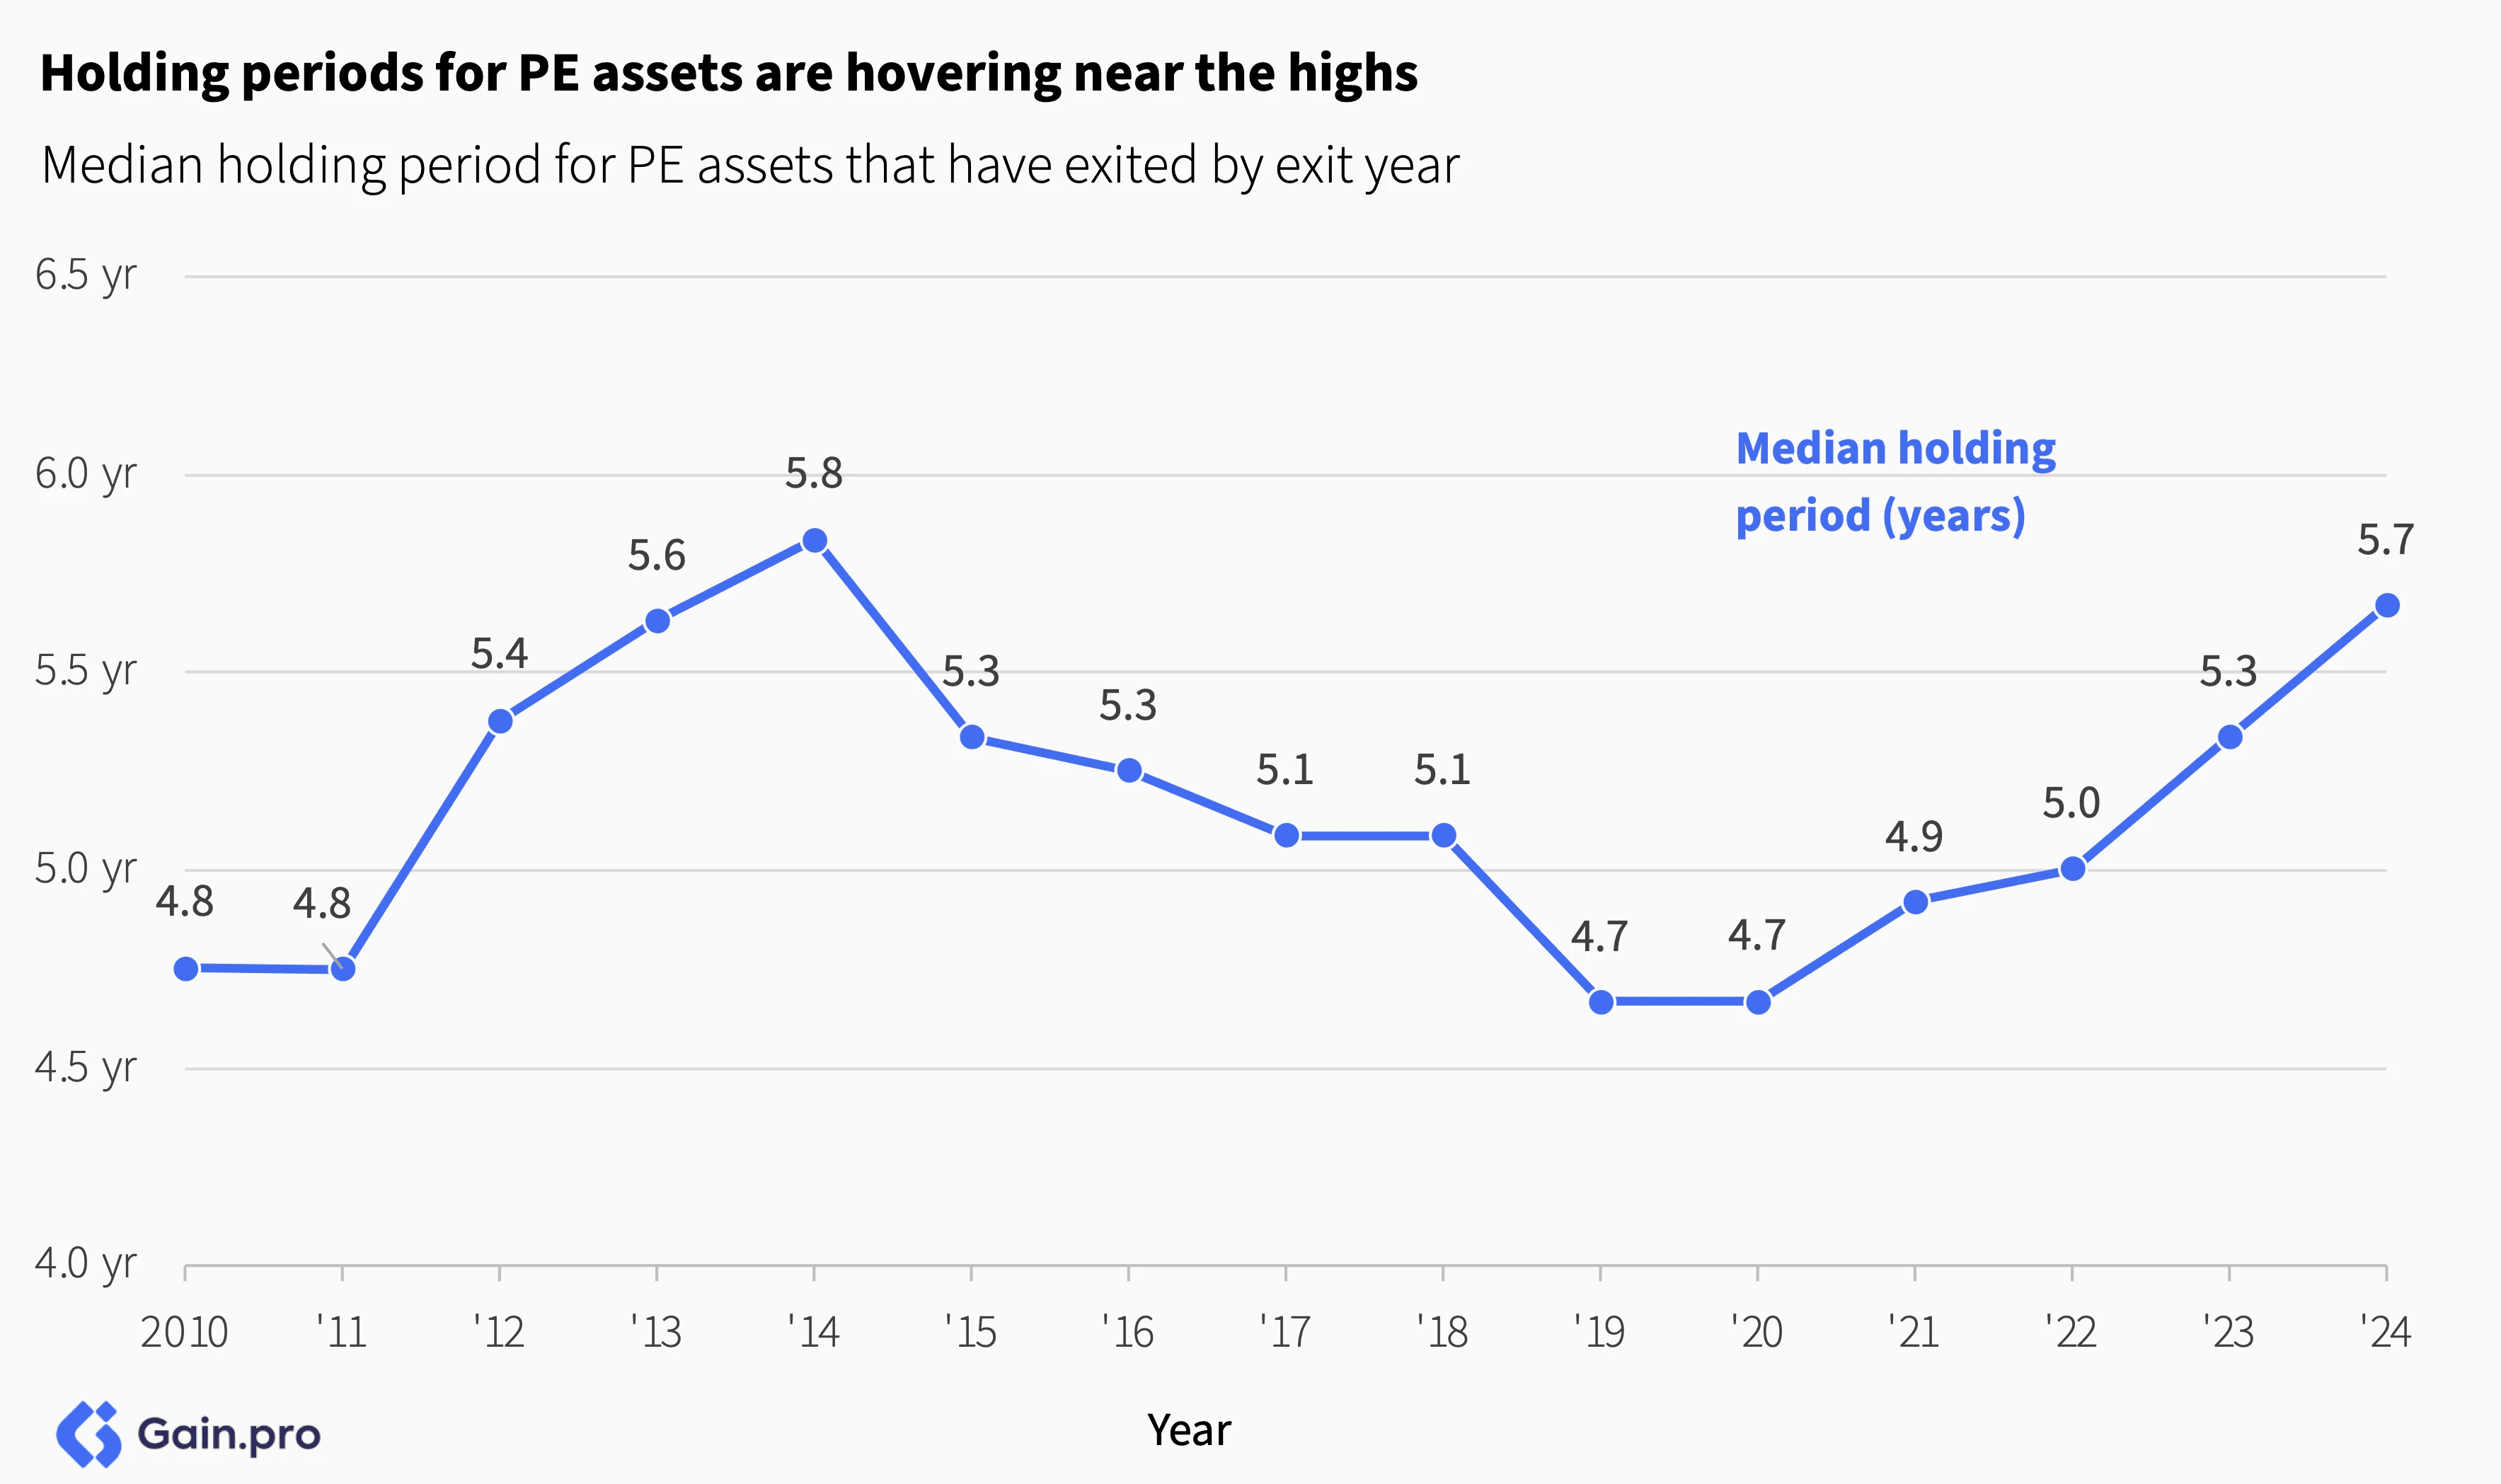
Holding Periods — The median company that exited in 2024 spent 5.7 years in the portfolio, up from 4.7 years in 2020.
Multiples — PE multiples were down a third year in a row. TMT and Science & Health commanded a healthy premium vs. other sectors while the discount for add-on deals narrowed vs. platform multiples.
Growth — Growth for PE-backed assets is coming off cycle highs, down vs. 2022 and 2021. The median PE-backed business grew 12.4% in 2023 vs. 19.5% in 2022 and 17.1% in 2021. Margins expanded slightly from last year.
If you have any questions about the data or the report, do not hesitate to reach out to sid.jain@gain.pro.


Chapter 01: Entries
Overall Trend
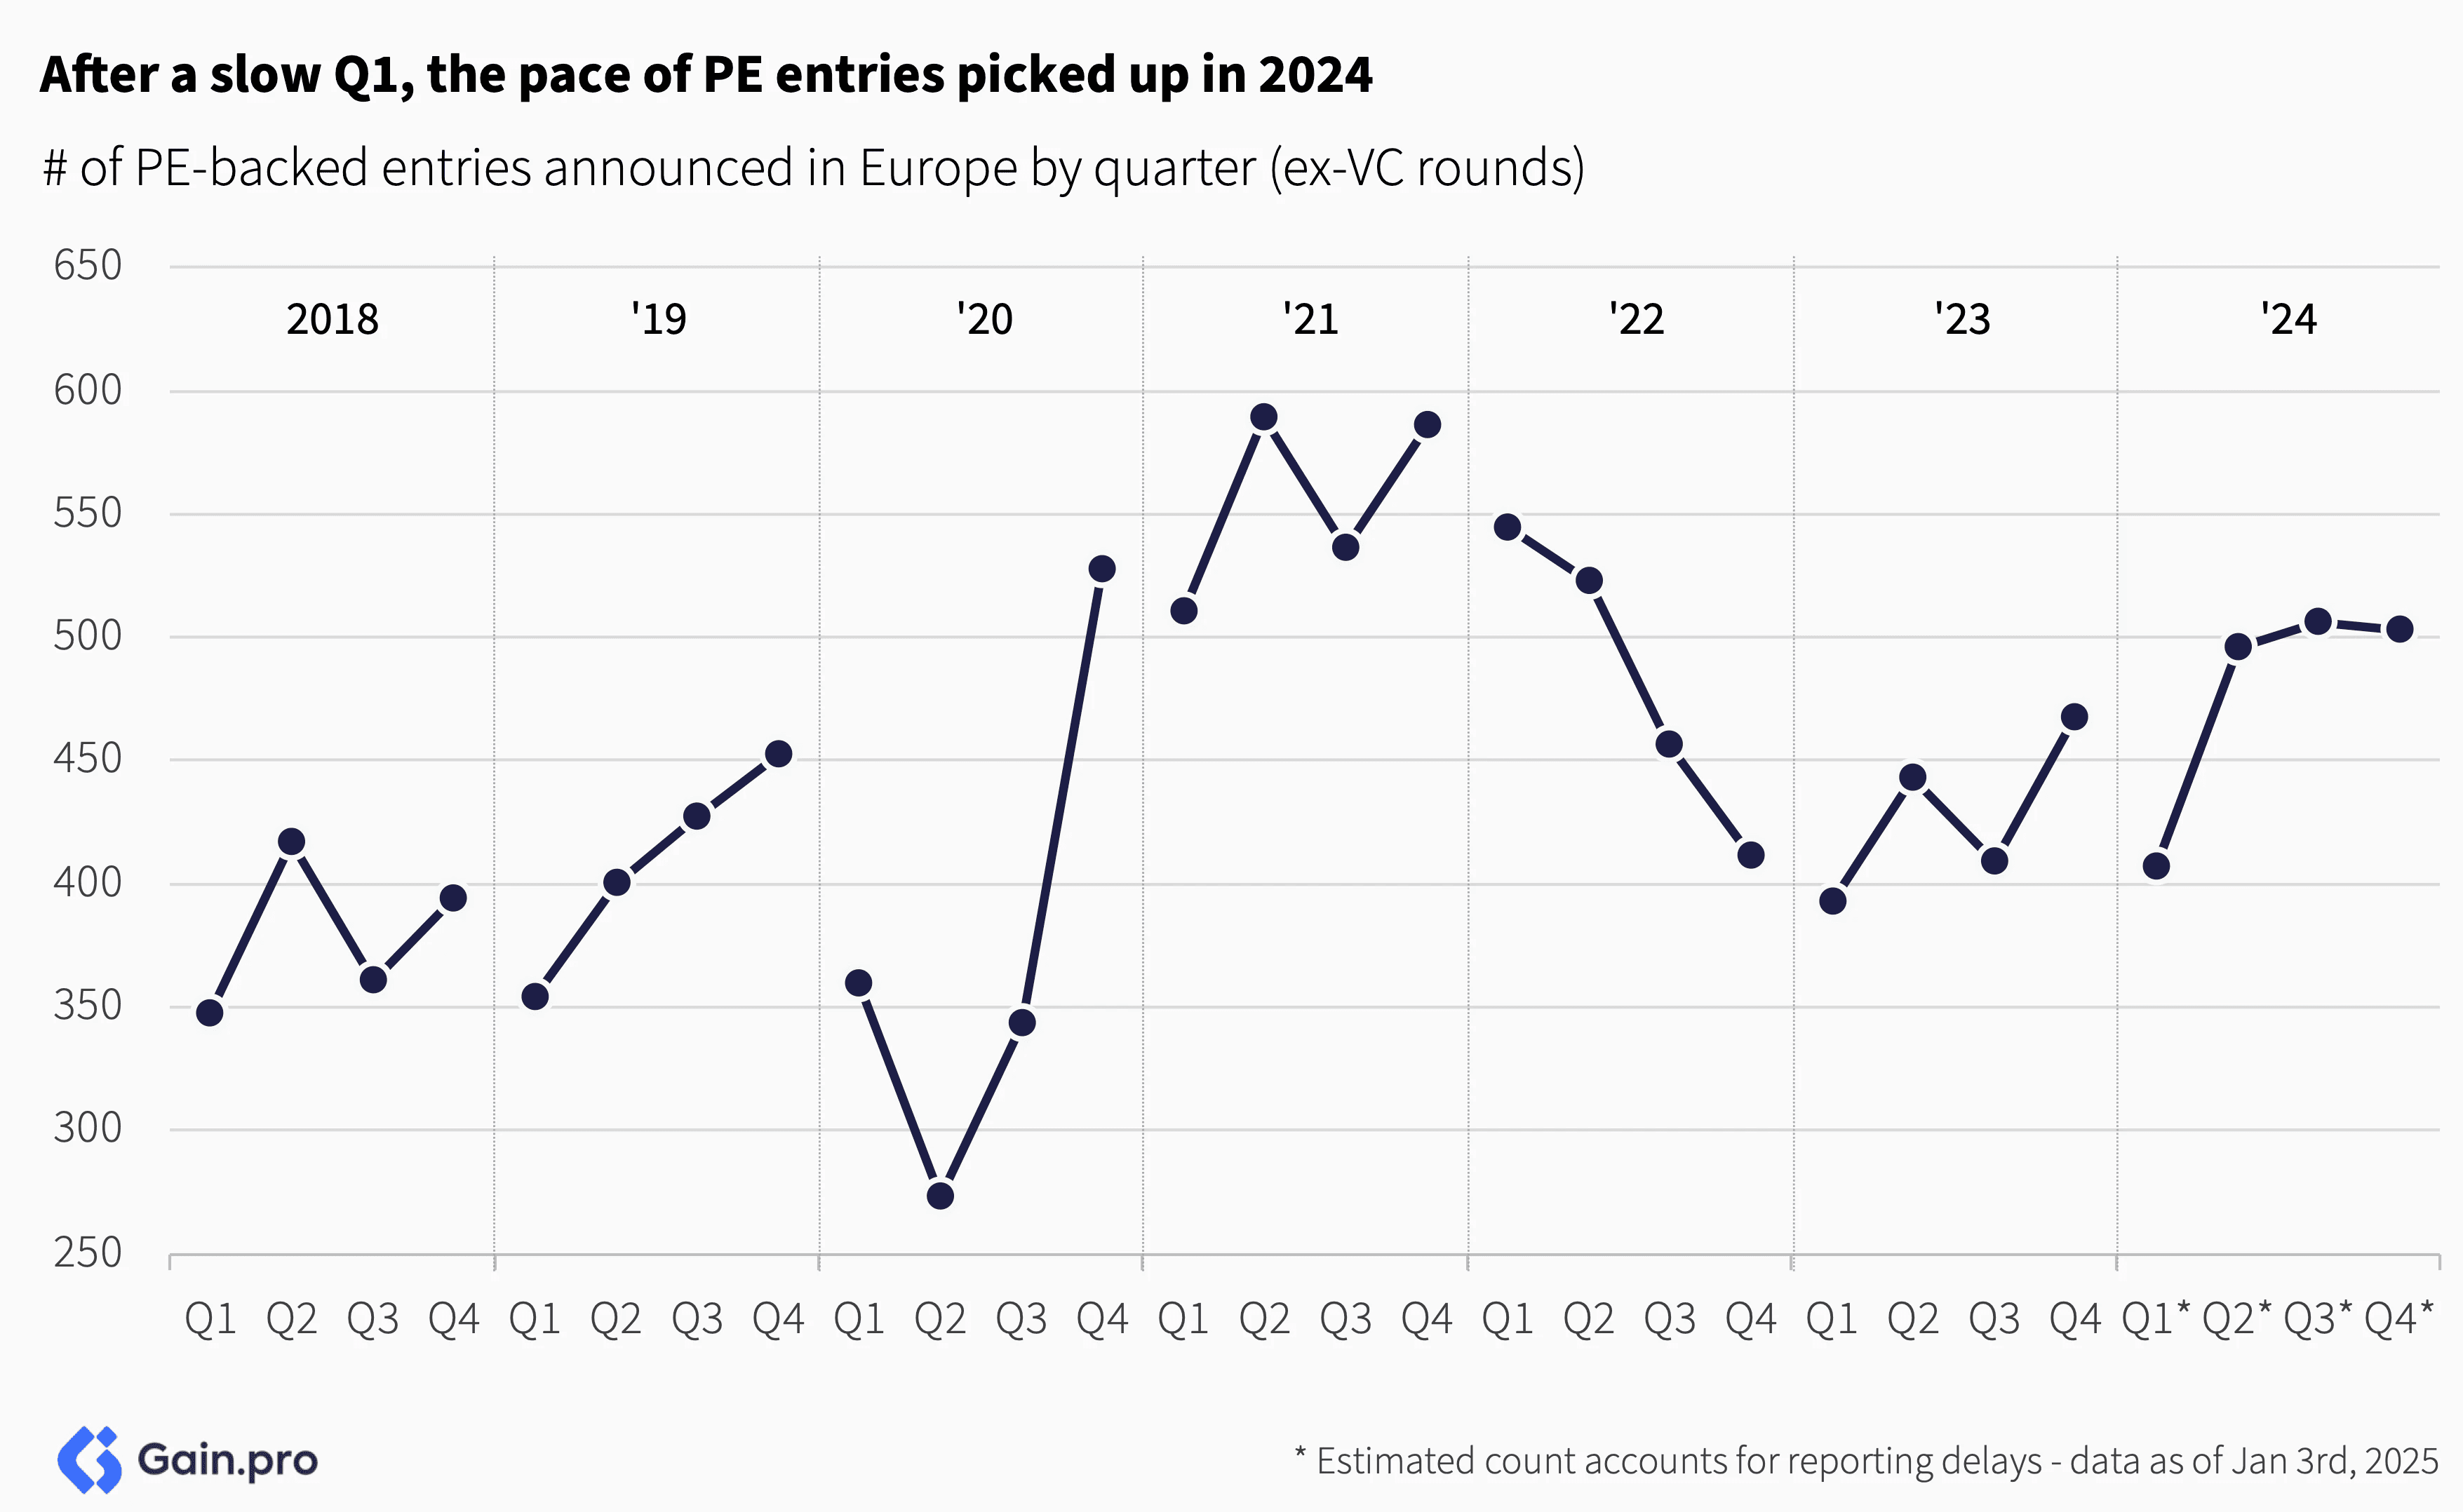
PE deal activity made a comeback in 2024, up 12% year-over-year. Investors are starting to deploy dry powder as overall market conditions improve.
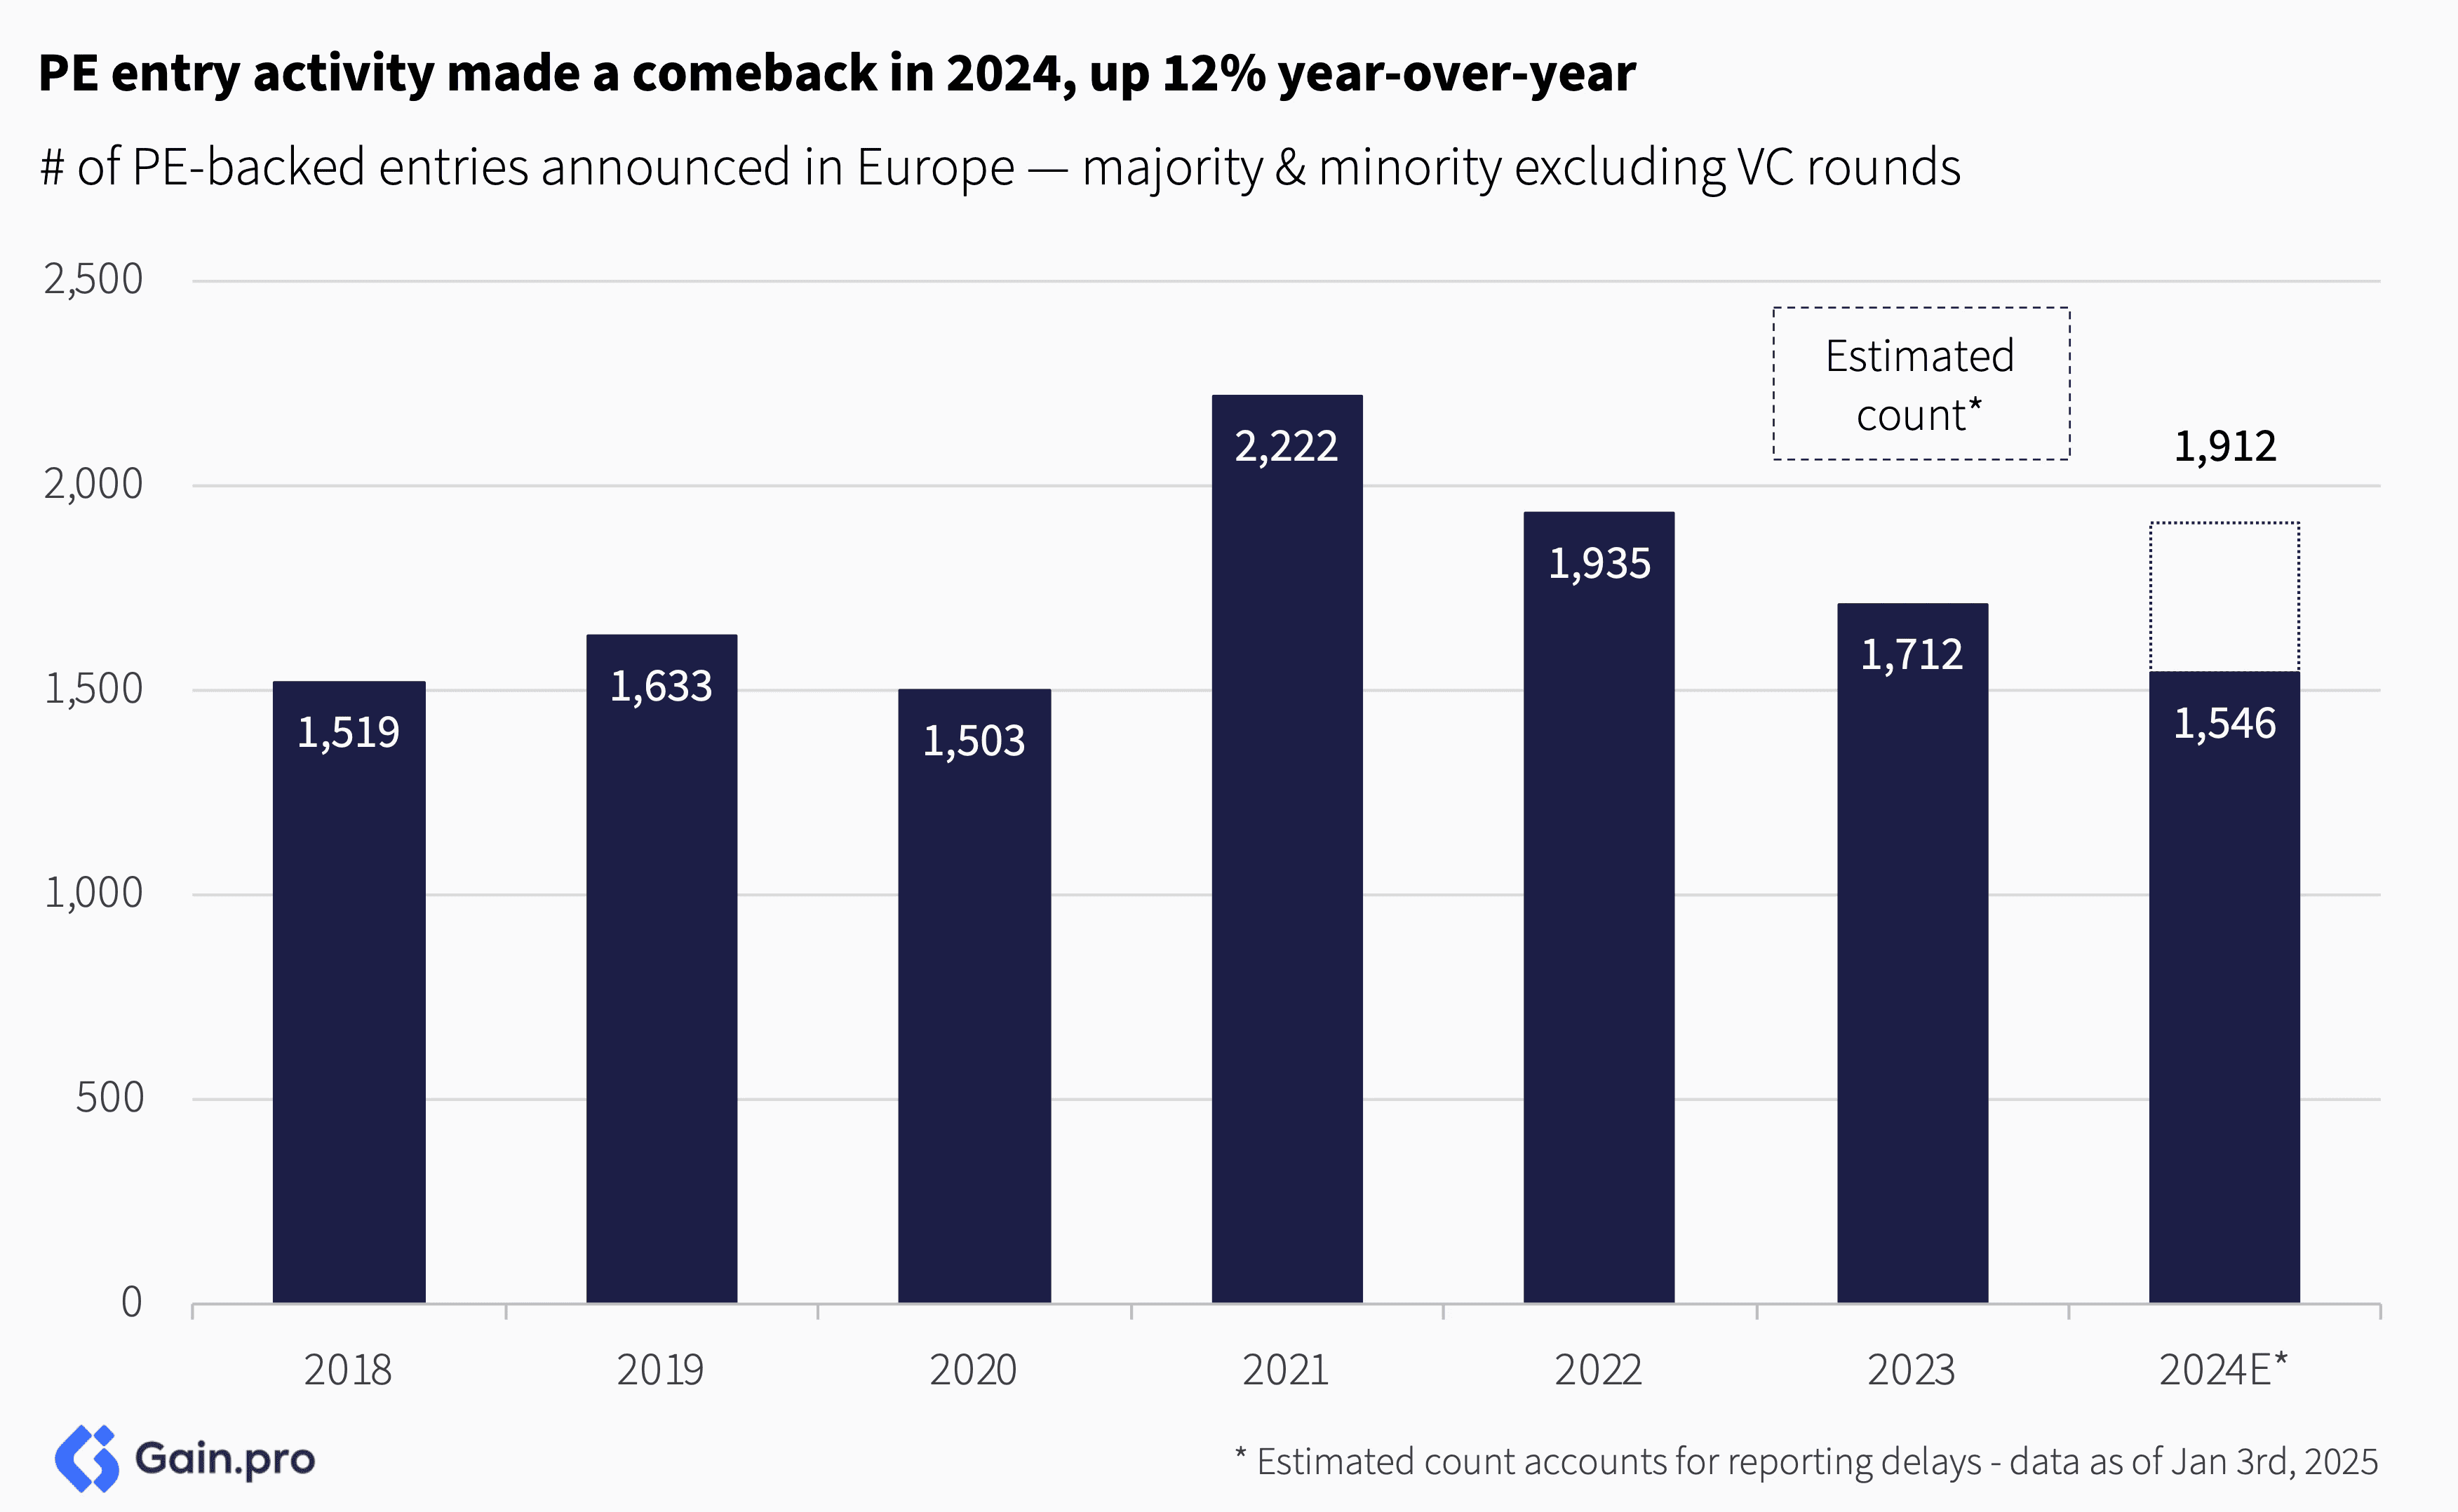
After a slow Q1, the pace of PE entries picked up. 2022 was a year of decline, 2023 of stabilization and 2024 of recovery. Looking ahead, we remain bullish about the outlook for private markets in 2025.
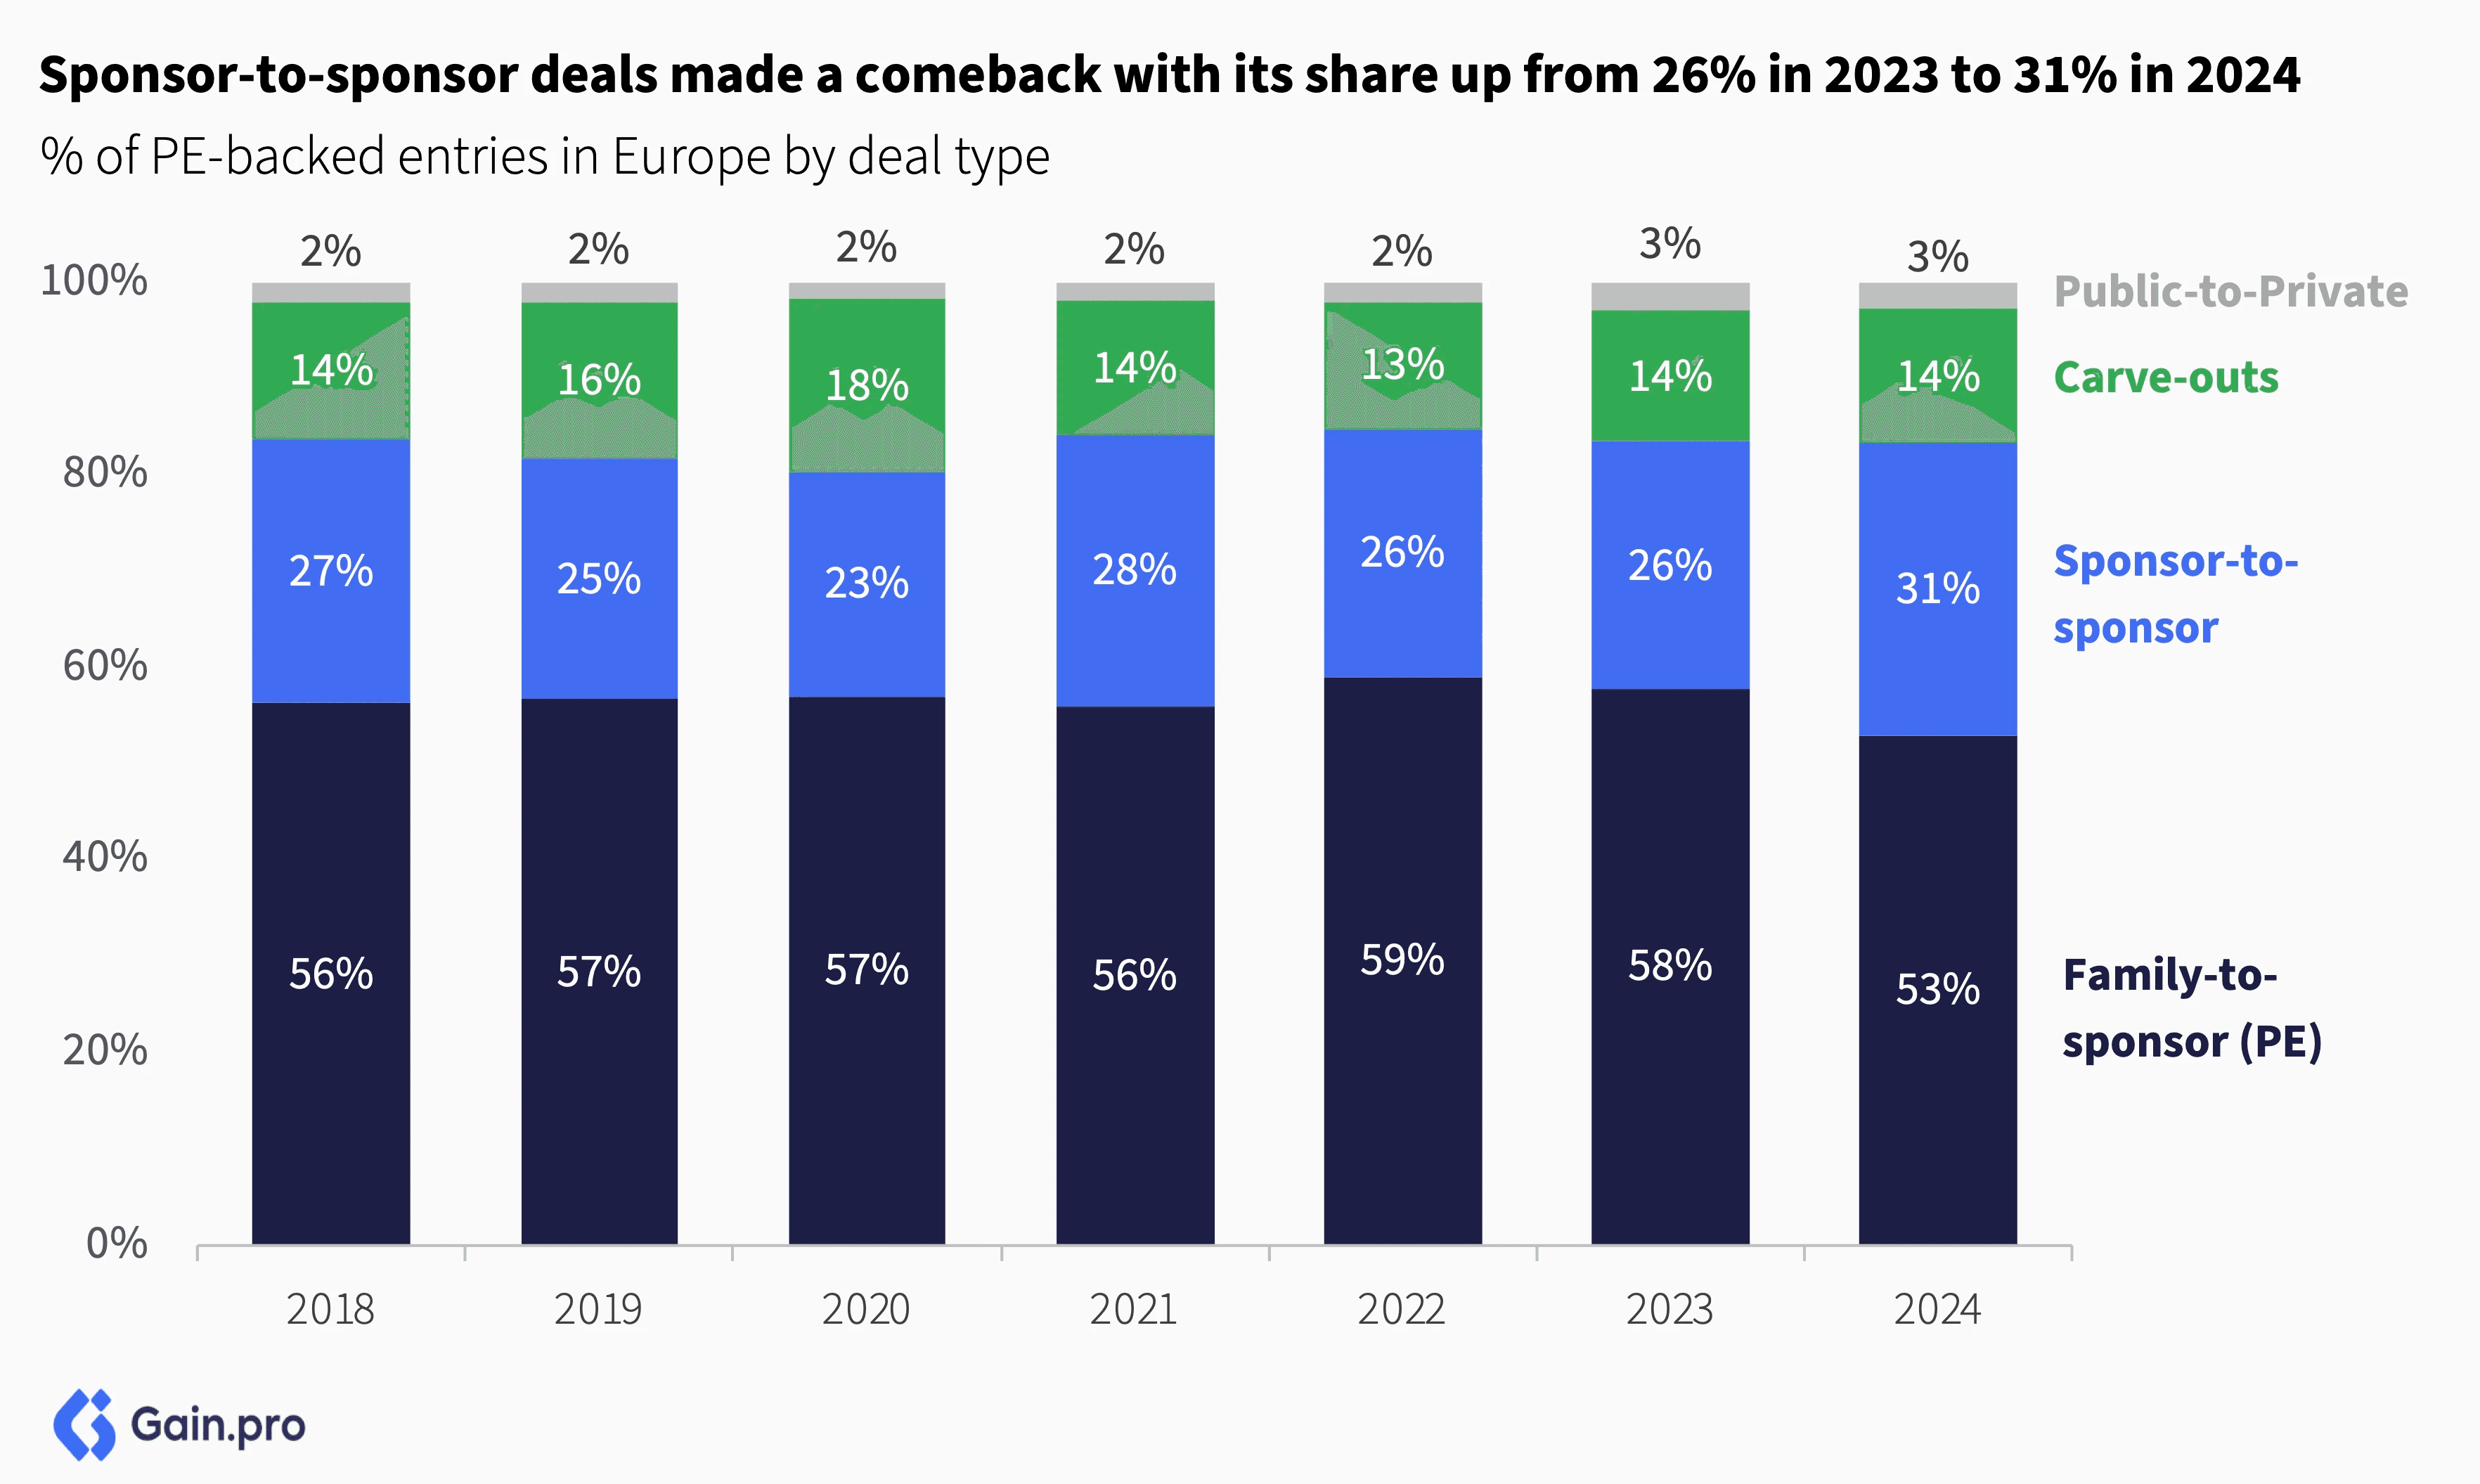
By deal type, sponsor-to-sponsor deals made a comeback, with their share rising from 26% of deals in 2023 to 31% in 2024. Family-to-sponsor deals still accounted for the largest share of deals (53% of entries), followed by sponsor-to-sponsor deals (31%), carve-outs (14%) and public-to-private transactions (3%).
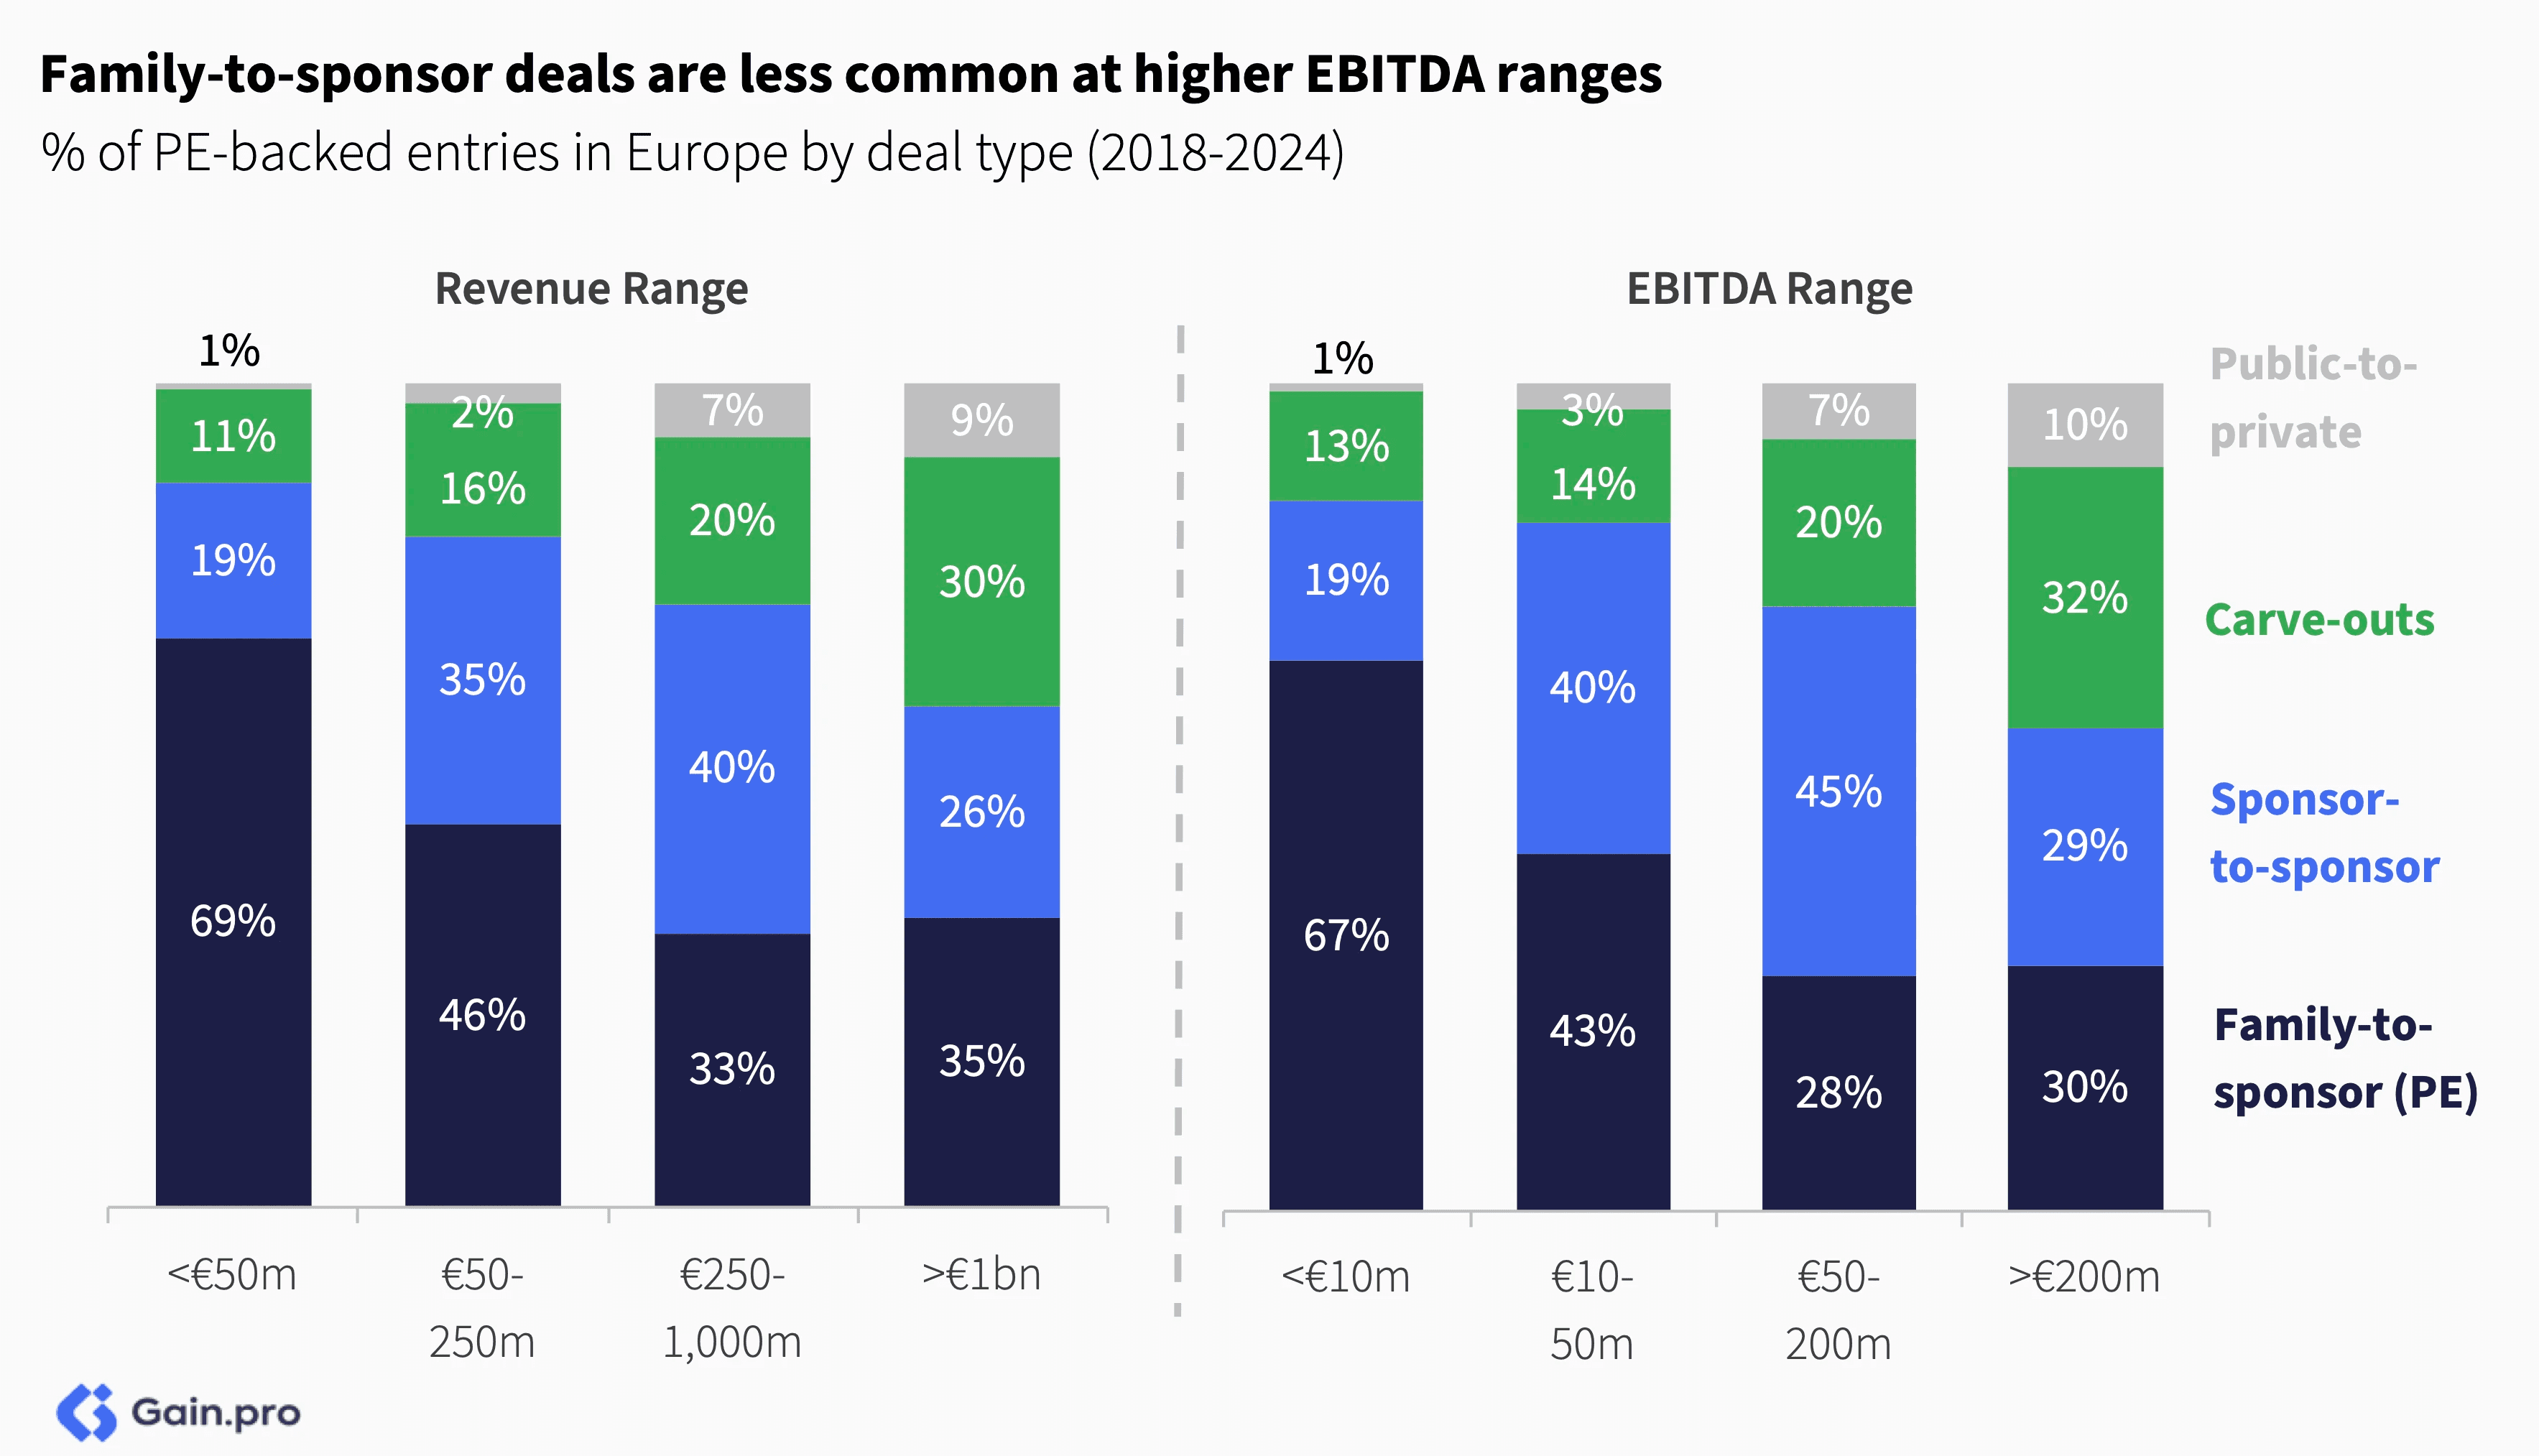
Family-to-sponsor deals are less common at higher EBITDA ranges. As target size grows, carve-outs and take-privates become more popular. Carve-outs represented 32% of deals with EBITDA over €200m, while take-privates accounted for 10%.
Entries by Sector
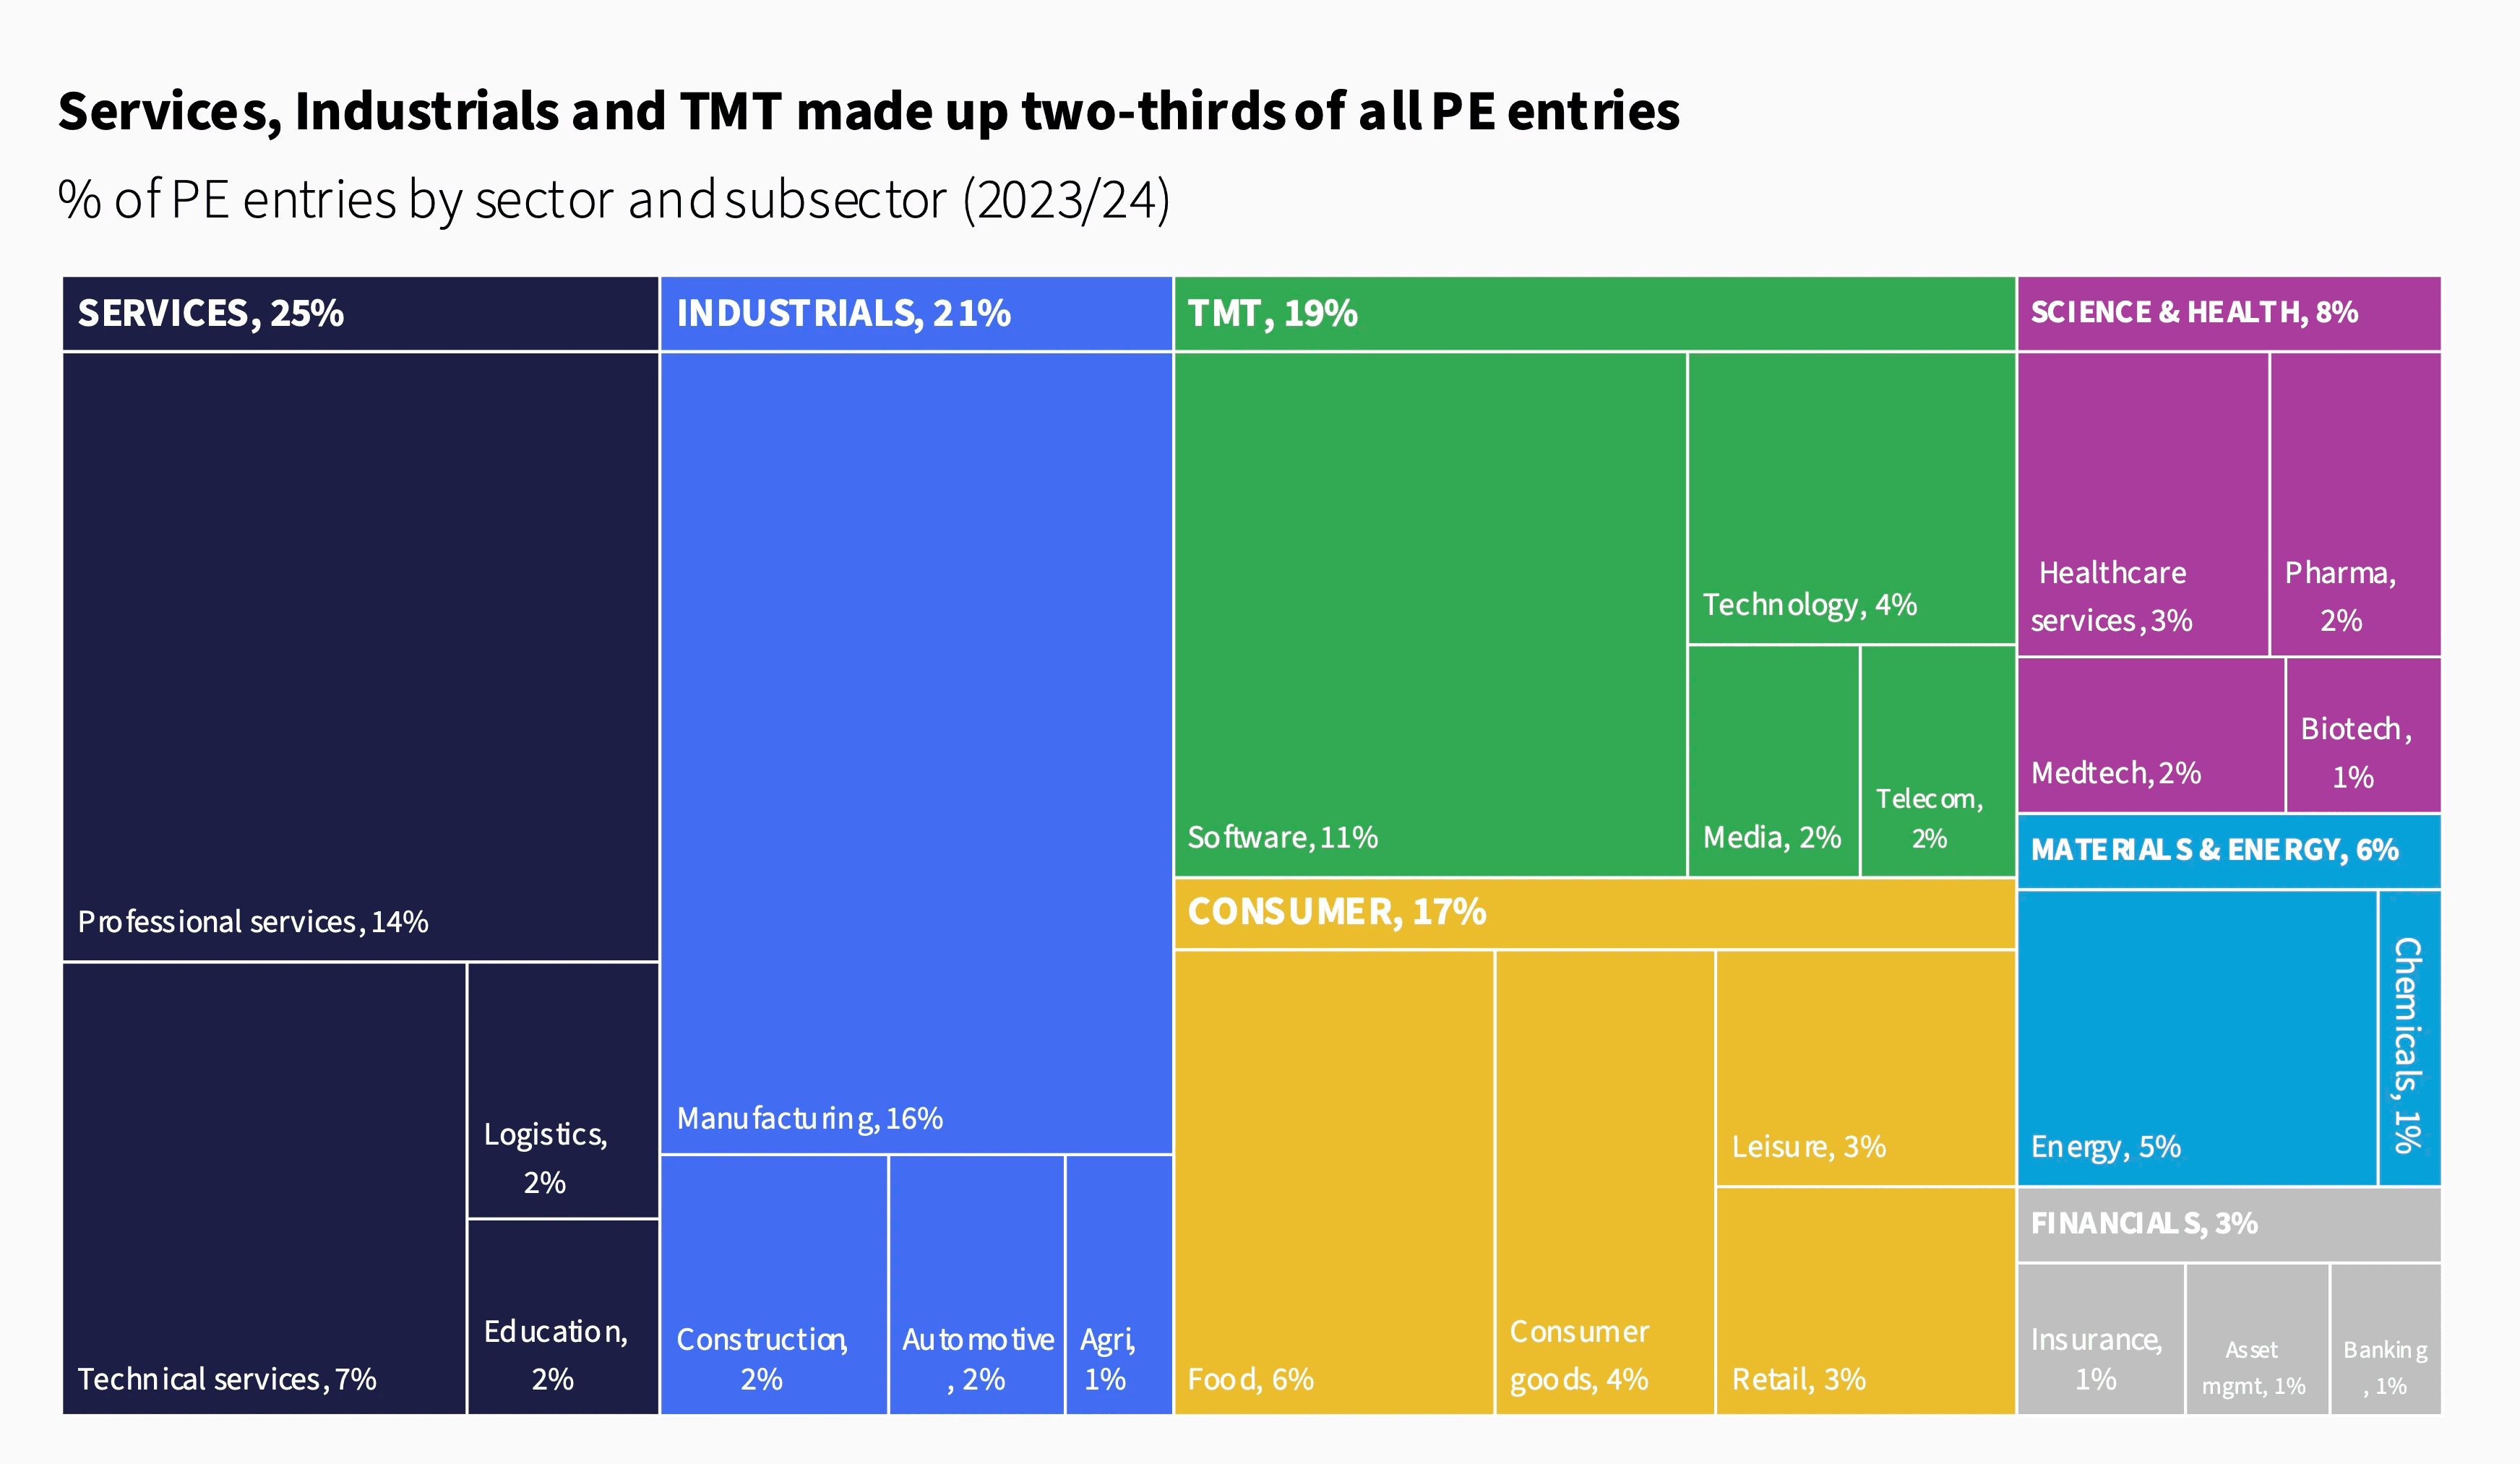
Services (25%), Industrials (21%) and TMT (19%) made up two-thirds of all PE entries, with Manufacturing (16%), Professional Services (14%) and Software (11%) leading at the subsector level.
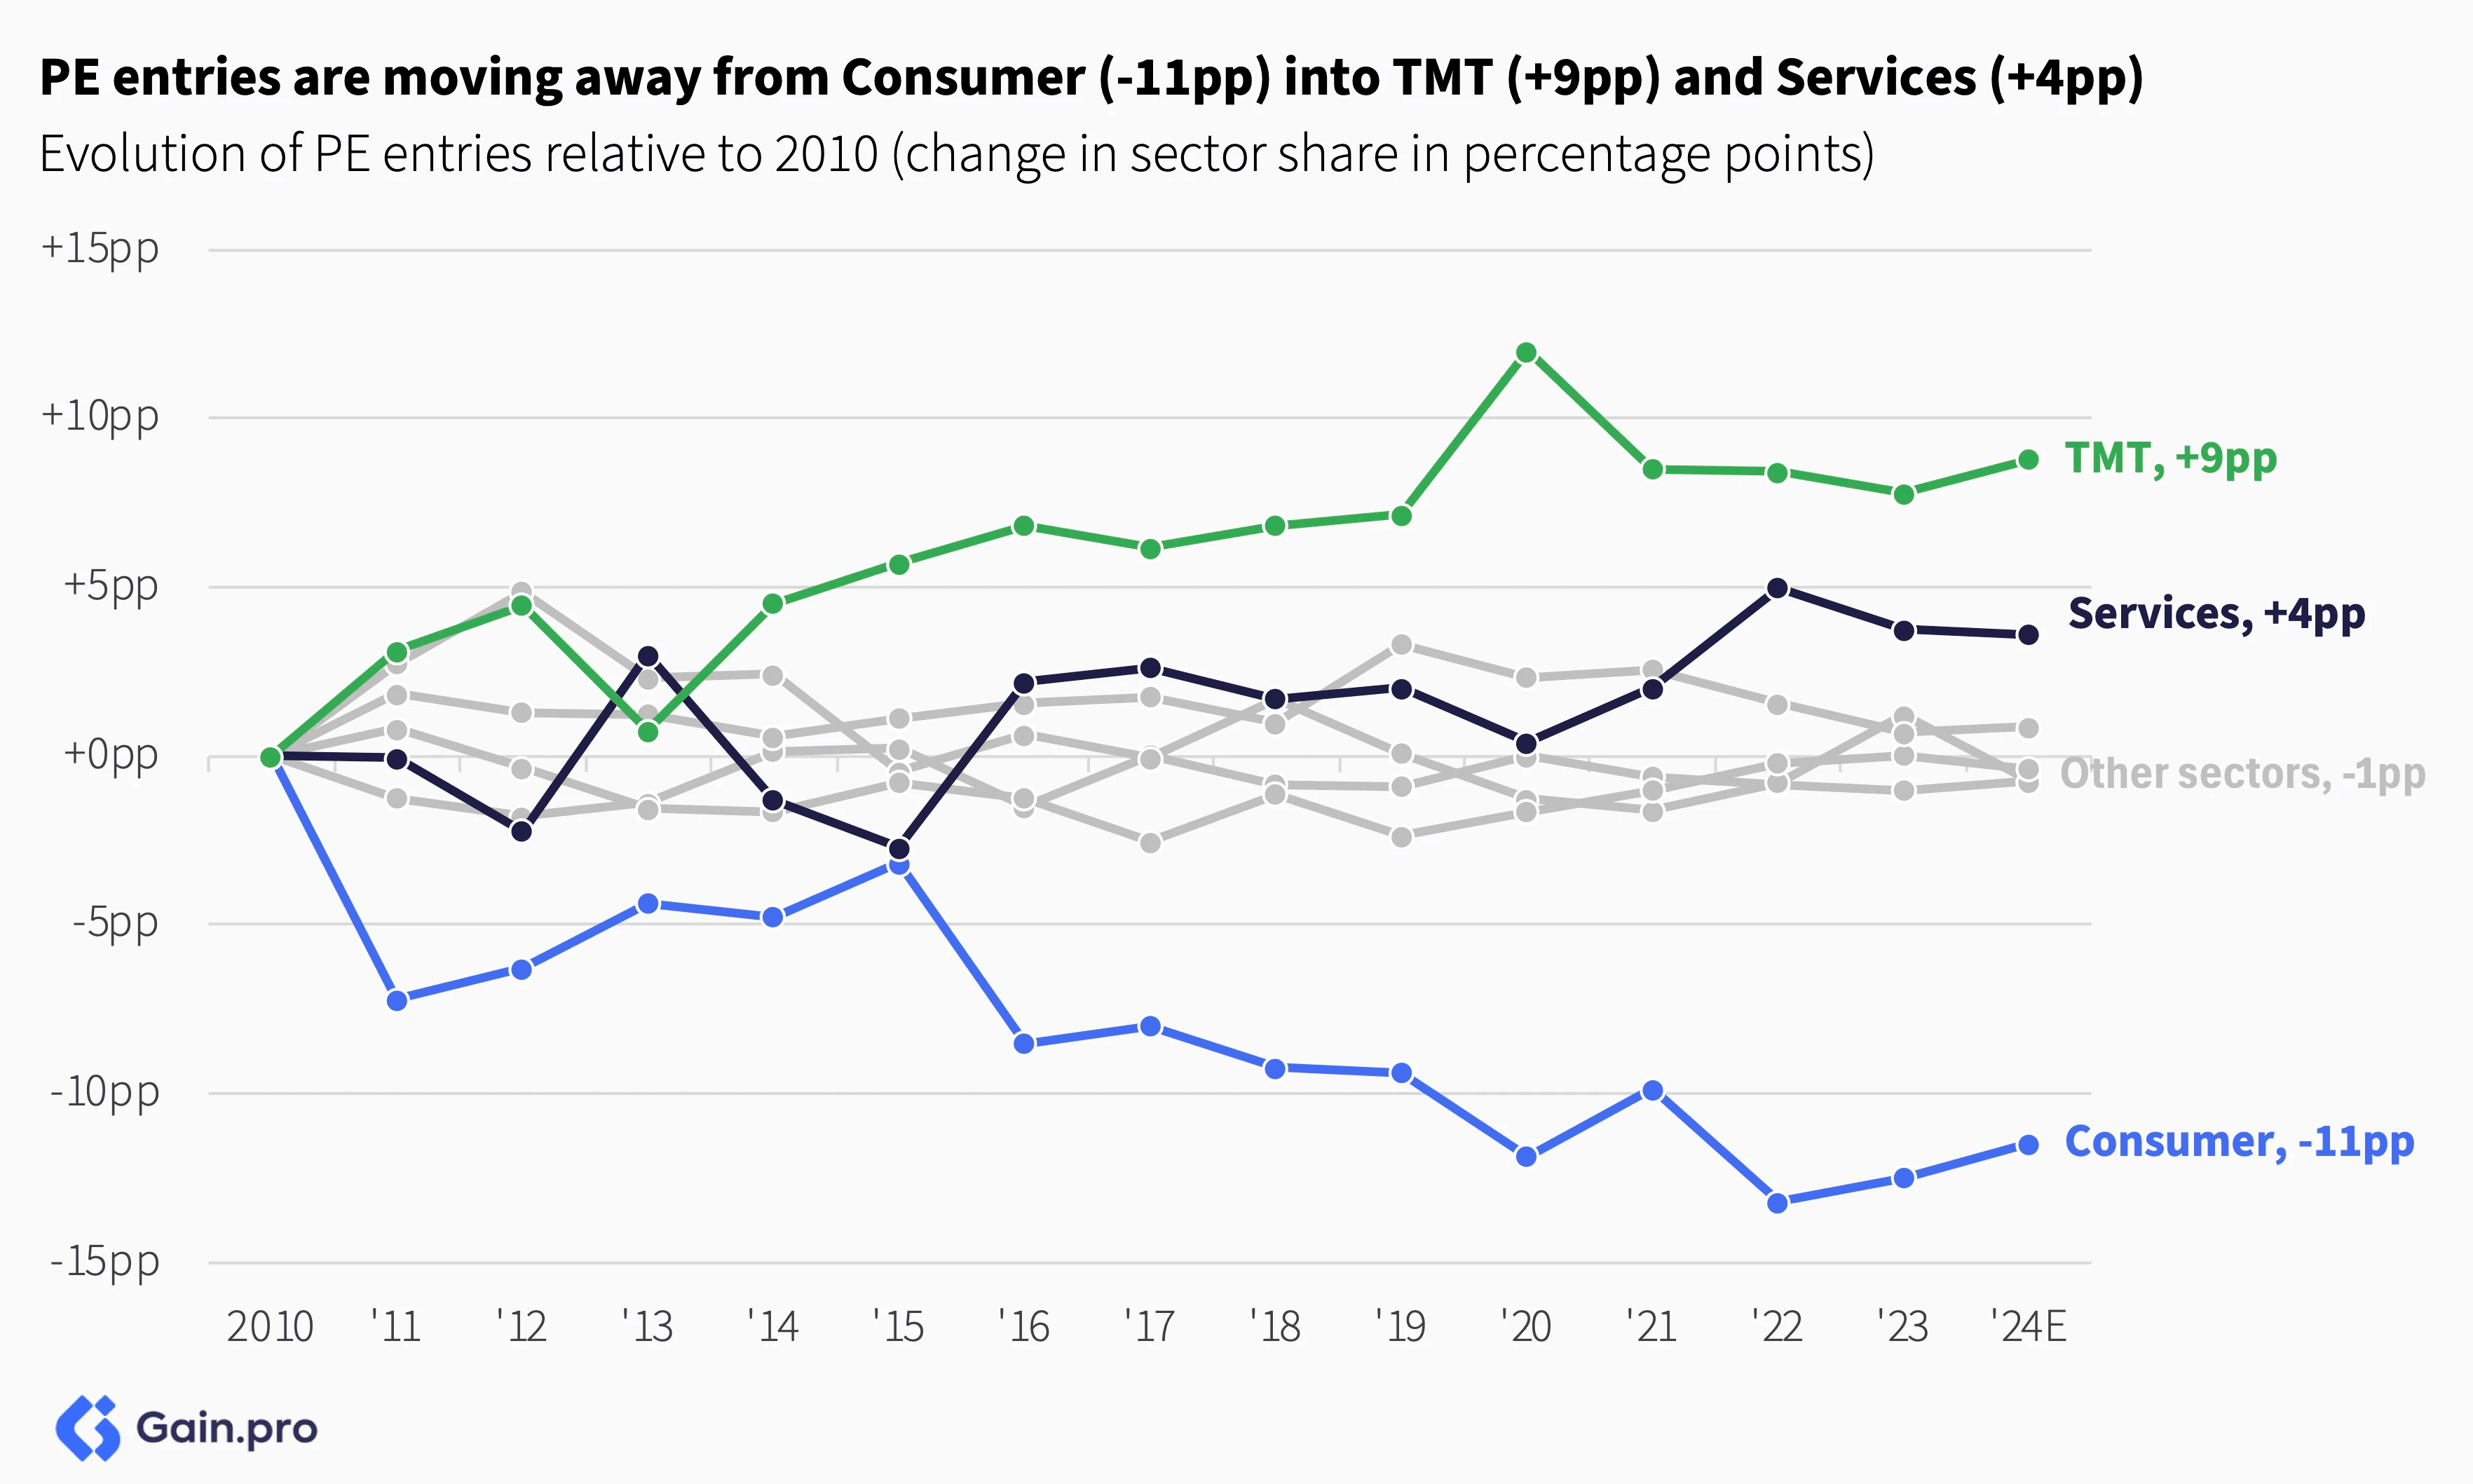
The sector mix for PE entries has changed. The share of TMT (+9pp) and Services (+4pp) has grown since 2010 as investors prefer asset-light, innovative and fast-growing businesses. The share of Consumer deals (-11pp) has come down, driven by slower growth rates and a challenging exit environment, particularly in the Retail and Consumer Goods subsectors.
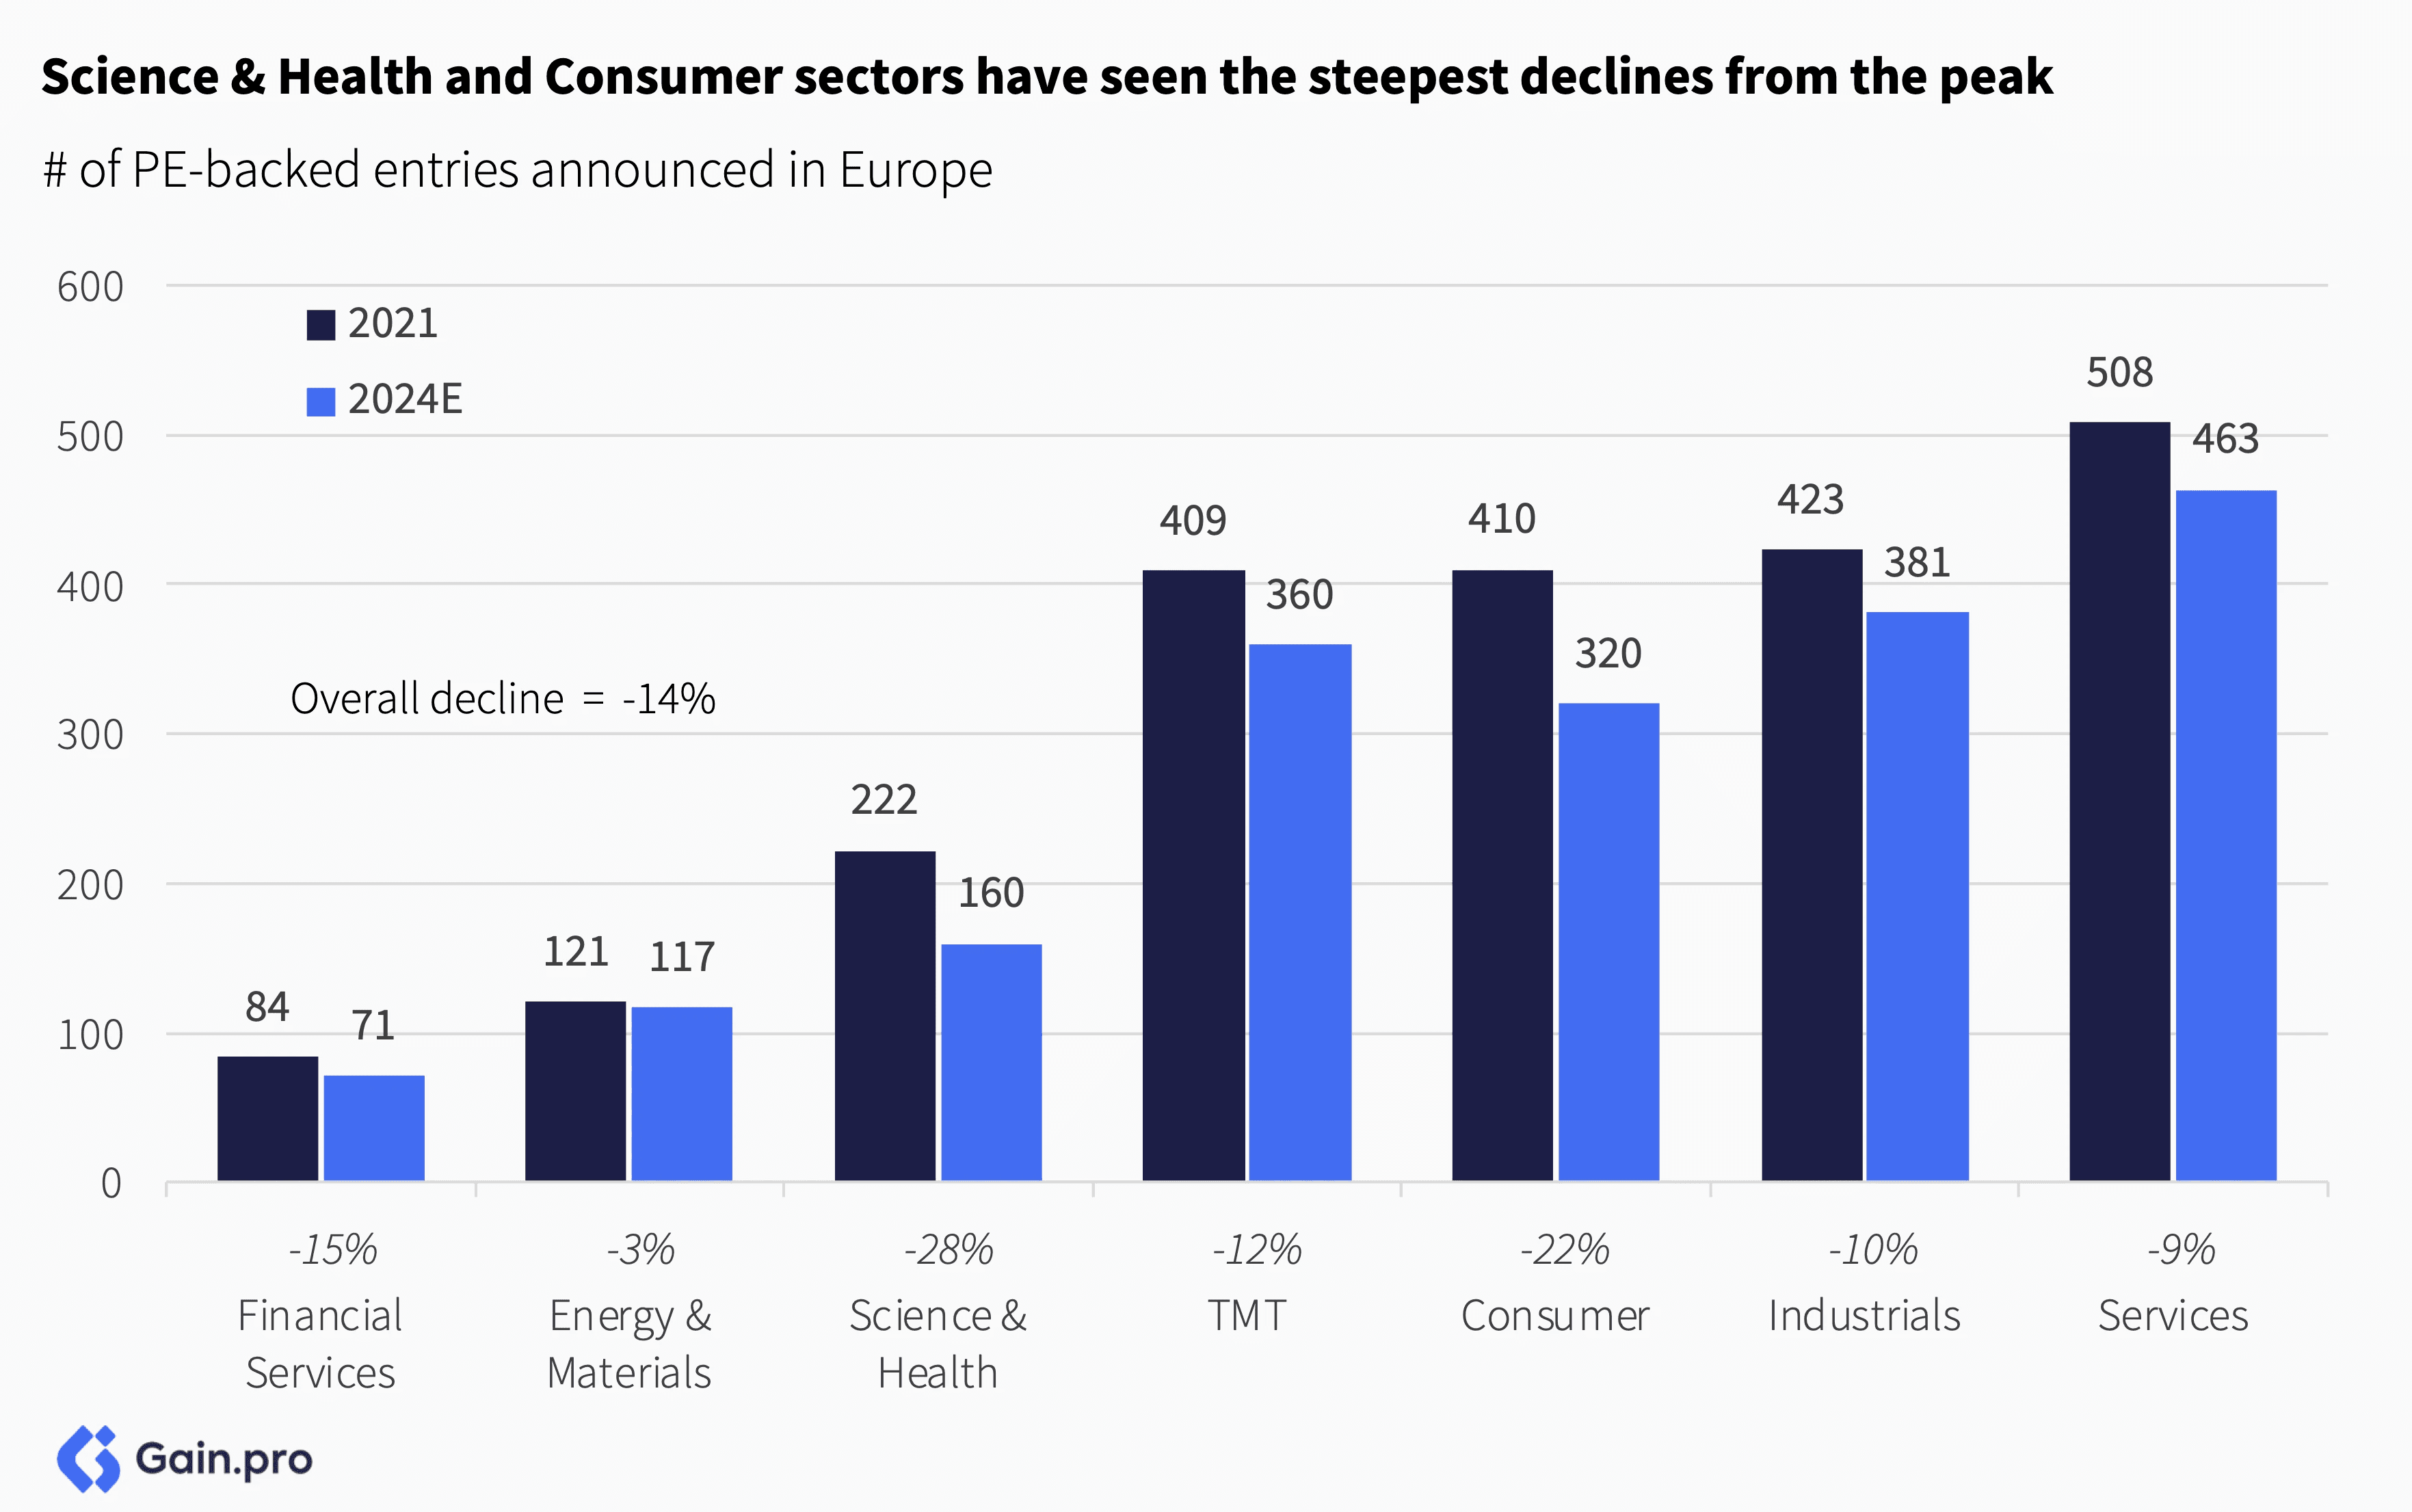
Entries in Energy & Materials (-3%), Services (-9%) and Industrials (-10%) have proved to be more resilient vs. the 2021 peak. Science & Health (-28%) has been the hardest hit driven by regulatory uncertainty, particularly in the German market. Germany's recent reforms, set to be enacted in January 2025, aim to restructure the health sector by reducing the number of hospitals, enhancing clinics and increasing digitization.
Family-to-sponsor (PE) deals are the #1 entry type across sectors, although there are some sectoral differences. The one that stands out is that carve-outs are more popular in Energy & Materials and Industrials, driven by large-scale conglomerates divesting assets to realign their strategic focus.
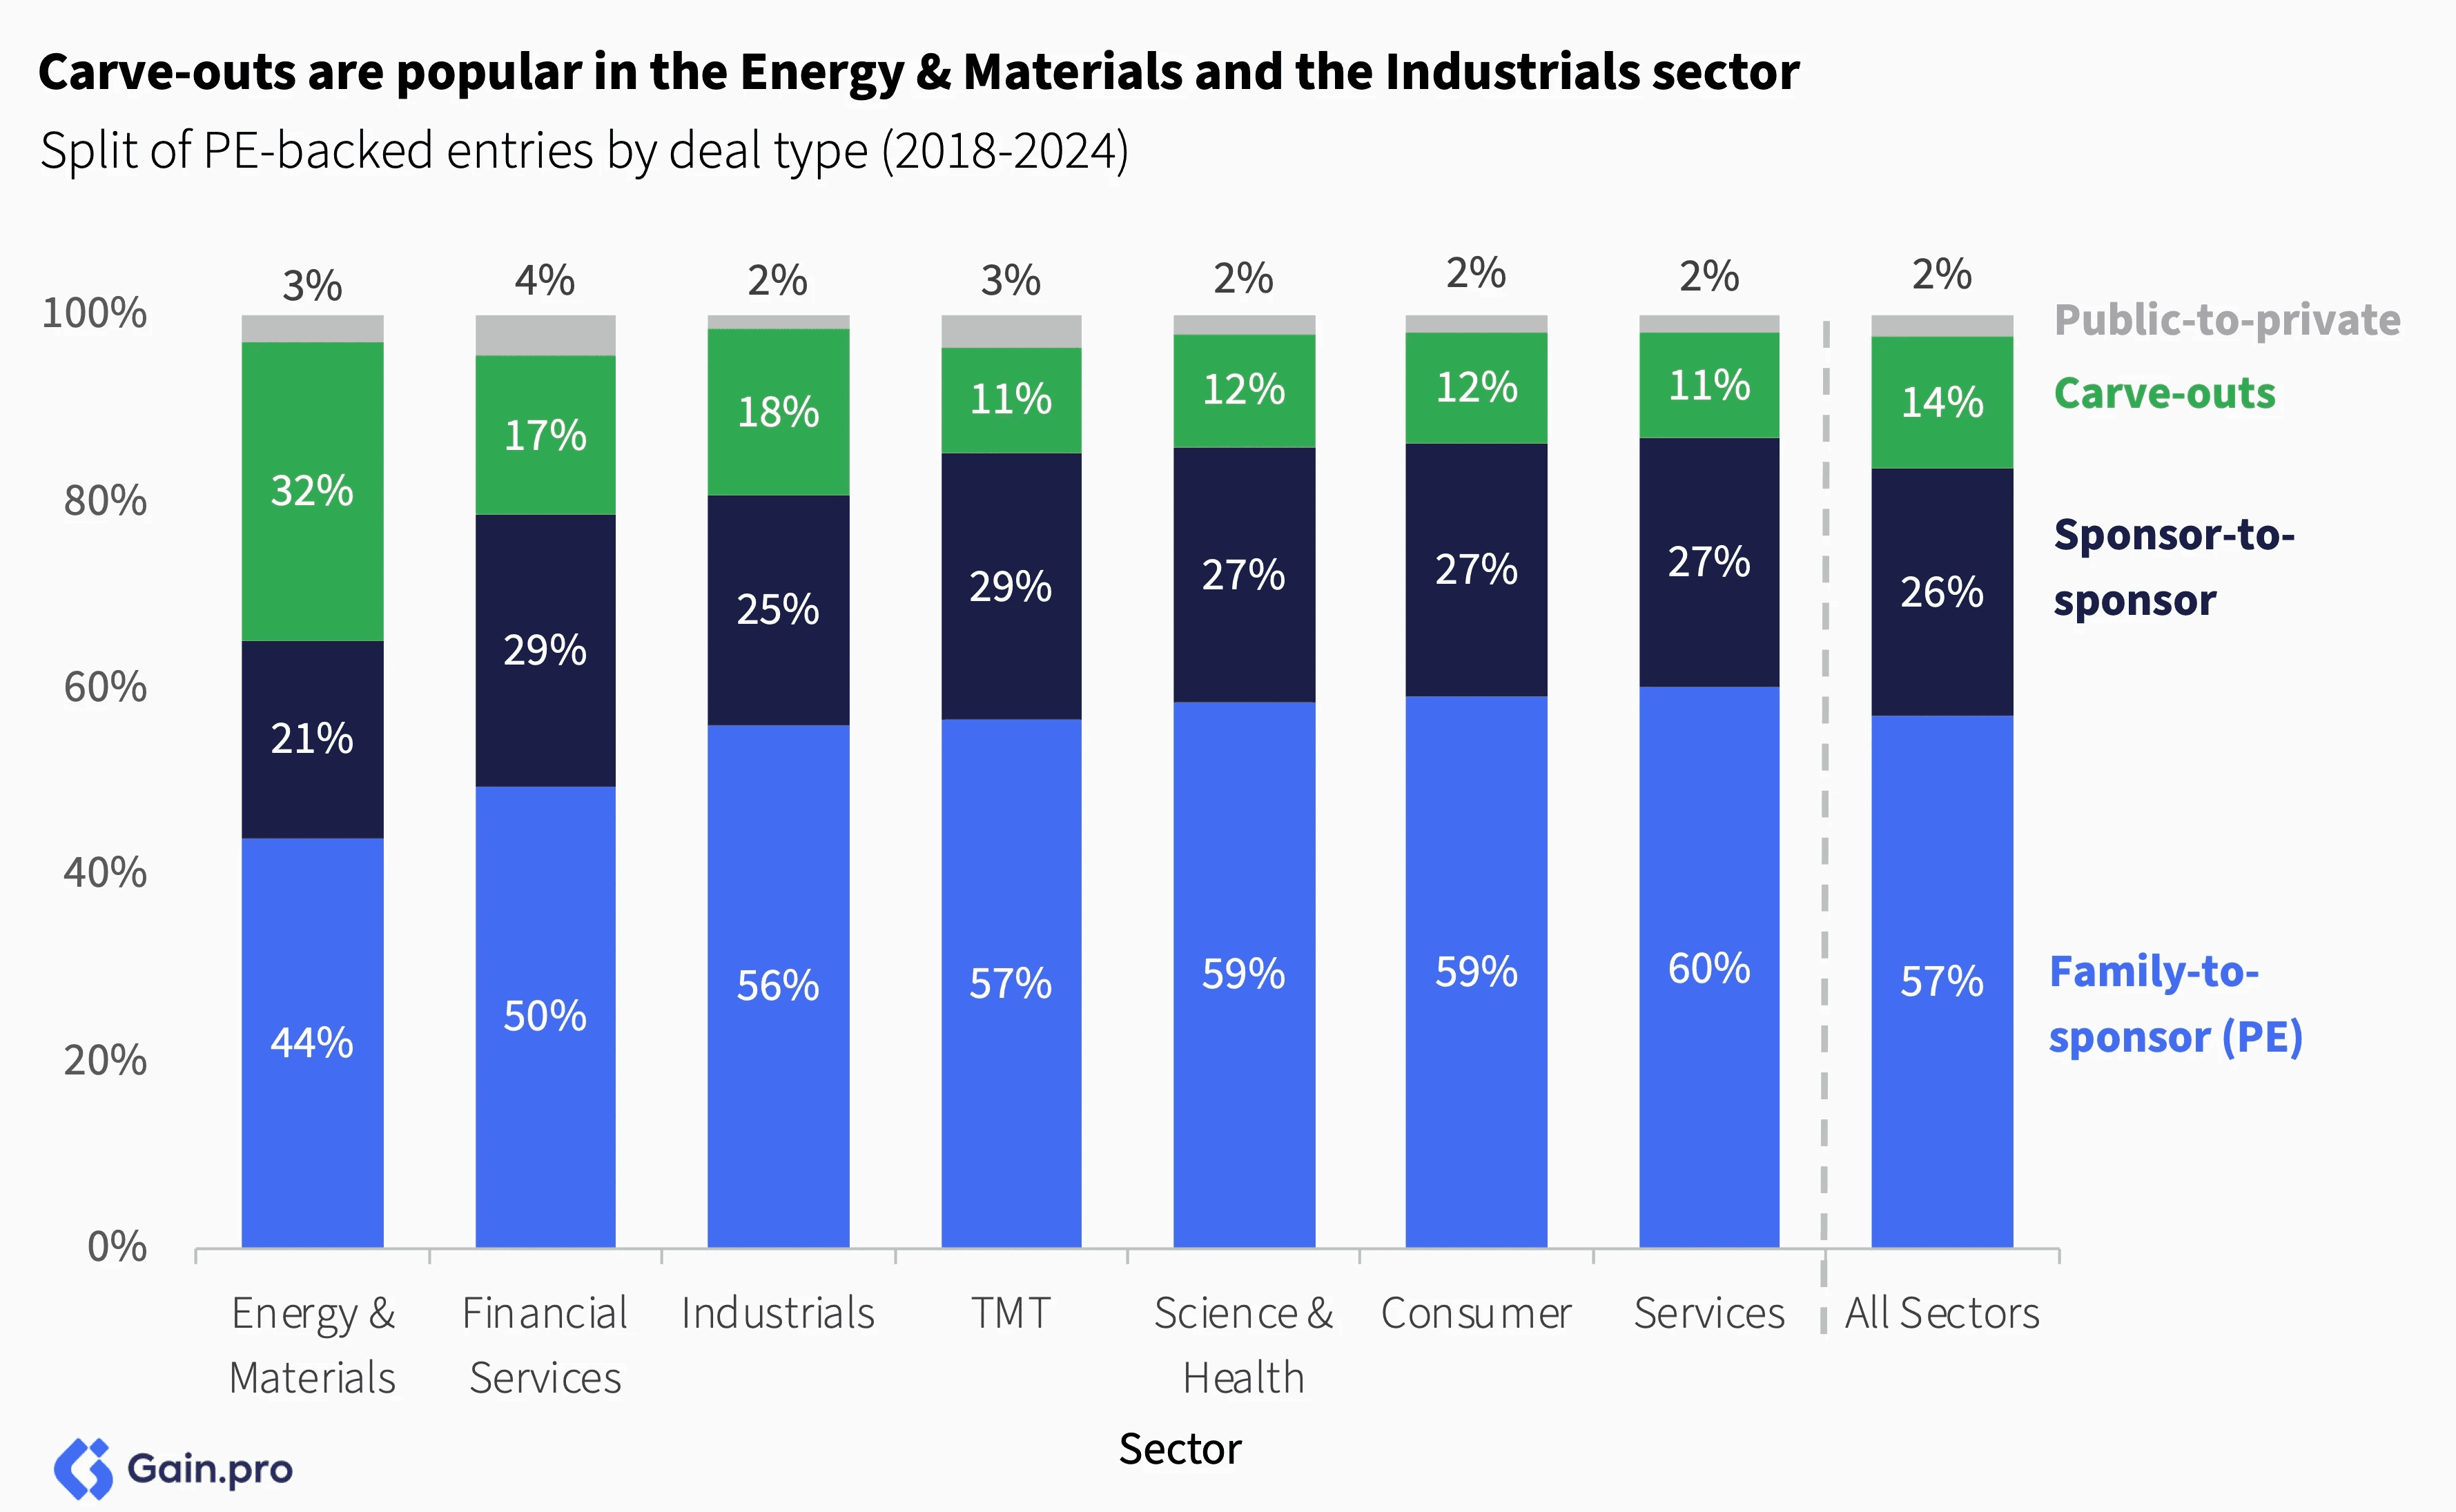
PE-backed entries are larger in the Energy & Materials sector. The larger entry EBITDA in Energy & Materials is driven by the higher share of carve-outs (32% of sector deals), which typically involve larger, well-established business units. In contrast, the Services, TMT and Consumer sectors have a higher share of primary deals, resulting in smaller EBITDA entries (<€50m in EBITDA).

Entries by Region
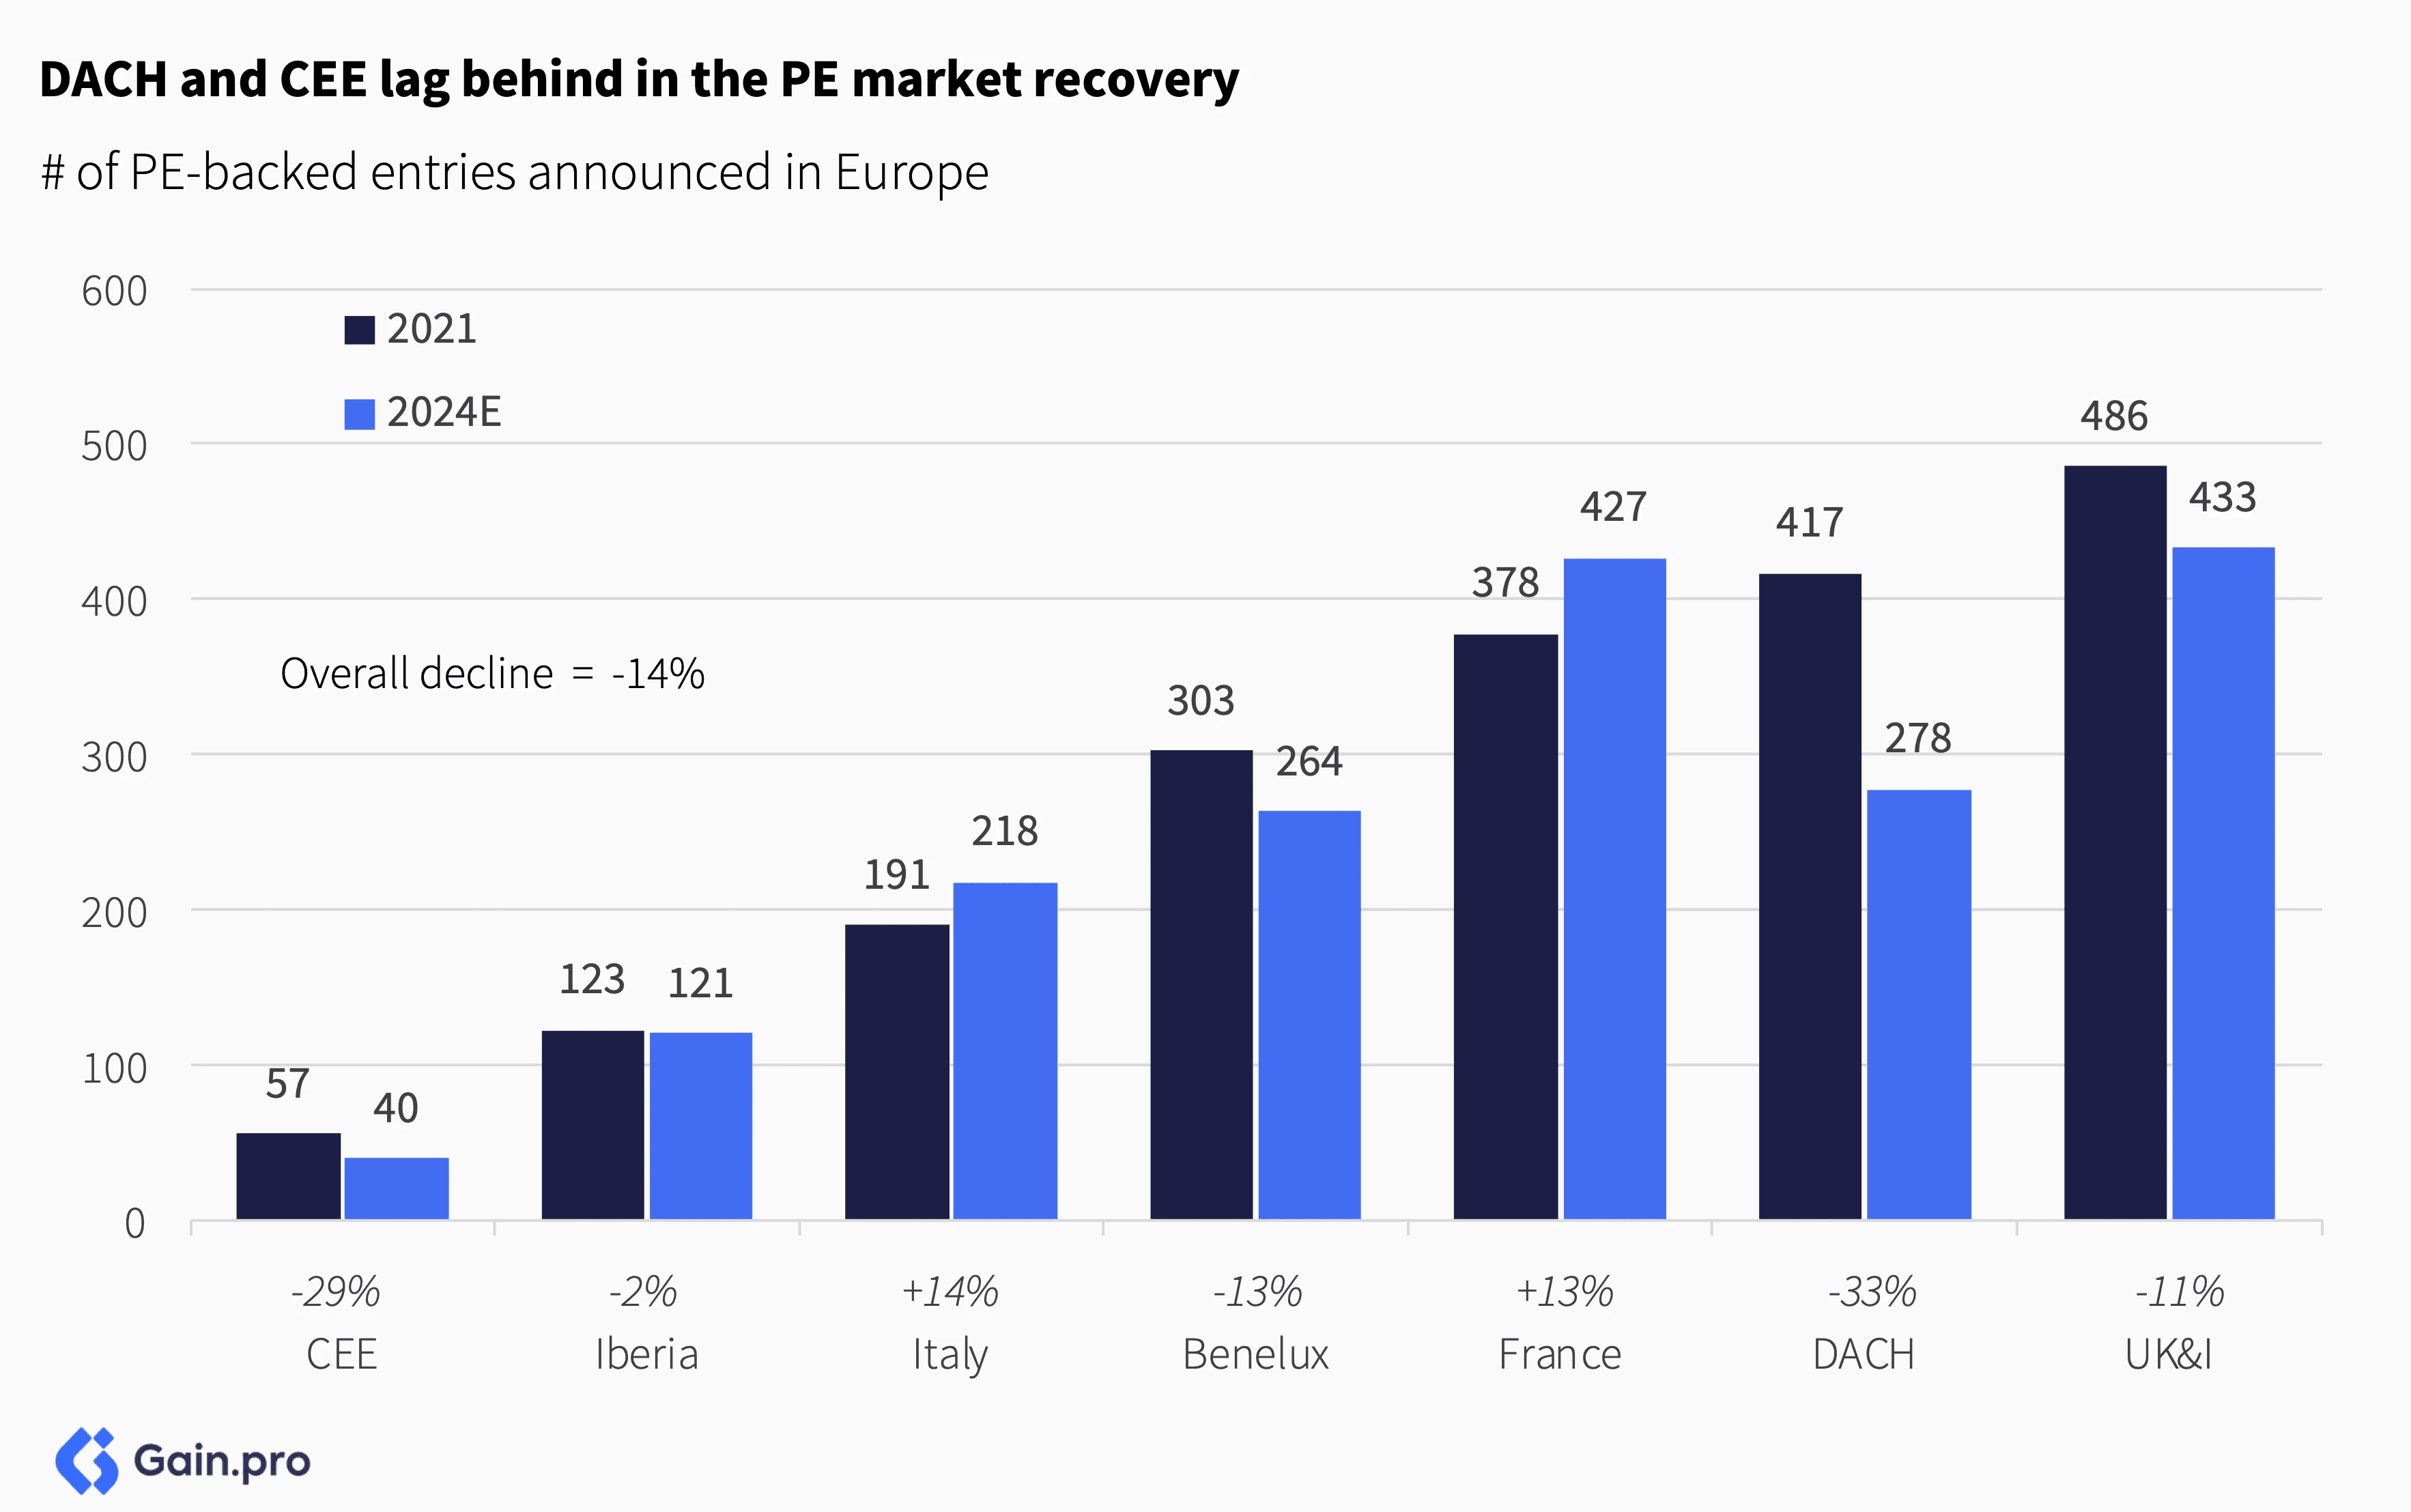
DACH and CEE lag in the PE market recovery (-30% vs 2021 peak). In contrast, regions like Italy (+14%) and France (+13%) are doing much better.
Family-to-sponsor (PE) deals dominate entries across regions. France is distinctive, with 35% of all entries being sponsor-to-sponsor deals (compared to 27% across Europe). This aligns with France's high PE penetration rates, which naturally result in a greater share of investor-to-investor transactions.
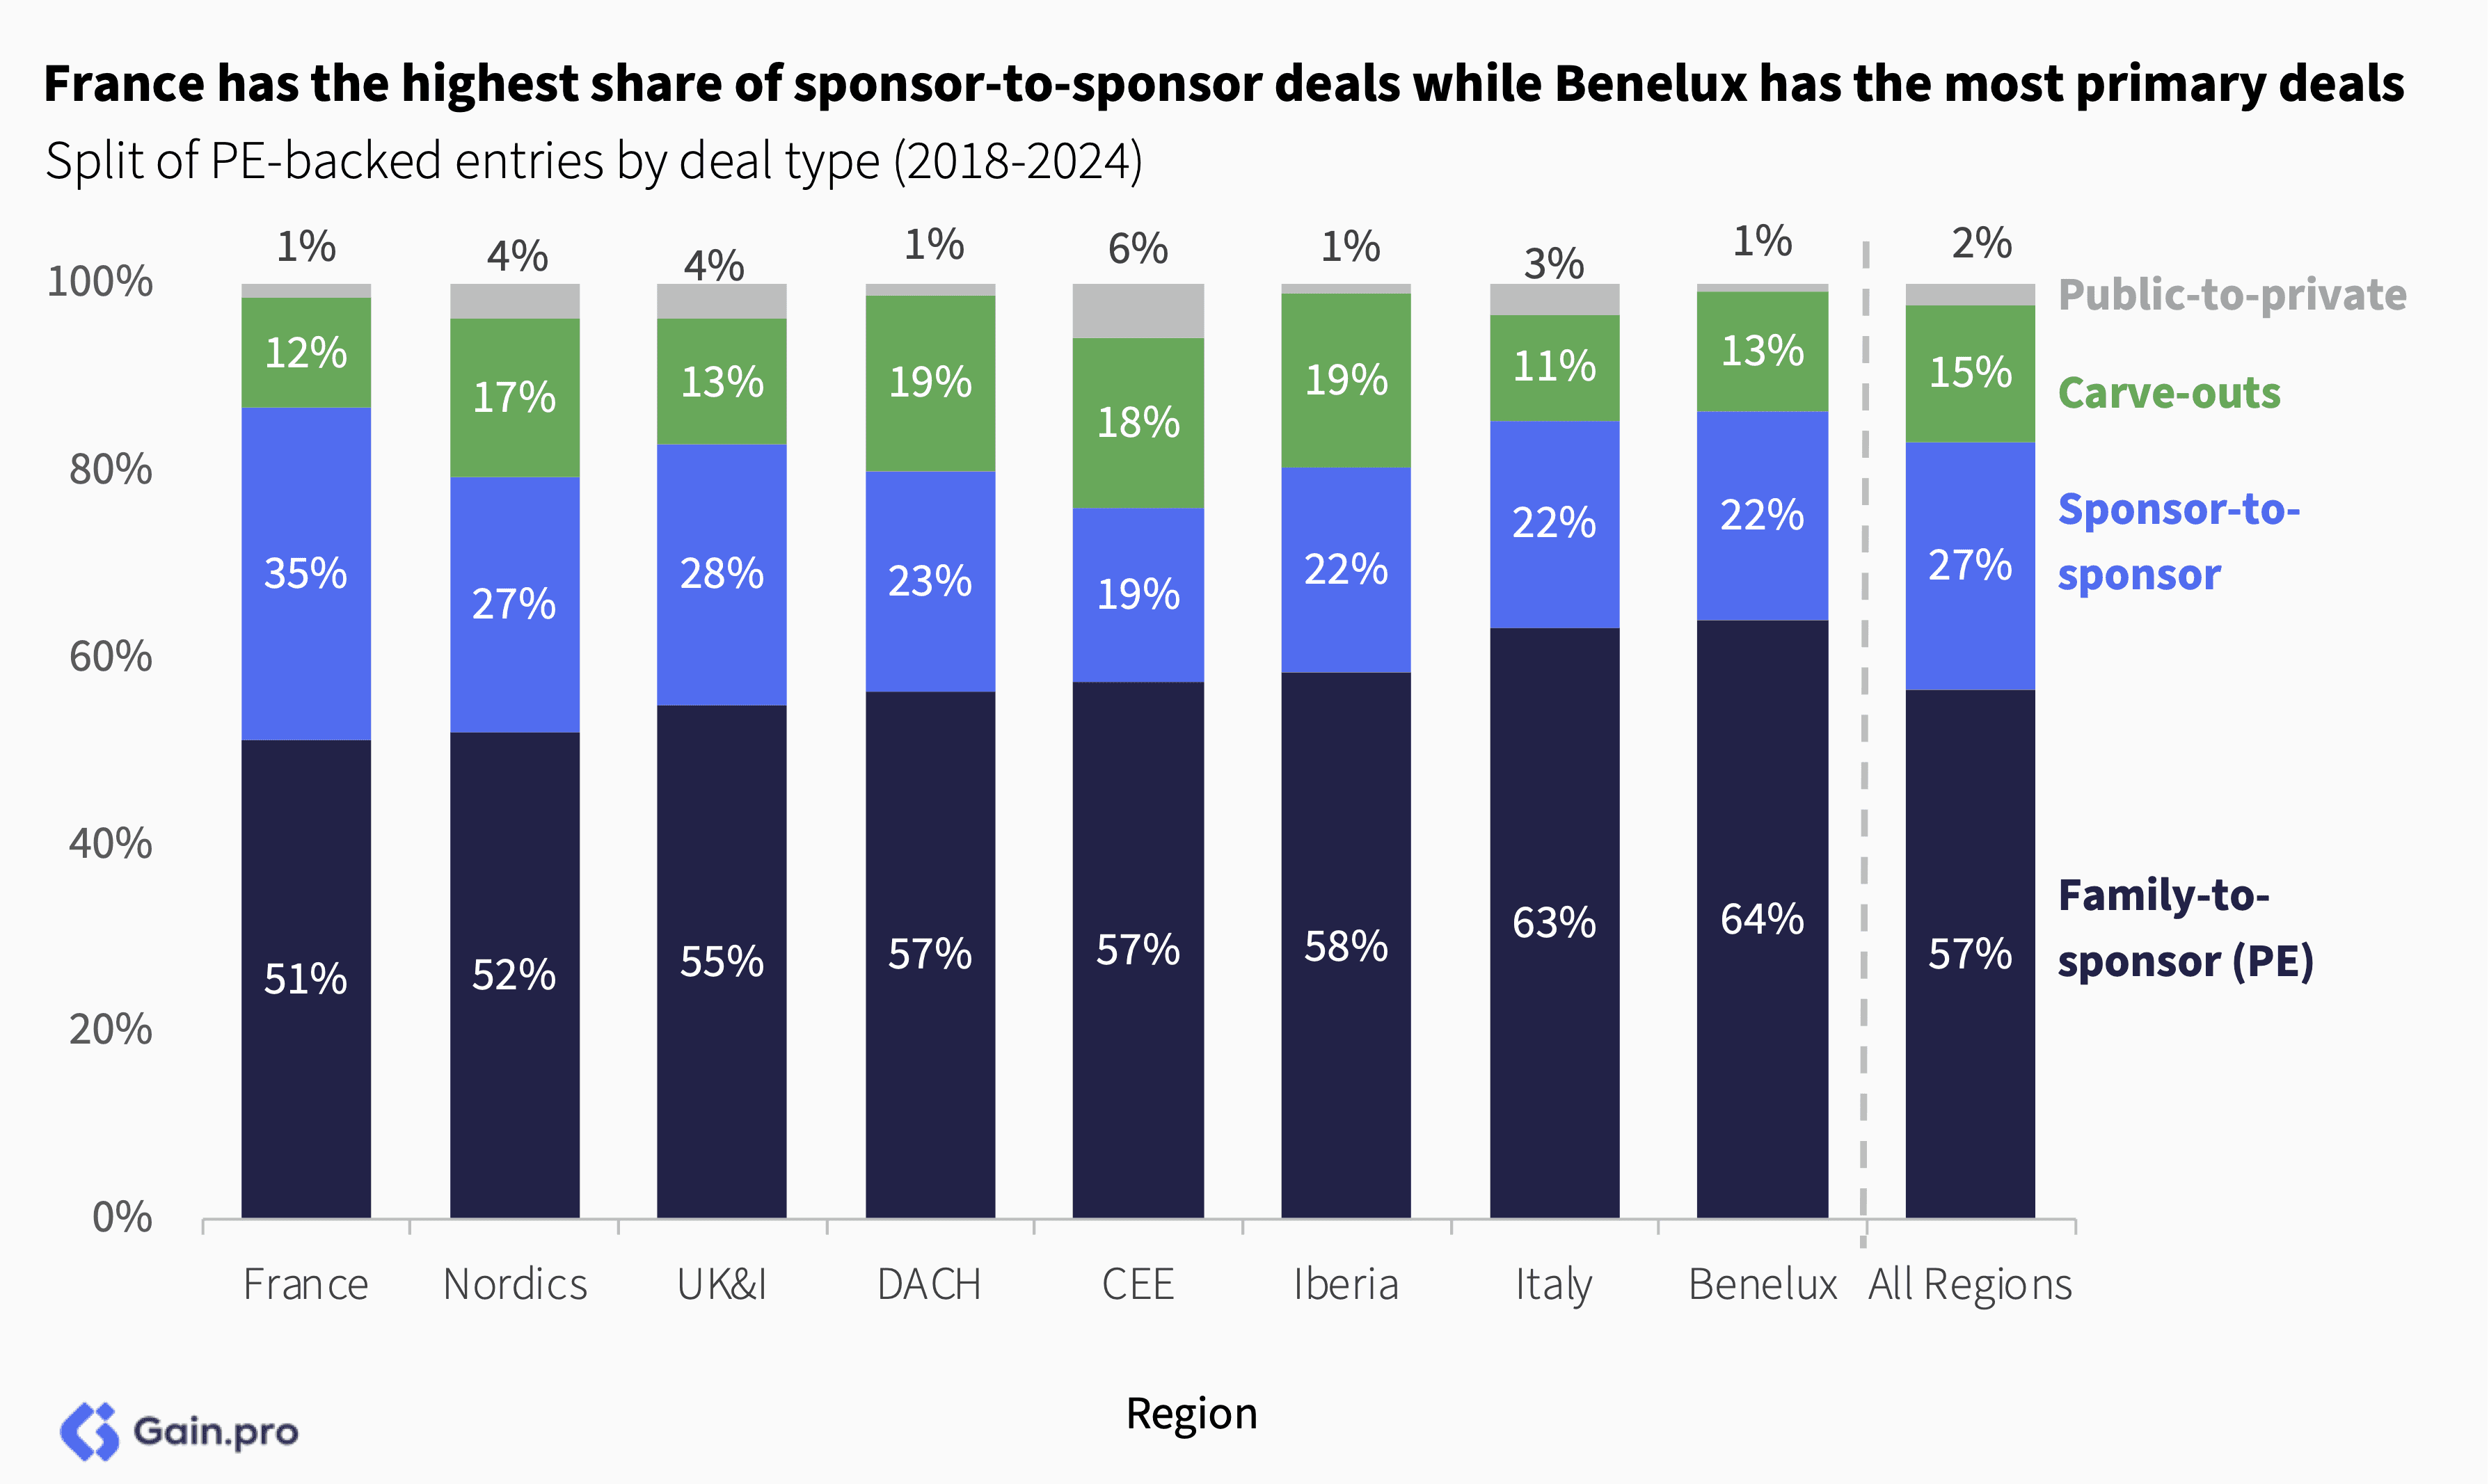
France stands out as a big market for minority stakes as well, with many co-investors in a single asset. 51% of PE-backed entries in France were minority stakes (compared to just 20% in DACH, 28% in Benelux and 35% in the UK).

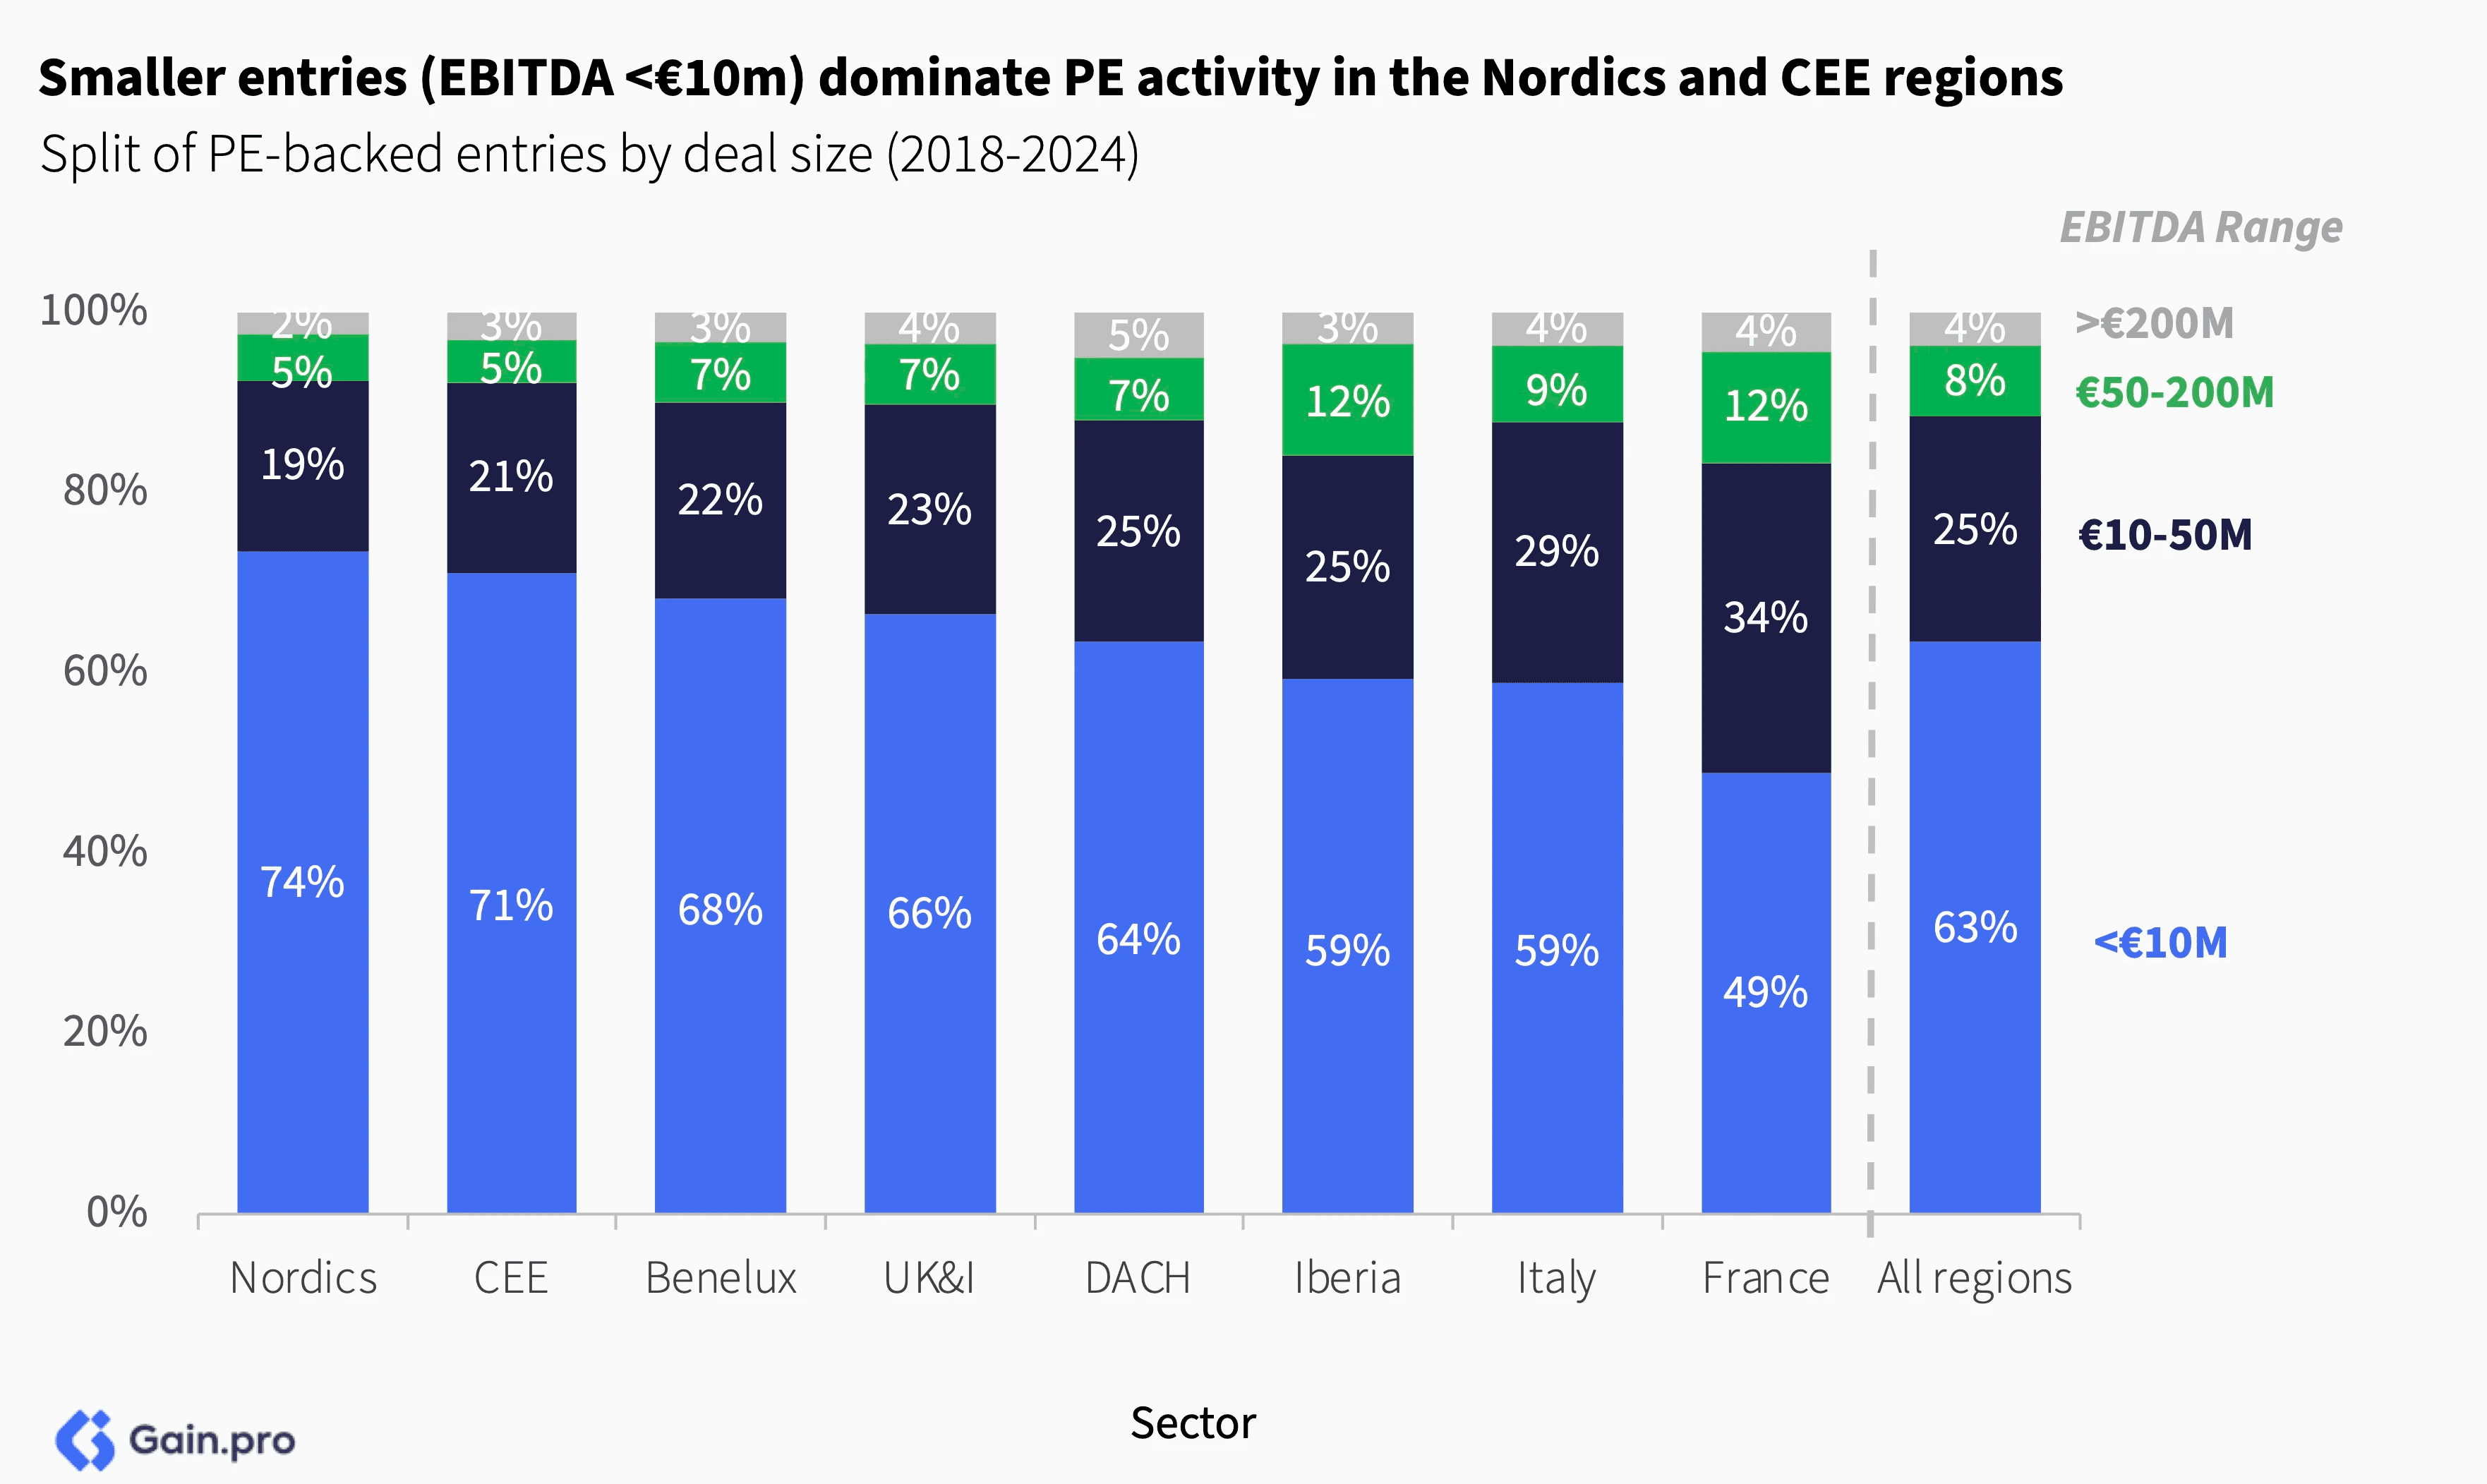
Smaller deals dominate PE entries in the Nordics and CEE regions. France again stands out as a region with a strong mid-market, with 34% of PE entries in France in the €10-50m EBITDA range (vs. 25% for Europe).
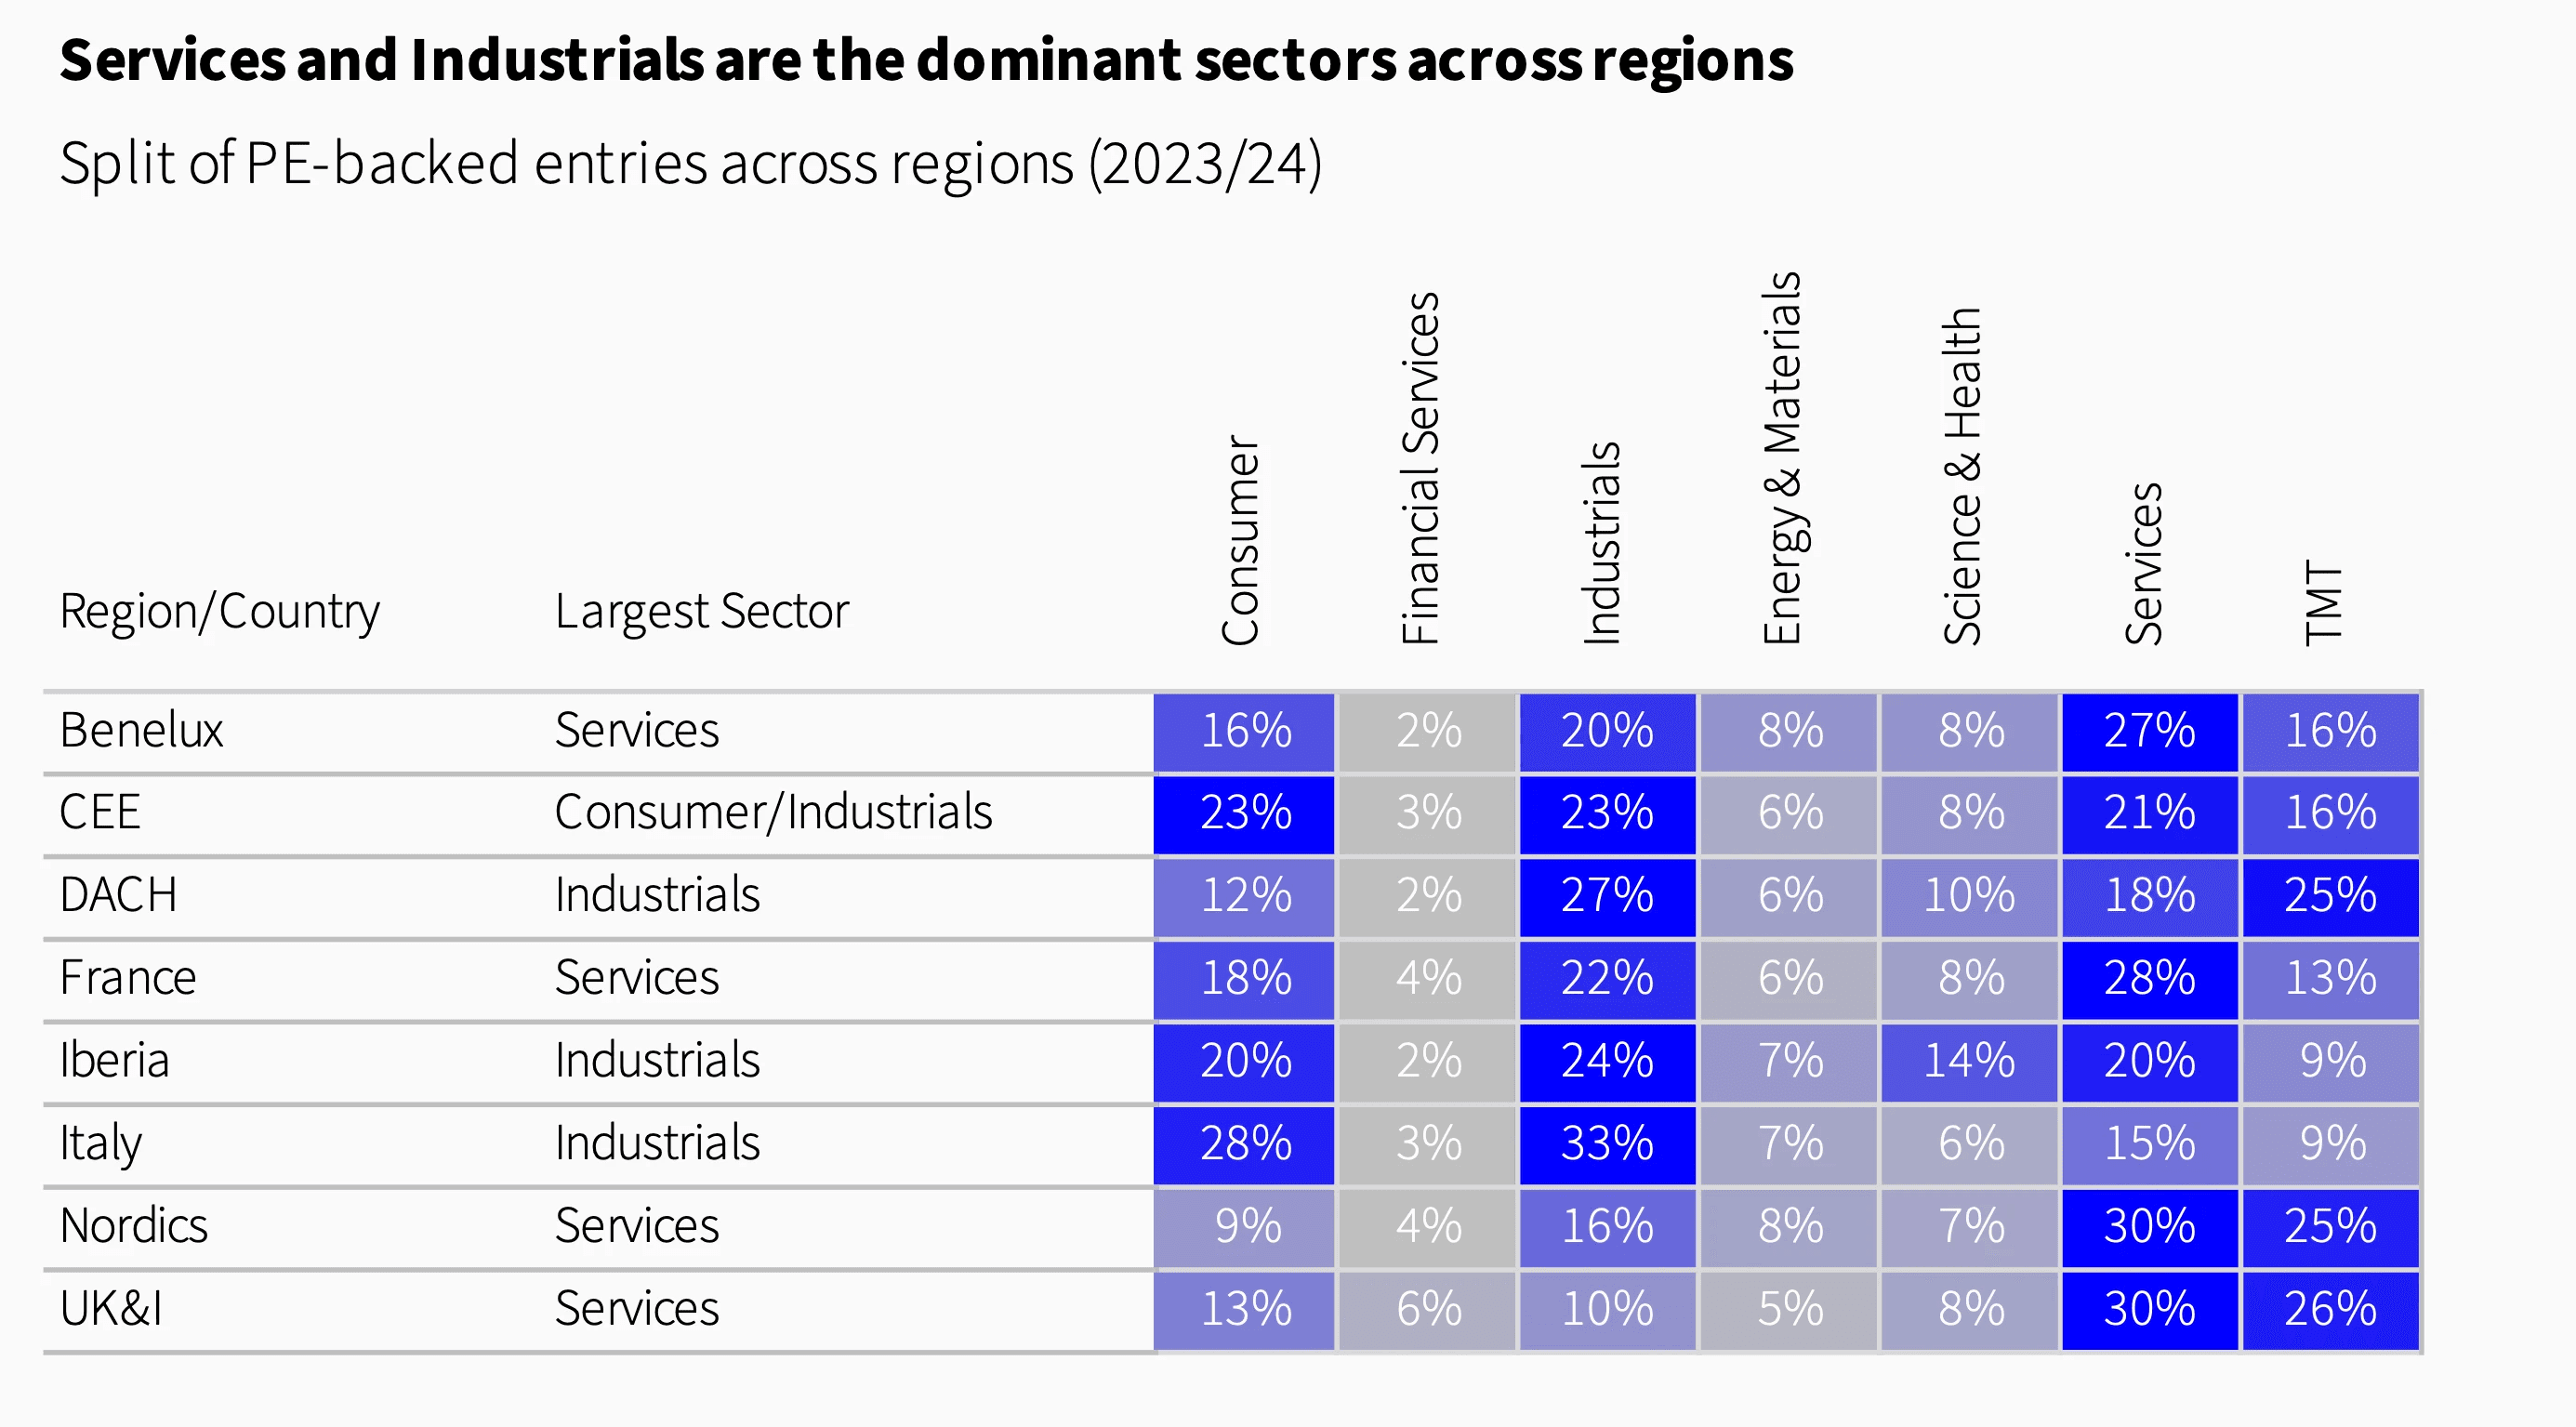
Services and Industrials are the dominant sectors across regions. TMT ranks as the second-largest sector in UK&I, the Nordics and DACH but it remains notably underrepresented in Iberia and Italy.
Cross-Border Activity
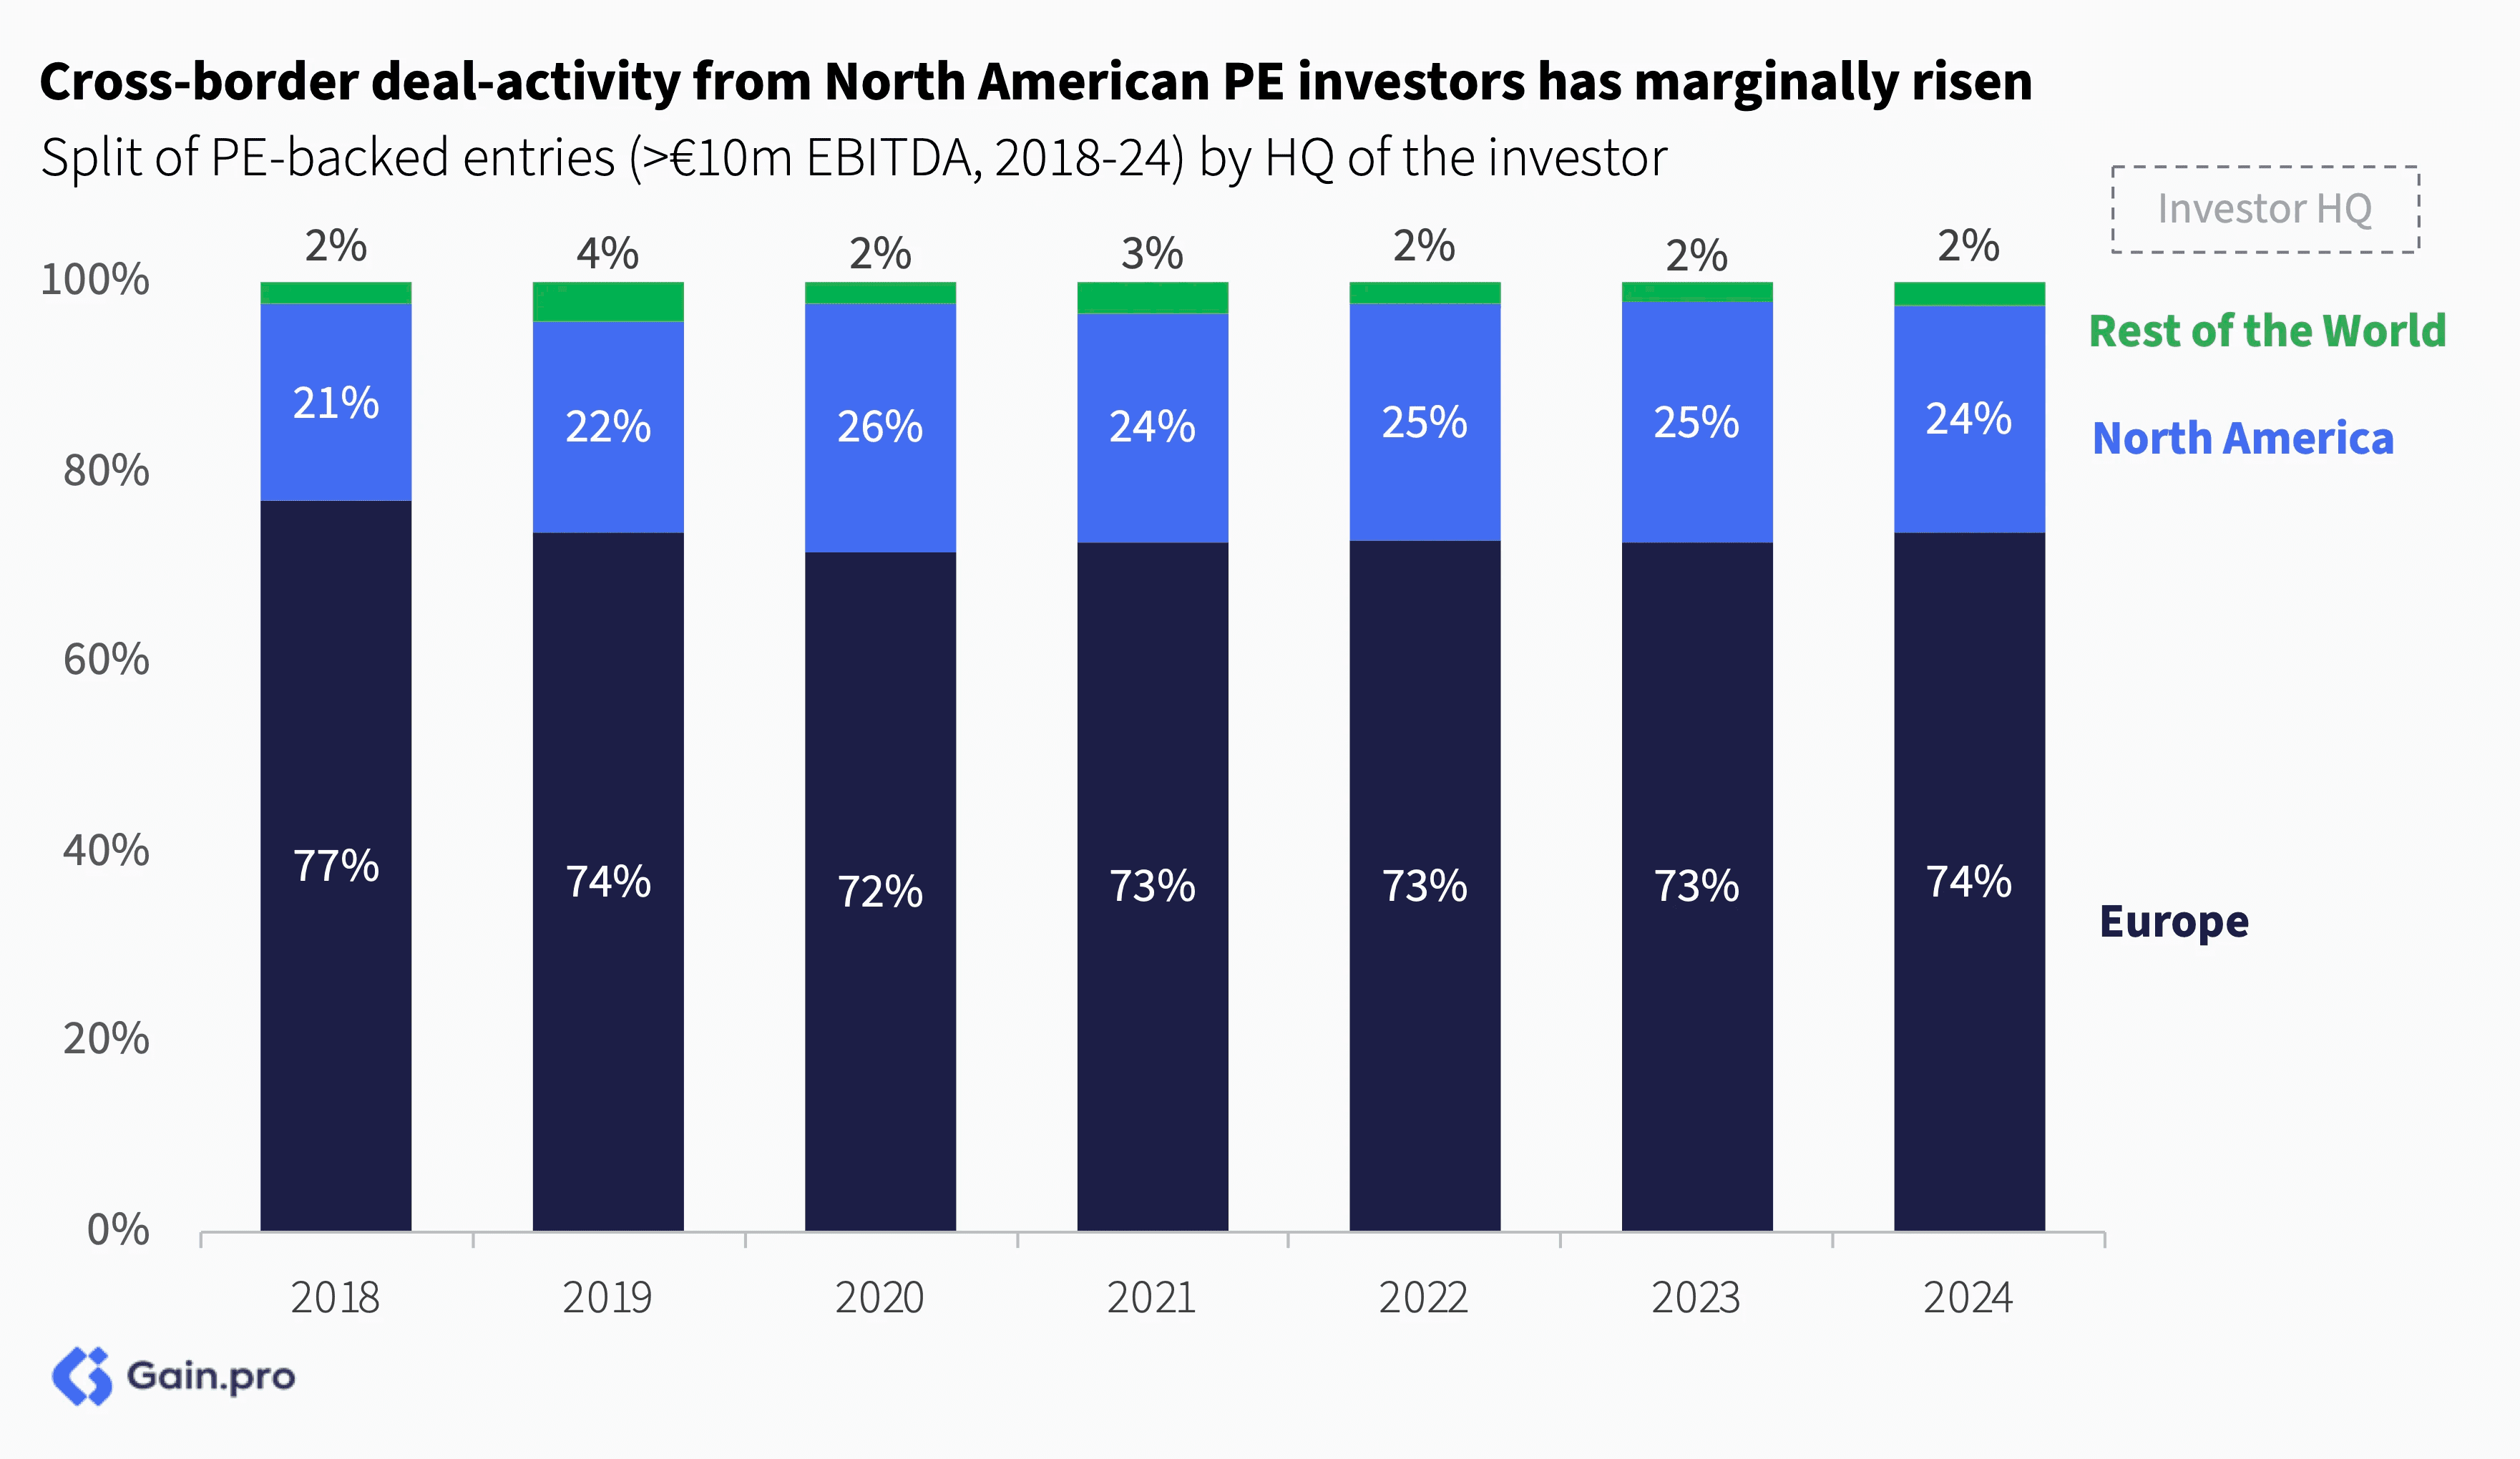
Cross-border deal activity from North American investors has marginally risen, up by +3pp in the last 6 years. In addition to lower multiples, the strength of USD ($) has also made investments in European assets more attractive. To add to it, US HQ’d funds have had stronger fundraising momentum, allowing them to outcompete in many deal situations.
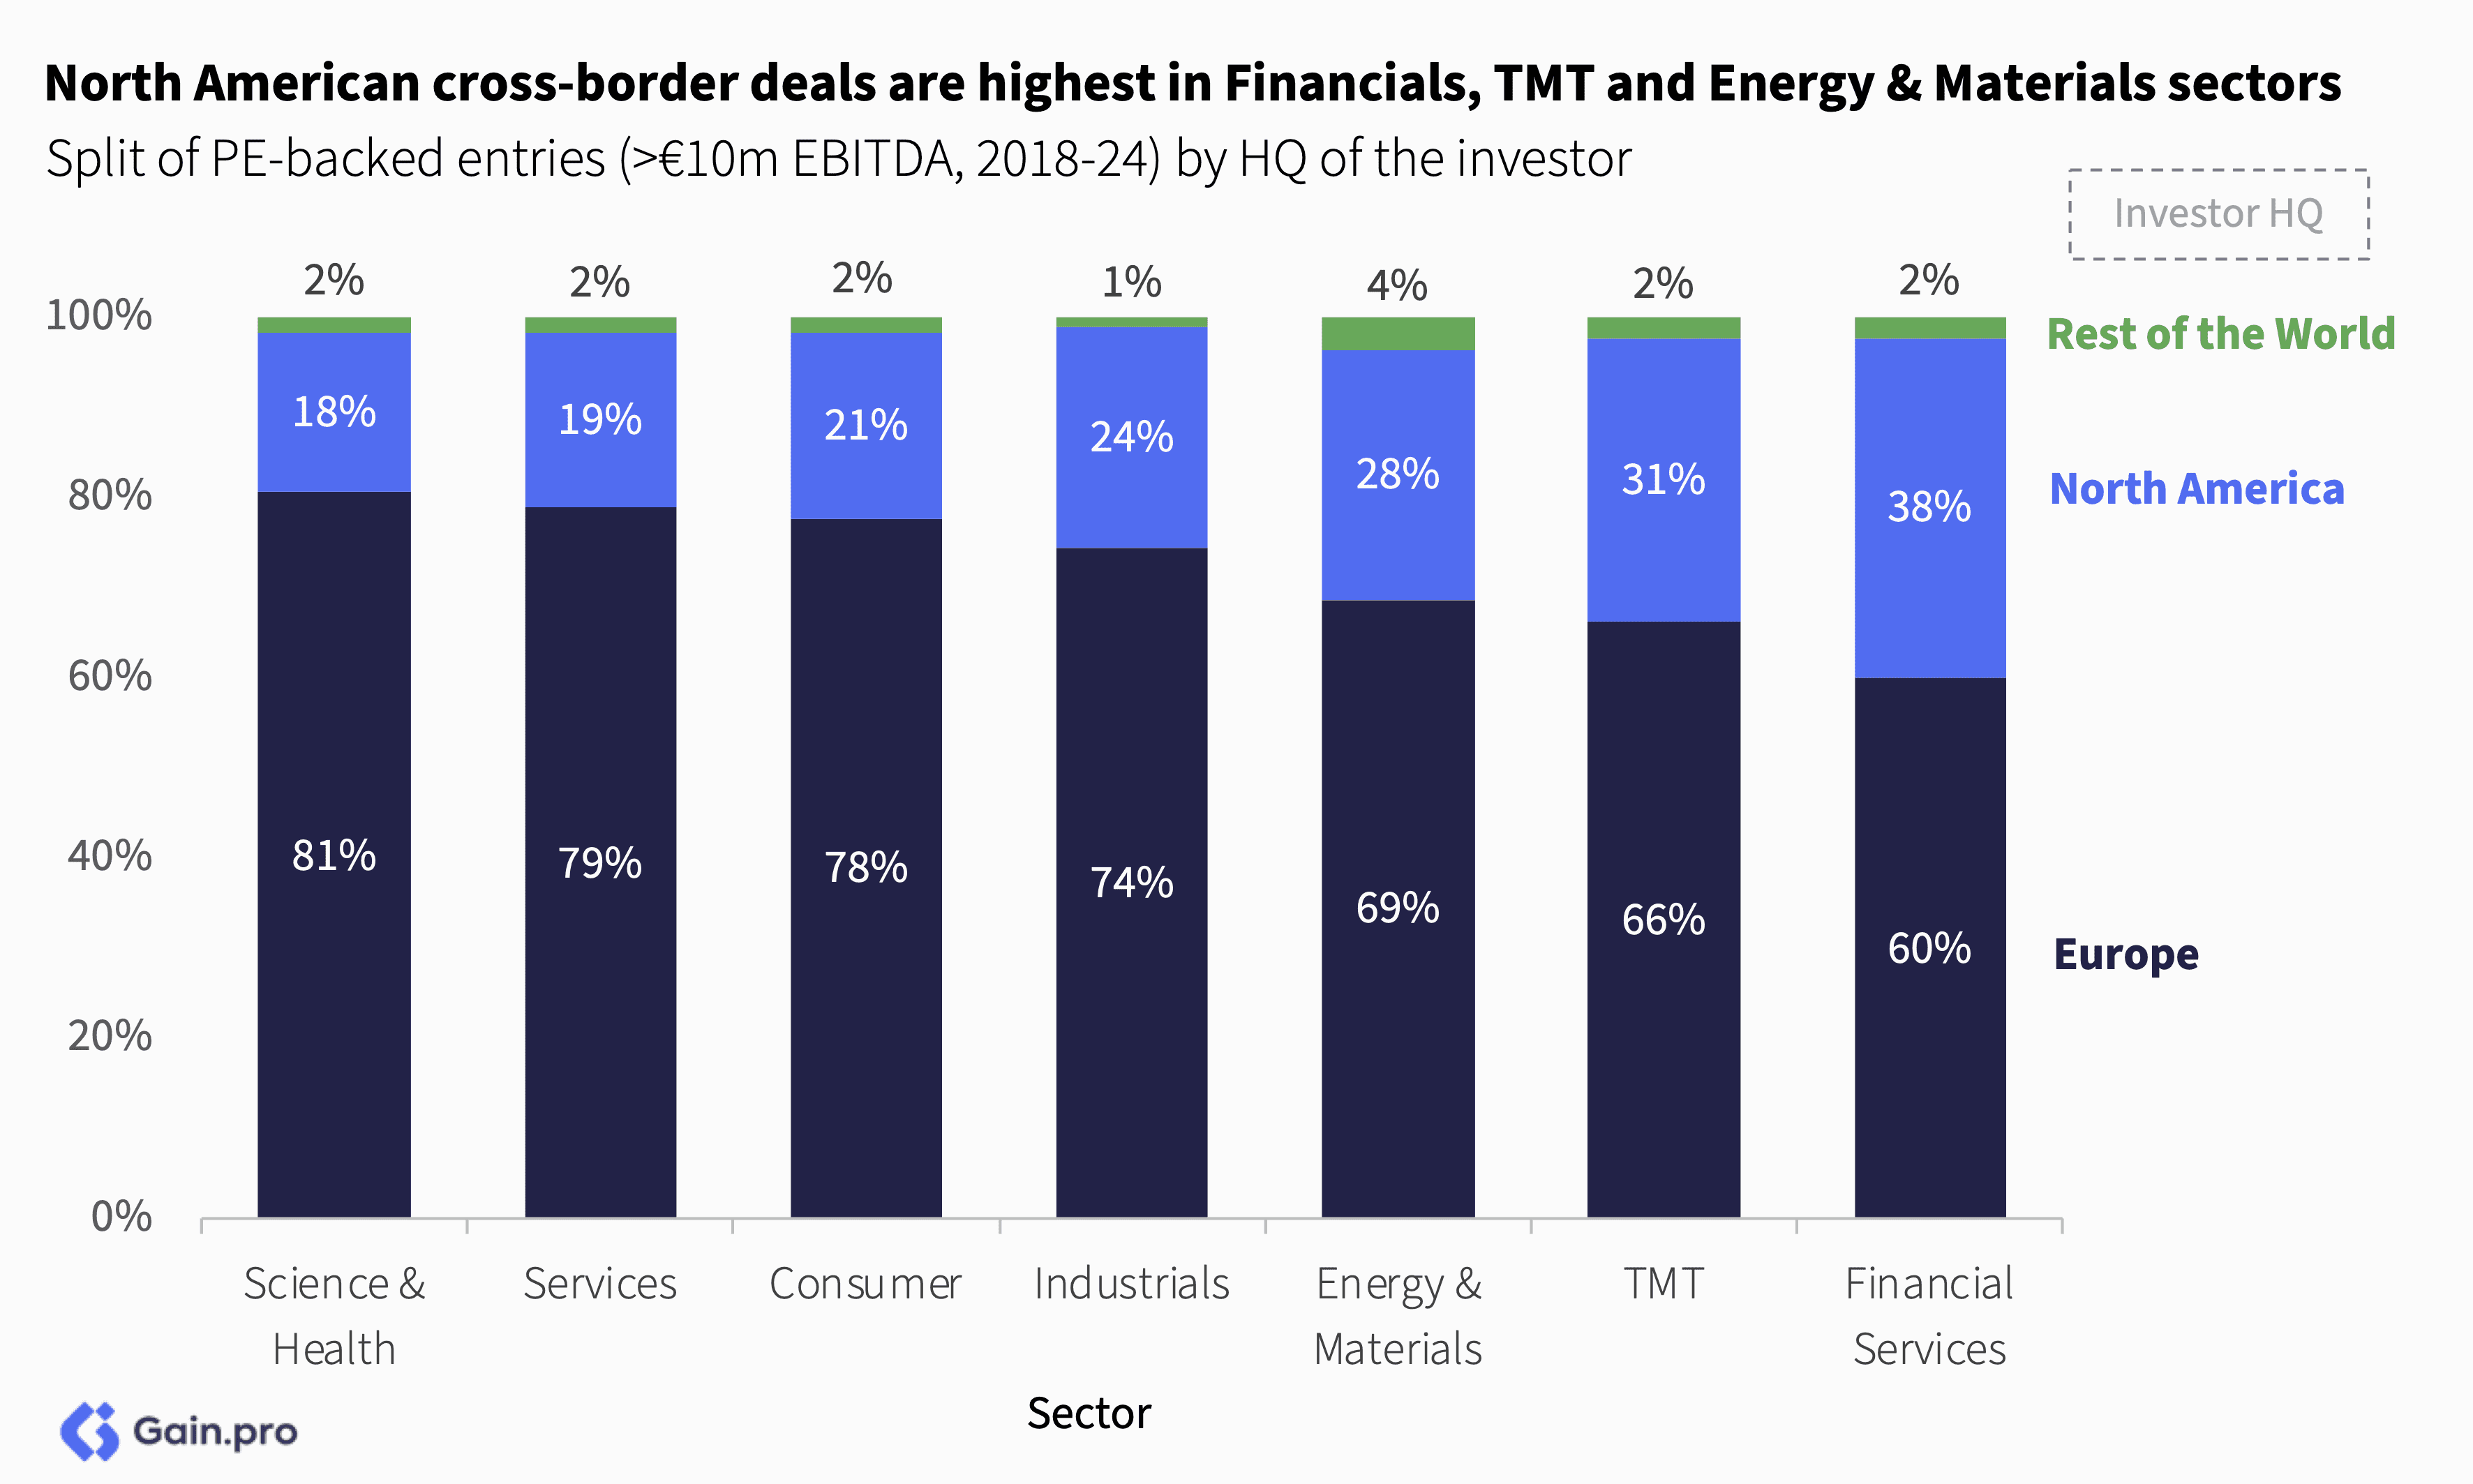
North American investors account for 38% of larger transactions (>€200m EBITDA). European investors dominate the small-to-mid-sized segment, accounting for over >90% of deals with EBITDA less than €10m.

North American investors make up for a larger share of entries in Financial Services (38%), TMT (31%) and Energy & Materials (28%). In contrast, European investors dominate investments in Services, Industrials, Consumer and Science & Health due to their localized nature, smaller sizes and regulatory challenges.
Cross-border PE activity is higher in UK&I, DACH and Iberia compared to other European regions. France, in contrast, has a very limited presence of international investors, with only 16% of entries over €10m in EBITDA carried out by investors with their HQ outside of France.

Chapter 02: Buy-and-Build
Overall Trend
Add-on deal activity in Europe is slightly muted compared to previous years. Even after estimating for reporting delays and annualizing the data, we expect add-on activity levels to be down ~14% yoy. Services was still the largest sector for add-ons (43% of deals), followed by TMT (18%) and Industrials (15%).

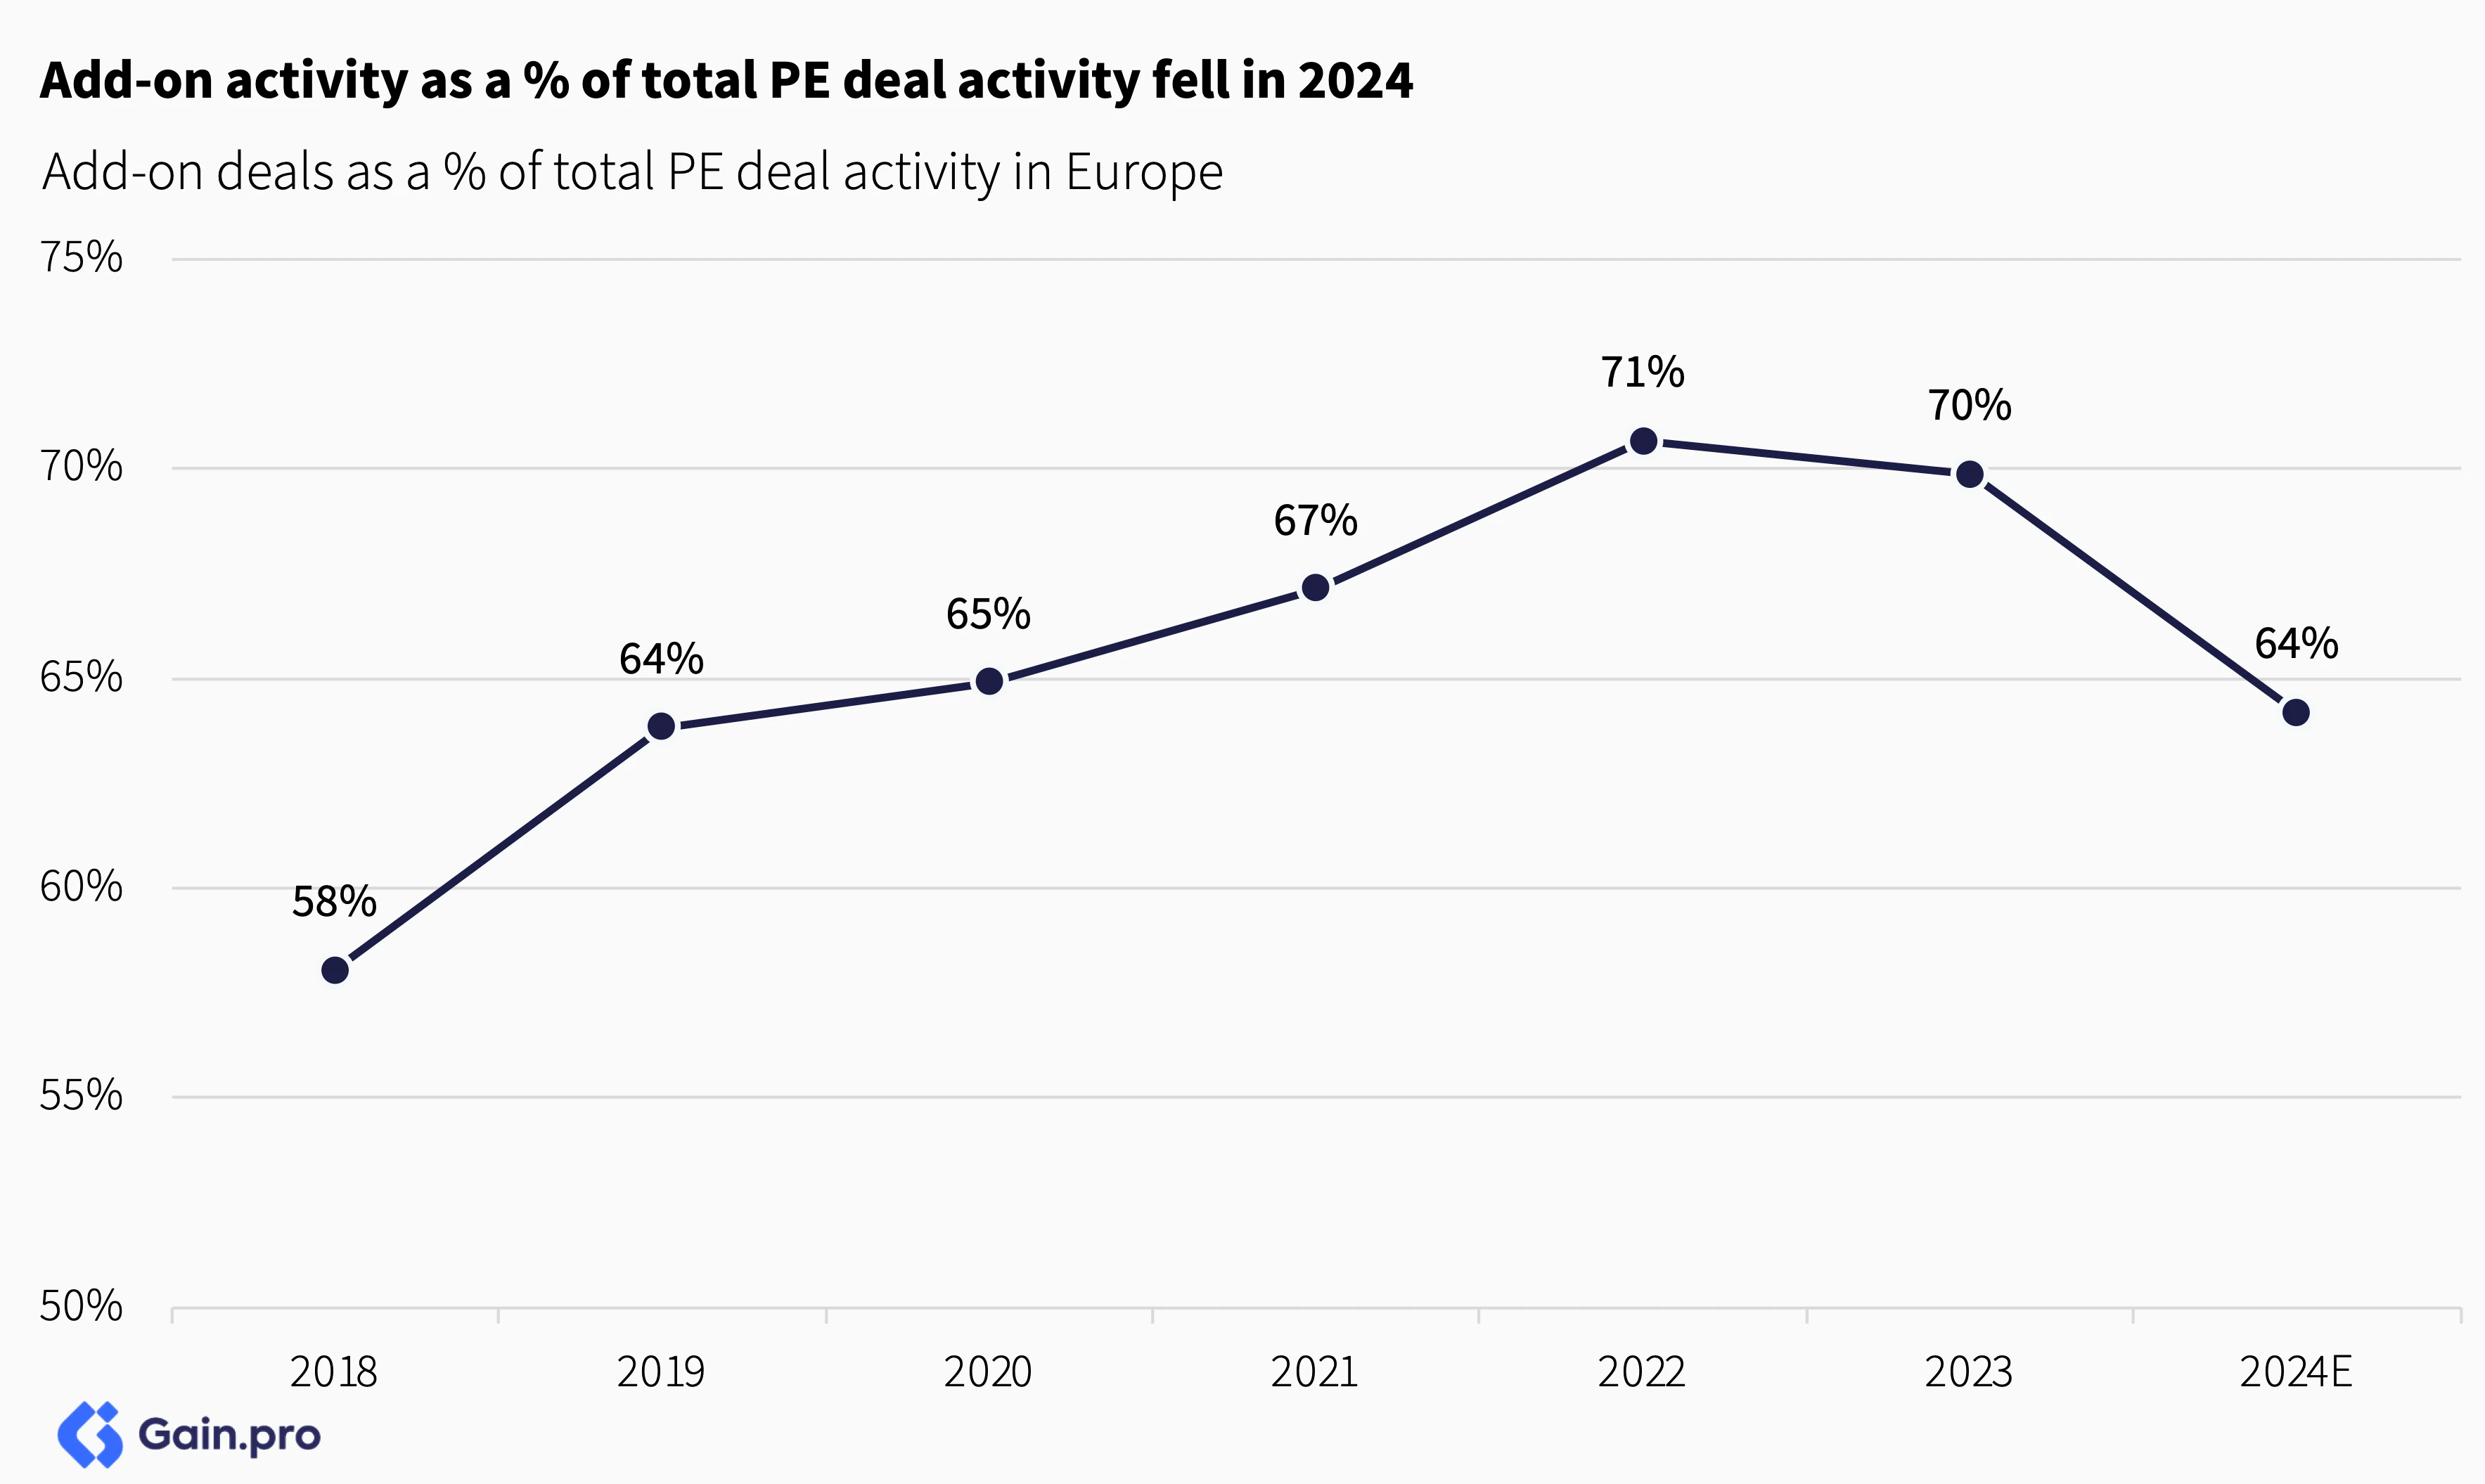
2024 also marks the first year in a long time where add-ons as a percentage of total activity declined. With the narrowing gap between PE platform and add-on multiples, investors focused their attention on acquiring platforms.
Why Buy-and-Build?
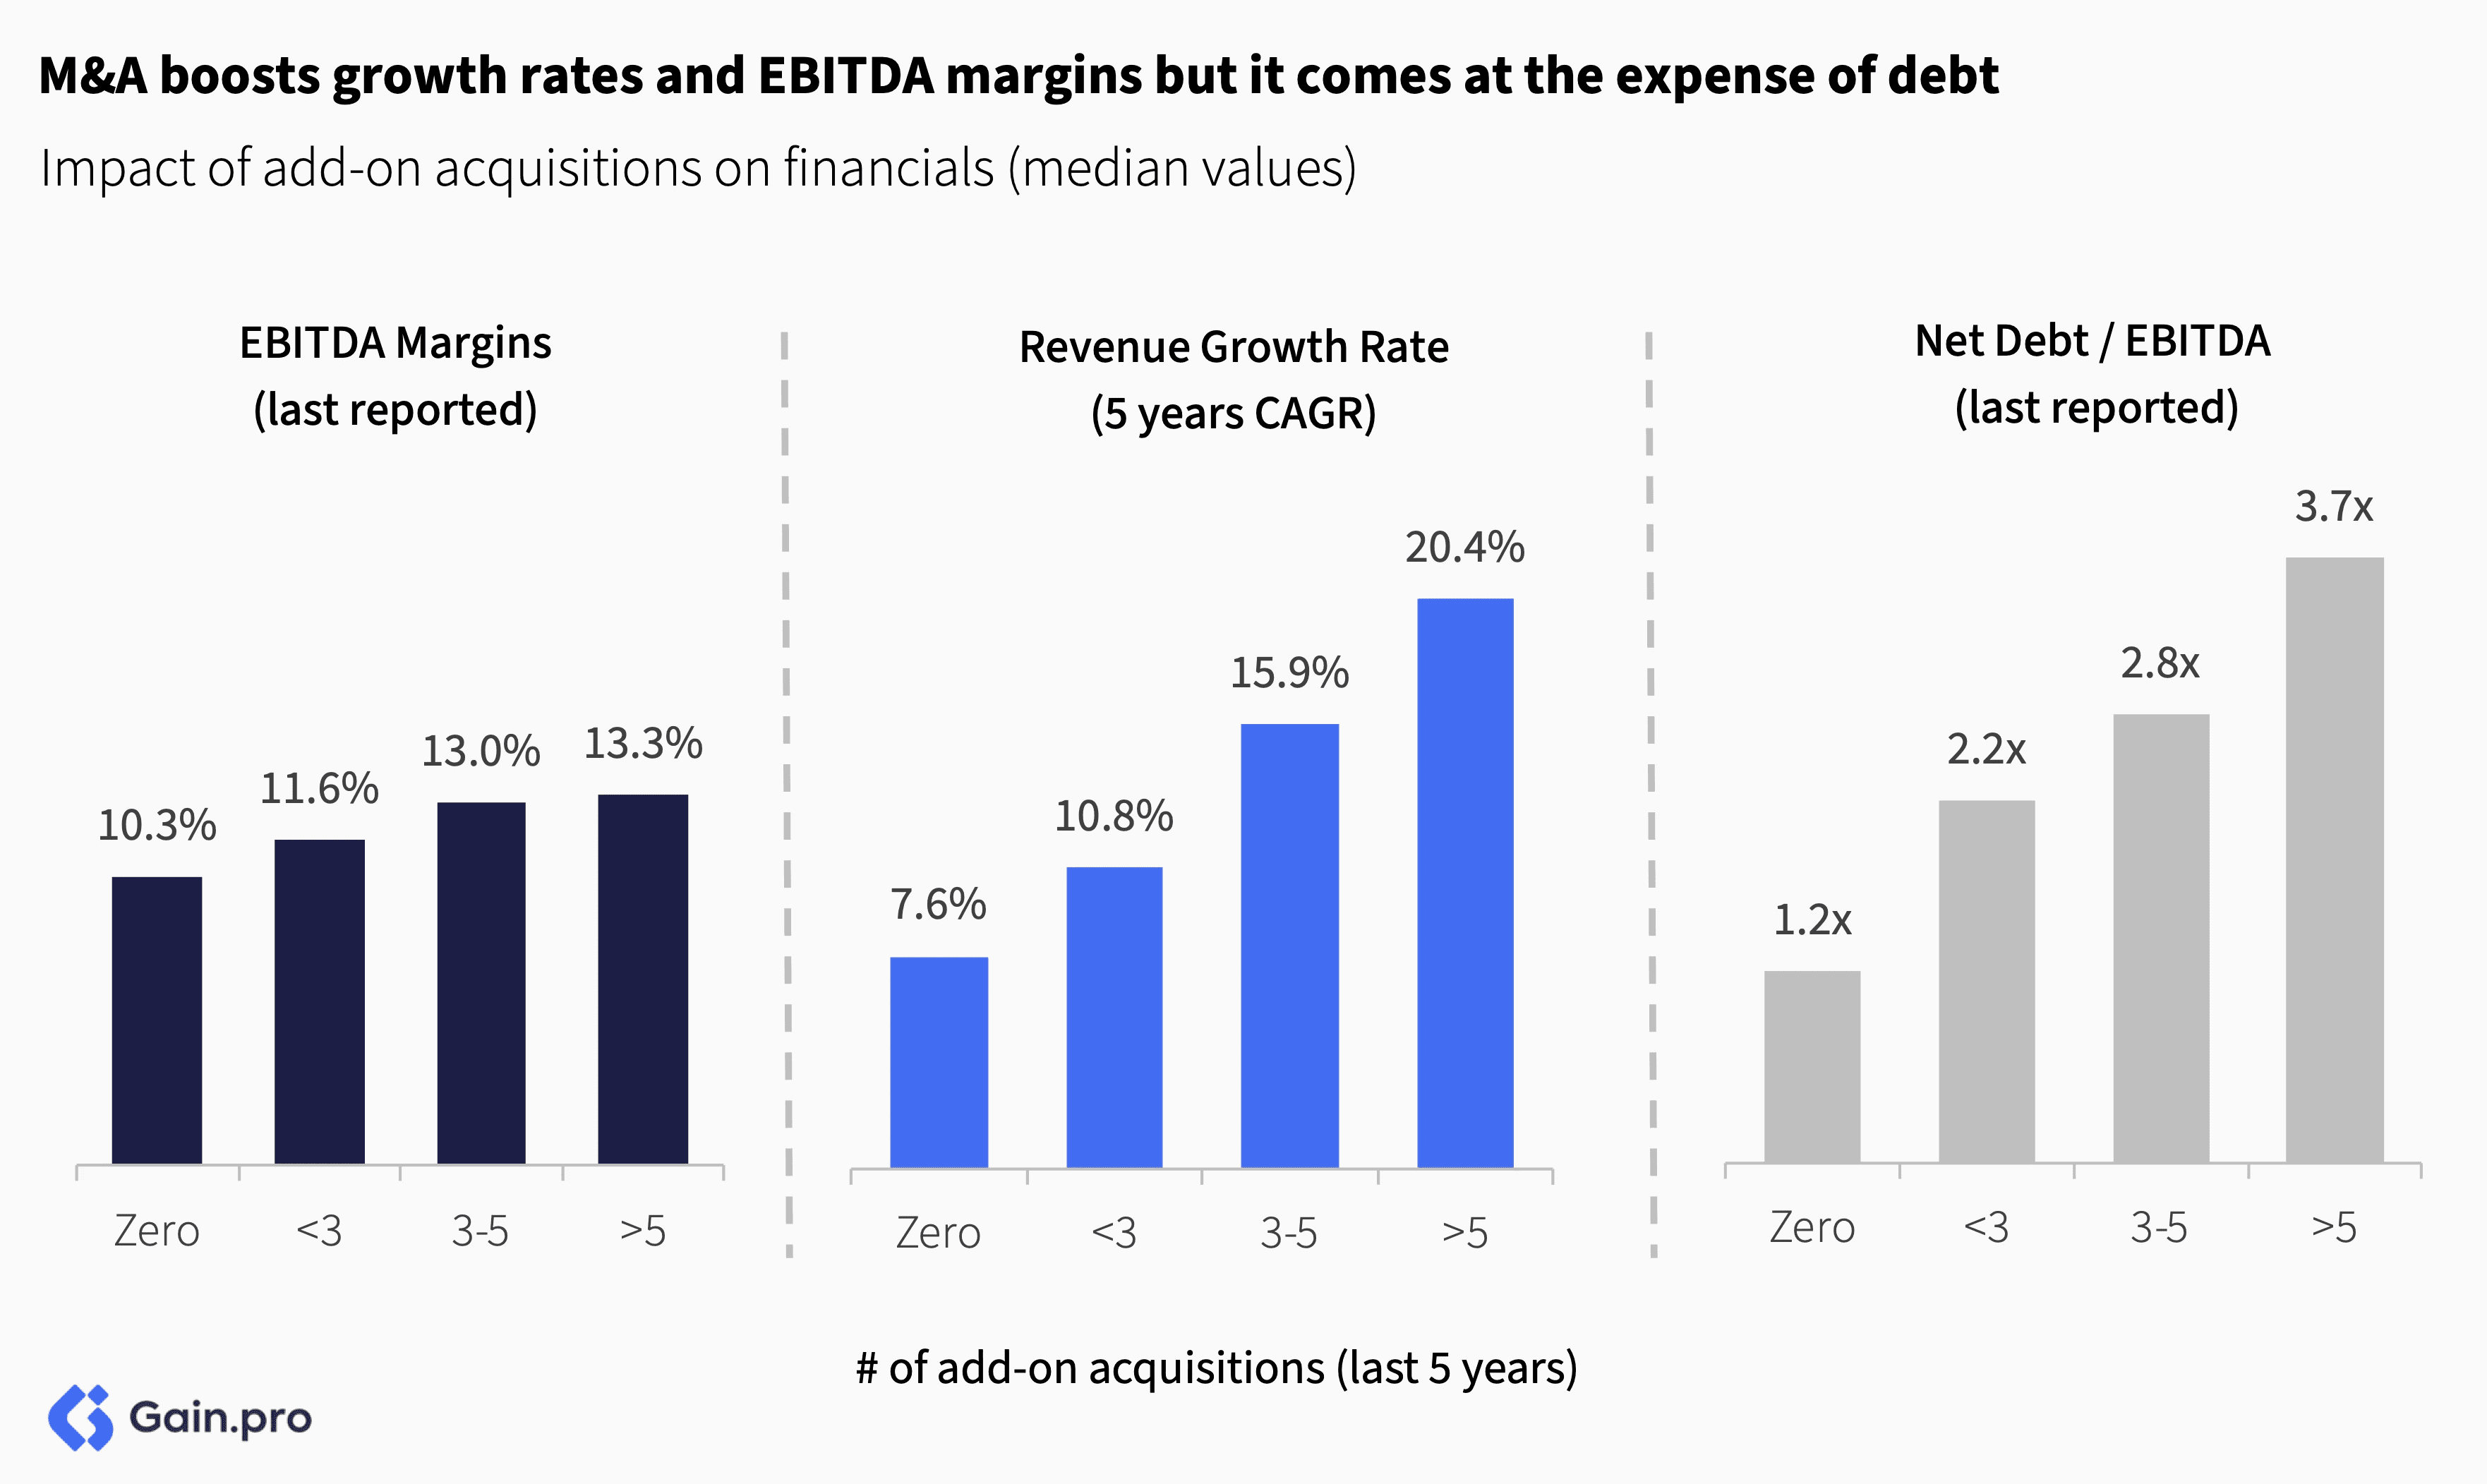
Add-ons can drive a lot of value by accelerating revenue growth and cost synergies. PE-backed businesses with over 5 acquisitions grew at a 5-year CAGR of 20.4% compared to 7.6% for businesses with no acquisitions. These businesses also benefit from improved margins. However with more acquisitions comes more debt, which increases the overall risk profile of the investment.
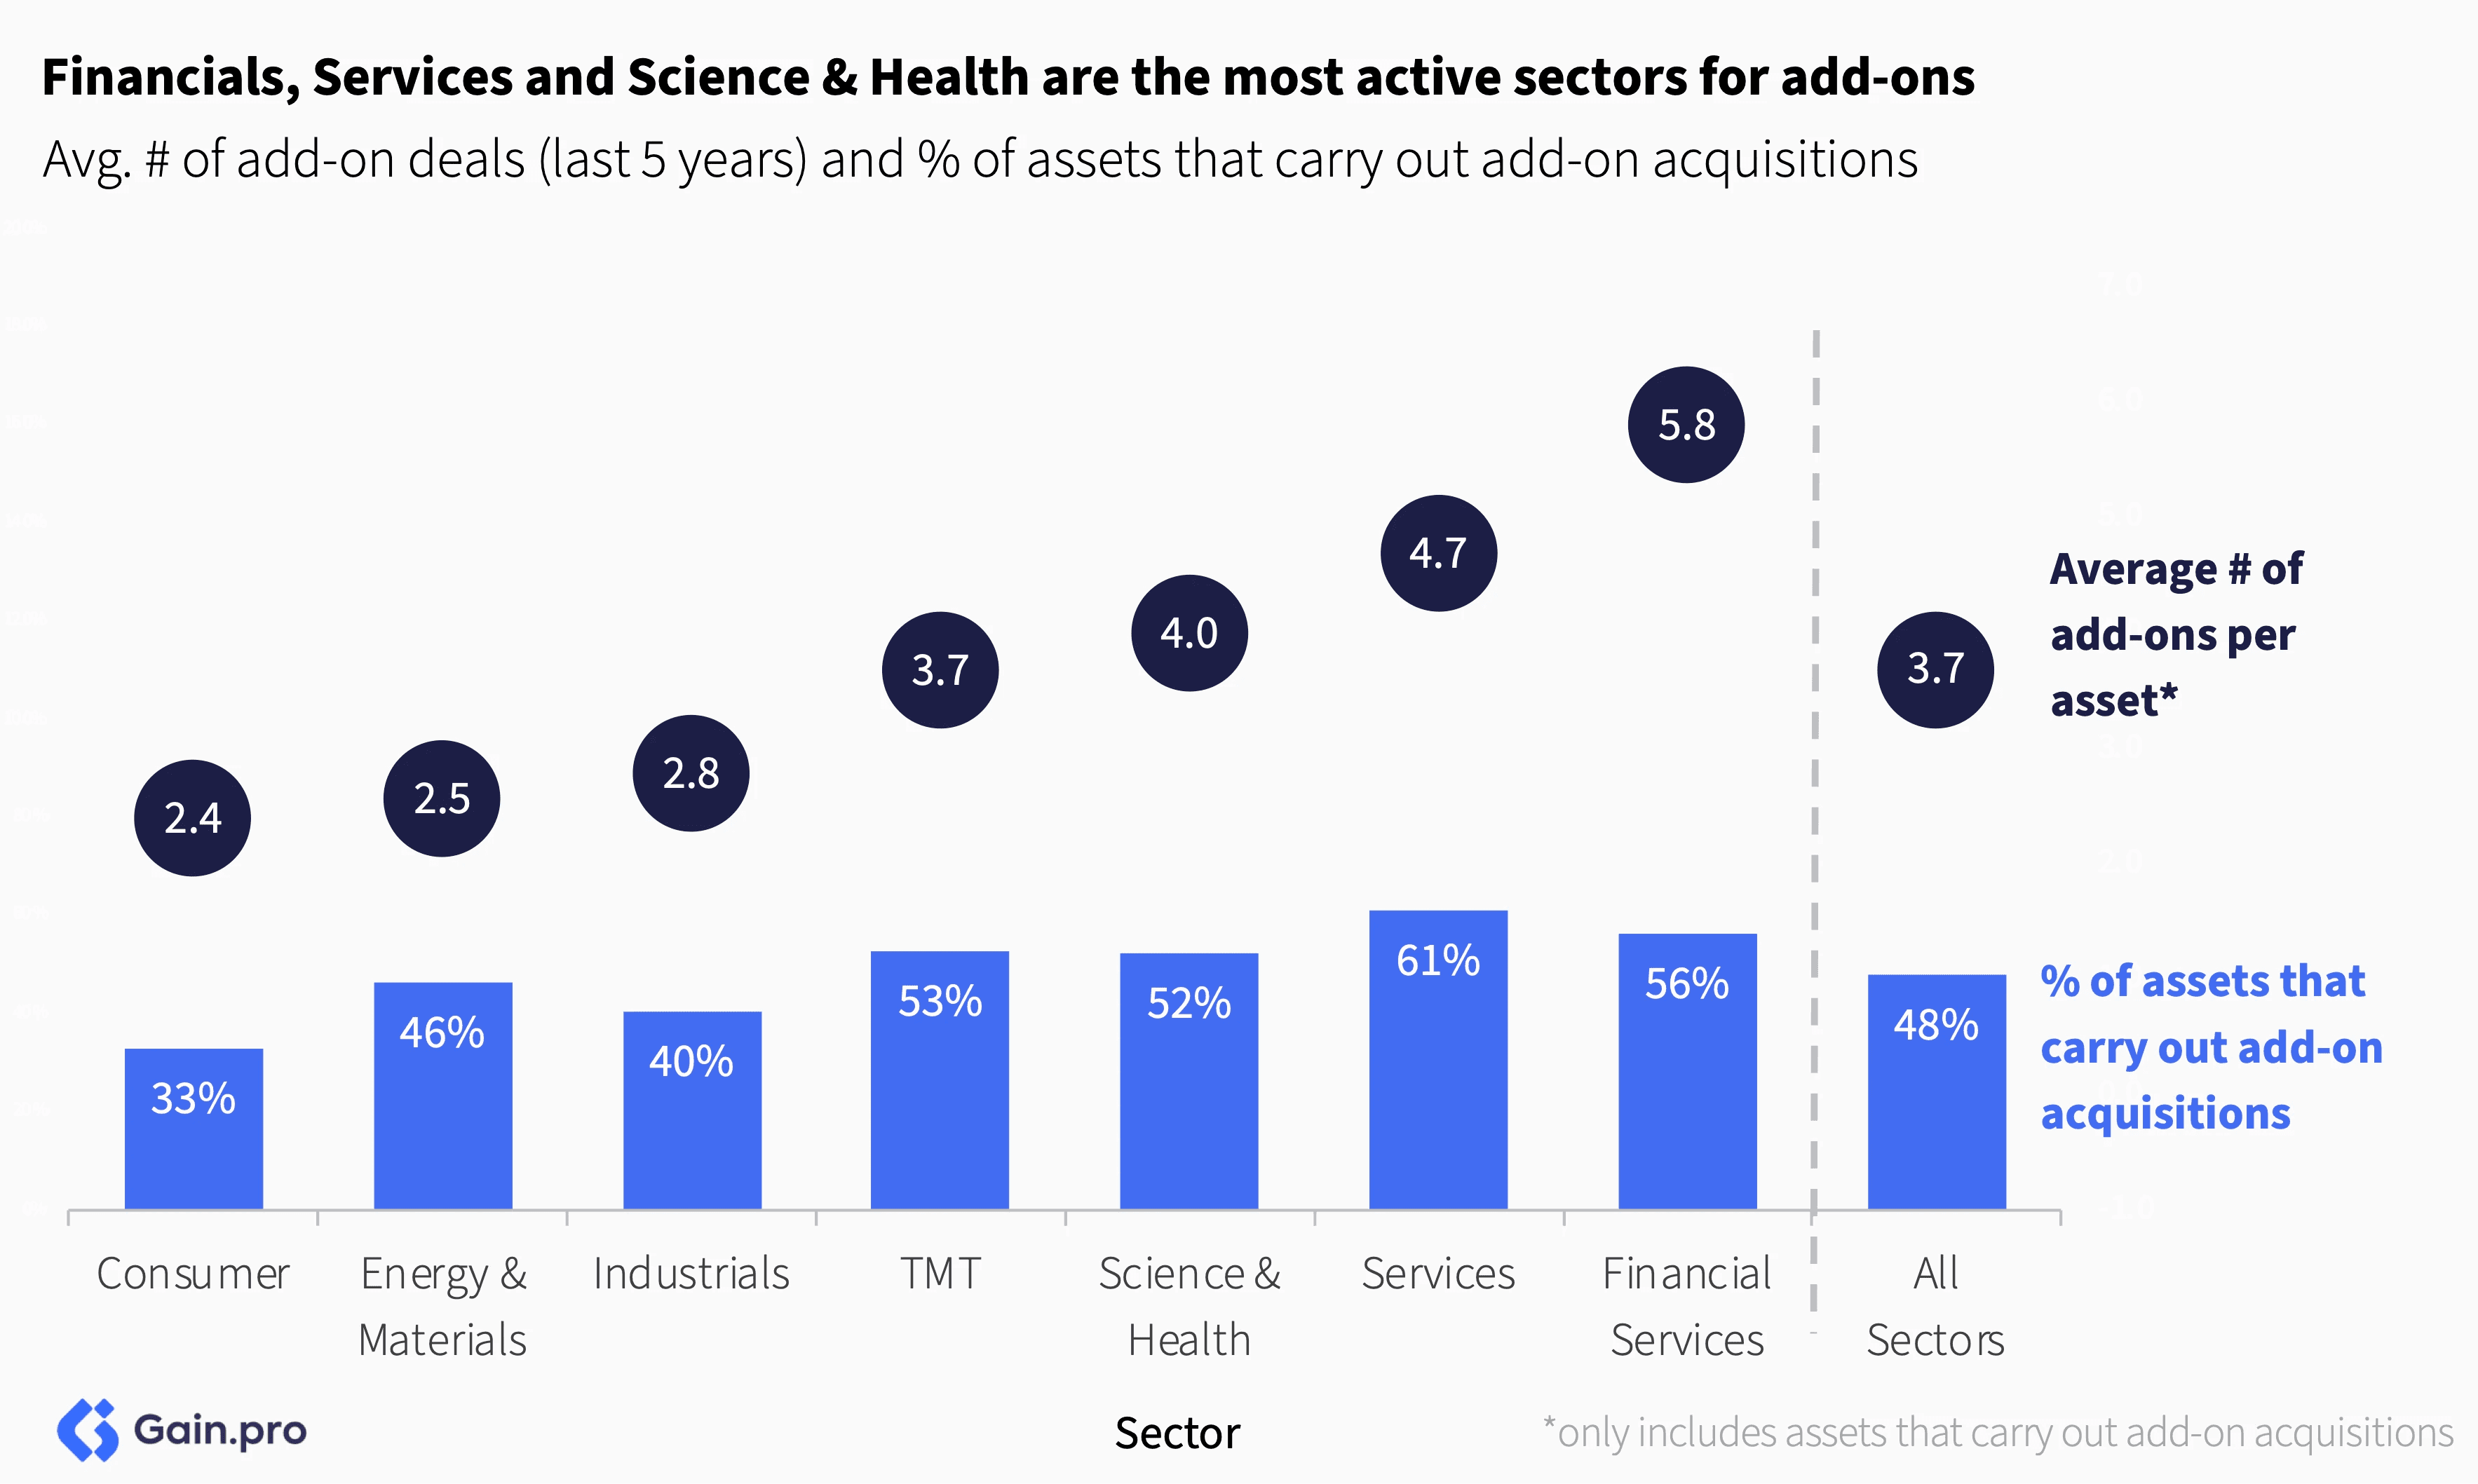
48% of the PE-backed businesses carry out add-on acquisitions, with 8% being serial acquirers (acquiring 5 or more companies a year). By size, add-on deals are usually smaller, with more than half of all deals (~52%) being less than €3m in EBITDA.

The add-on discount to platform deals is narrowing. Because of their smaller size, add-on targets are often cheaper to buy (~10% cheaper) compared to platform deals. However, recent data suggests that the discount is narrowing to the point where there is almost no multiple arbitrage.

Sector and Regional Insights
Financial Services and Services are the most active sectors for add-ons. We see market fragmentation combined with complexities in capturing organic growth as the key rationale for increased add-on activity within these sectors. In particular, we see many British asset managers and insurers doing M&A to shore up their AUM and market share. For Services, the biggest consolidators are operating in the Technical and Professional Services subsectors where there is still a significant difference in multiples and multiple arbitrage can drive the value/equity story.
Nordics is the most add-on heavy region in Europe, with 55% of assets there pursuing a buy-and-build strategy. Besides being Services-heavy, the fairly integrated local market between Sweden, Denmark and Norway makes bolt-on acquisitions effective.

Chapter 03: Exits
Overall Trend
PE exit activity picked up in 2024, up 24% year-over-year. After two consecutive years of decline, the market has rebounded. Despite subdued valuations, investors are prioritizing liquidity for LPs bringing a backlog of delayed exits to the market.

Quarterly PE exit activity shows strong momentum. Data shows a ‘V’ shape recovery in exit volumes although the most recent data points to stabilization. Fundraising dynamics, greater availability of credit and improved market sentiment all contributed to the recovery.
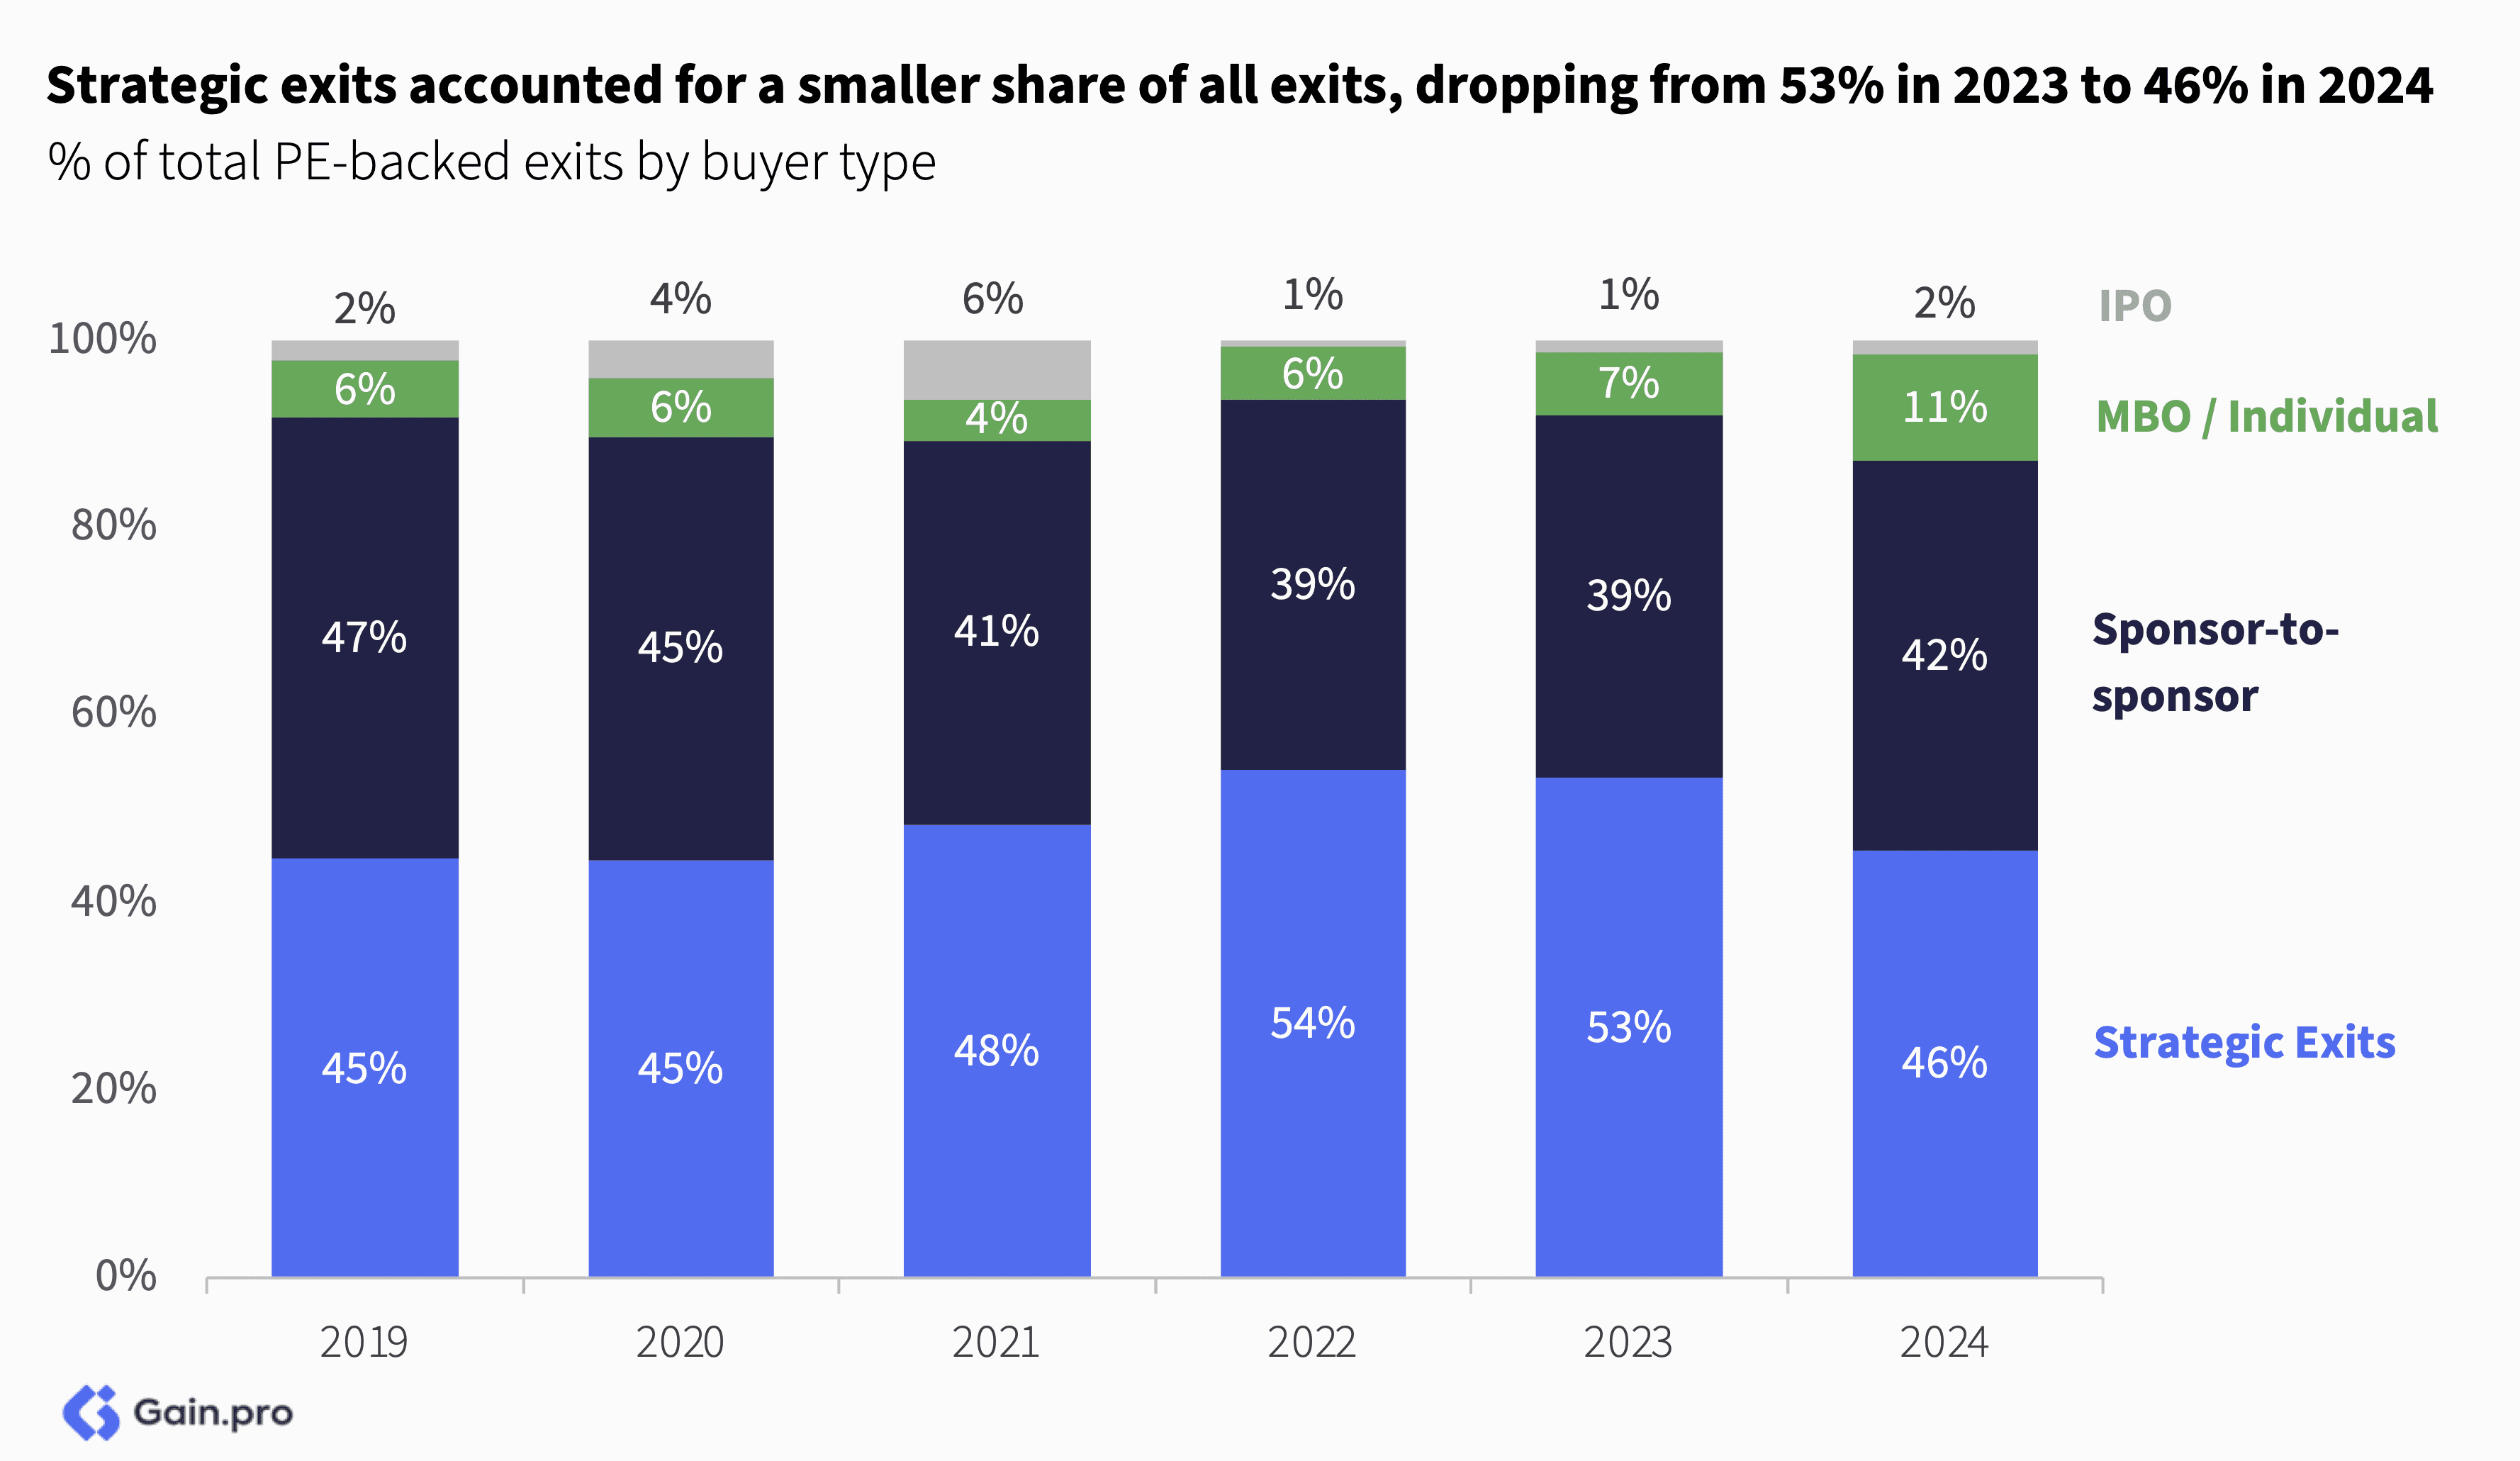
Strategic exits accounted for a smaller share of all exits, dropping from 53% in 2023 to 46% in 2024. In contrast, sponsor-to-sponsor activity picked up (as debt markets opened), management buyouts (MBOs) gained traction and IPO activity saw an uptick.
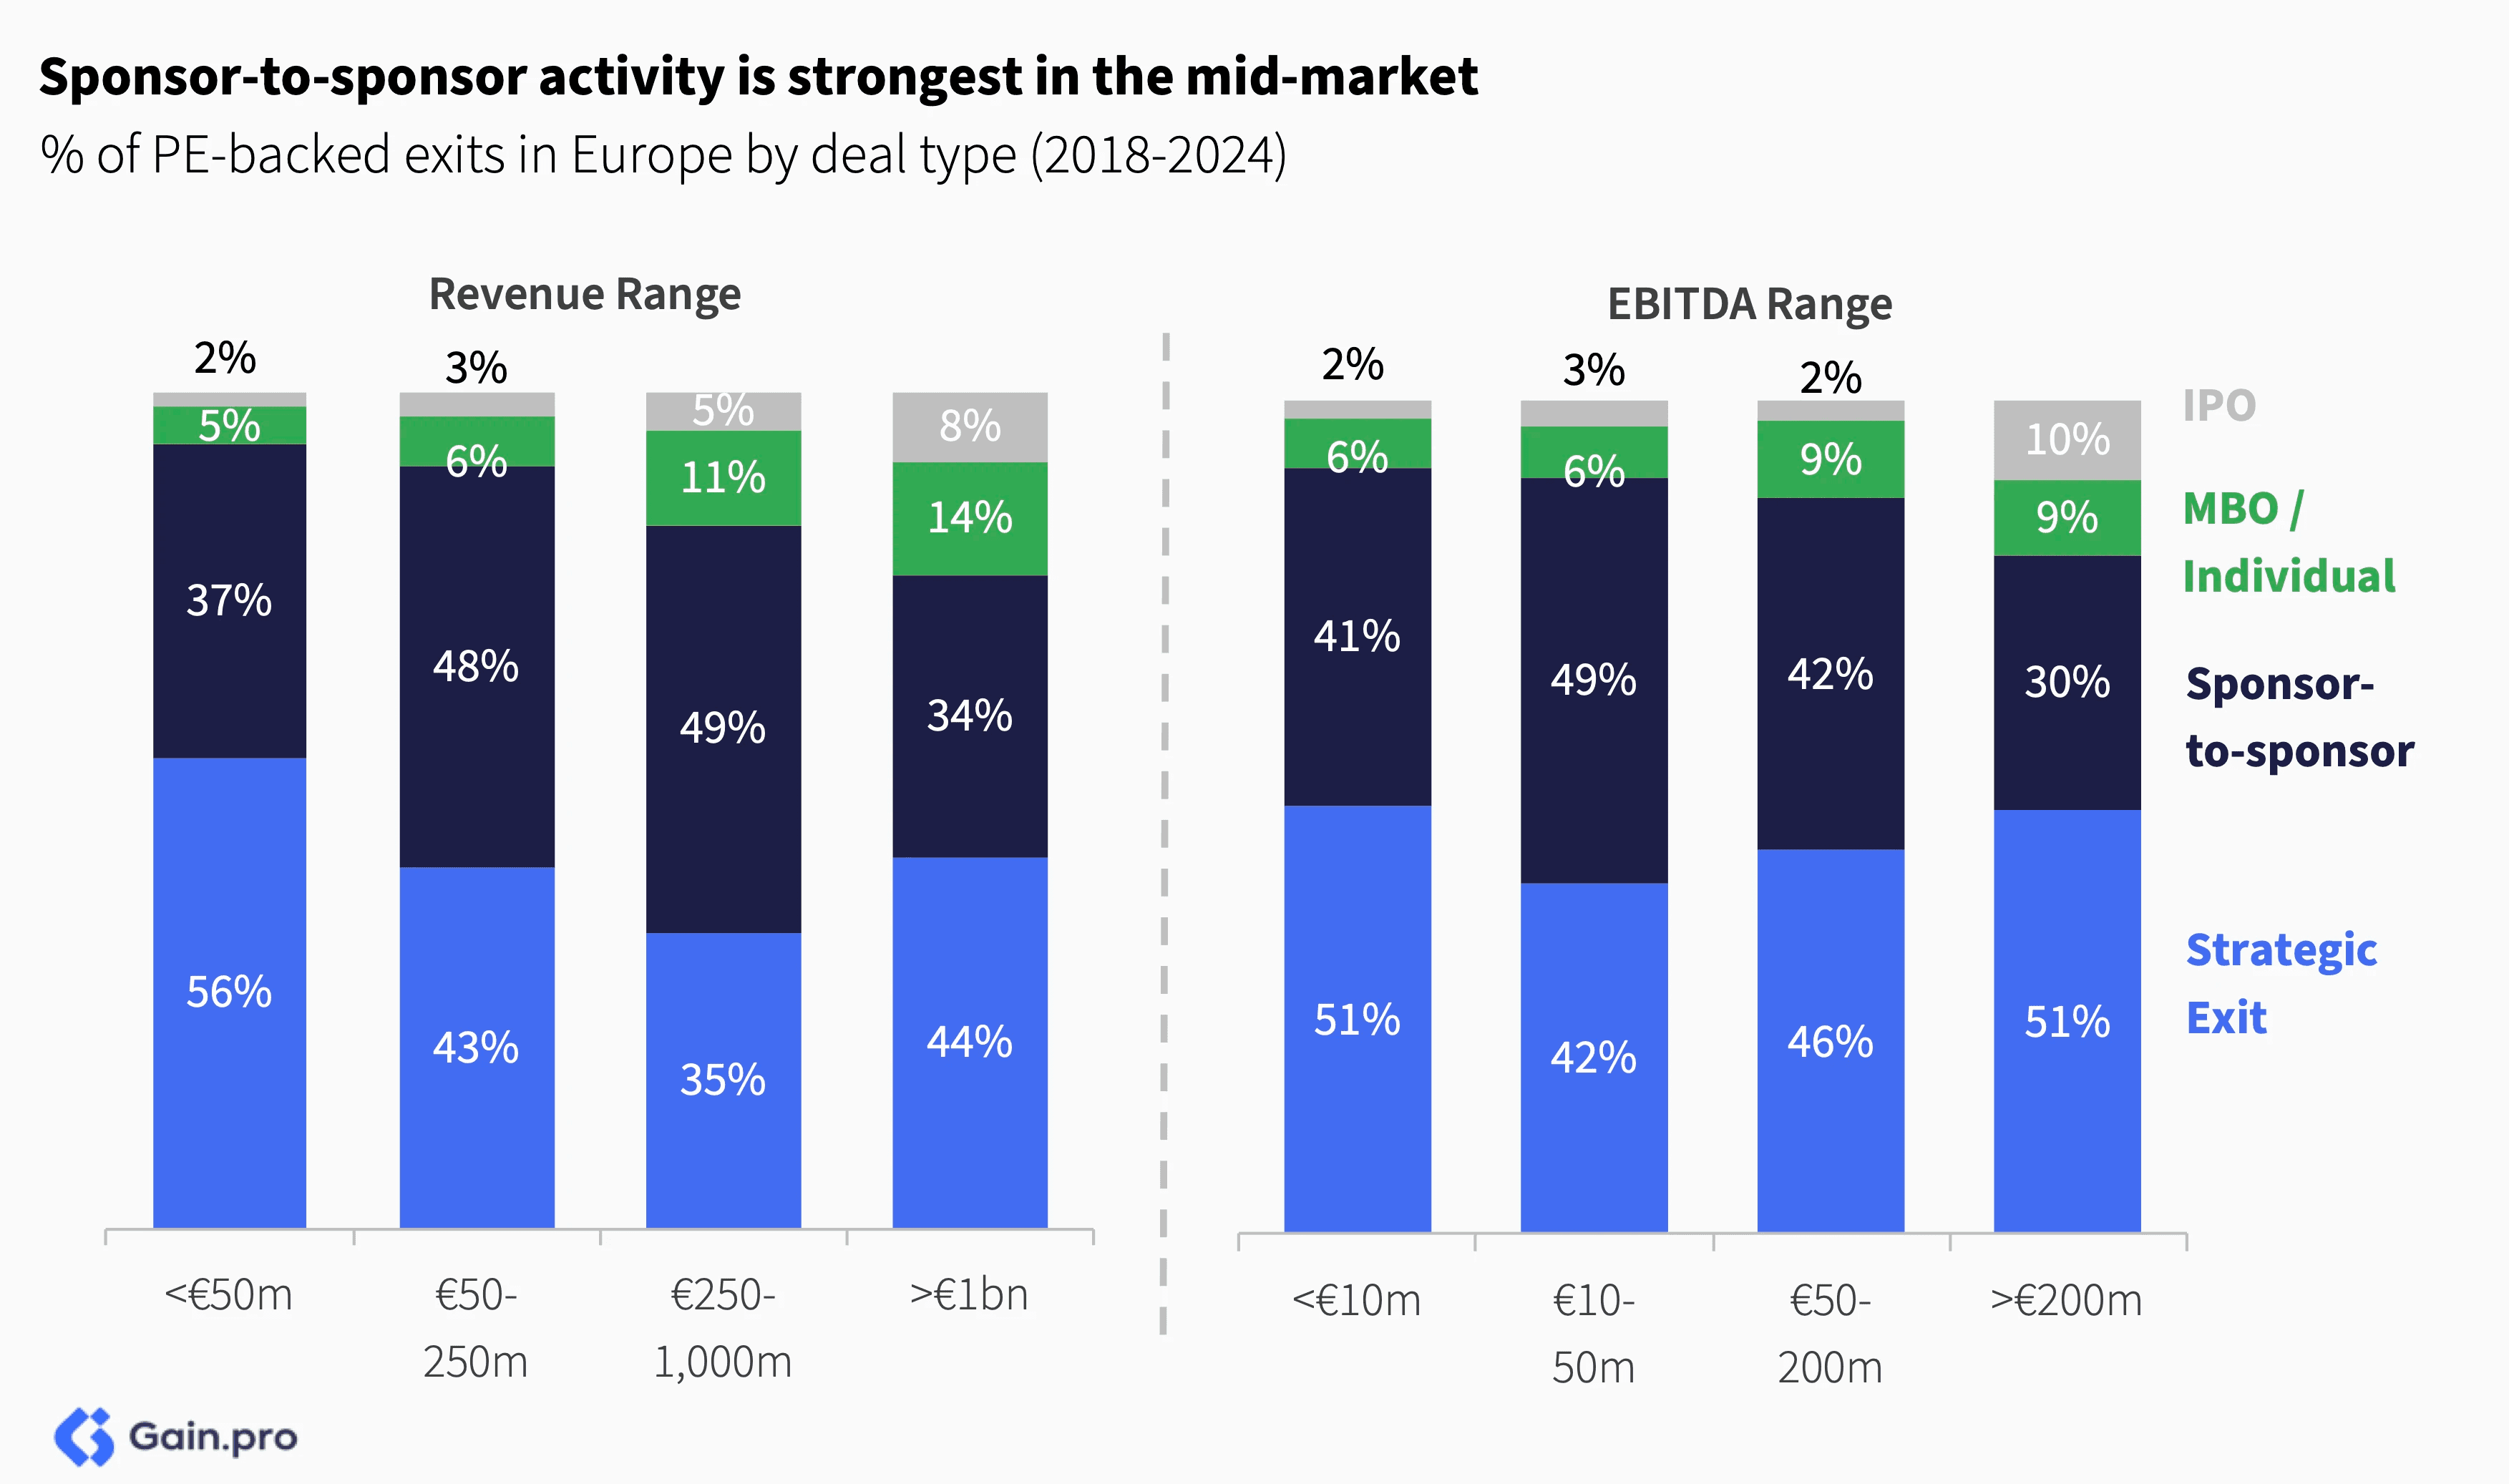
Sponsor-to-sponsor activity is strongest in the mid-market. Smaller (<€10m EBITDA) and larger (>€200m EBITDA) PE-backed exits tend to see more strategic exits, with IPOs also being more common in larger deals.
Holding Periods
Holding periods for PE assets are hovering near the highs. The median company that exited in 2024 spent 5.7 years in the portfolio compared to 4.7 years in 2020. Holding periods are top of mind for both GPs and LPs alike as they have a meaningful impact on performance metrics including IRR and DPI.
61% of assets that exited in 2024 stayed longer than 5 years in the portfolio (up from 45% in 2020). GPs are reluctant to sell assets at lower valuations, striving to balance LP liquidity with the potential for improved valuations going forward.

Selling some of those longer-dated assets might pose a challenge. These assets tend to remain unsold because of their slower growth rates and lower margins. Sponsors face a tough choice, whether to inject more capital to revive these businesses, sell them at a discount or potentially roll them over into a continuation vehicle if they see a lot of unrealized value or potential for a turnaround. However, exceptions do exist where sponsors choose to retain strong-performing and higher-growth assets for longer.

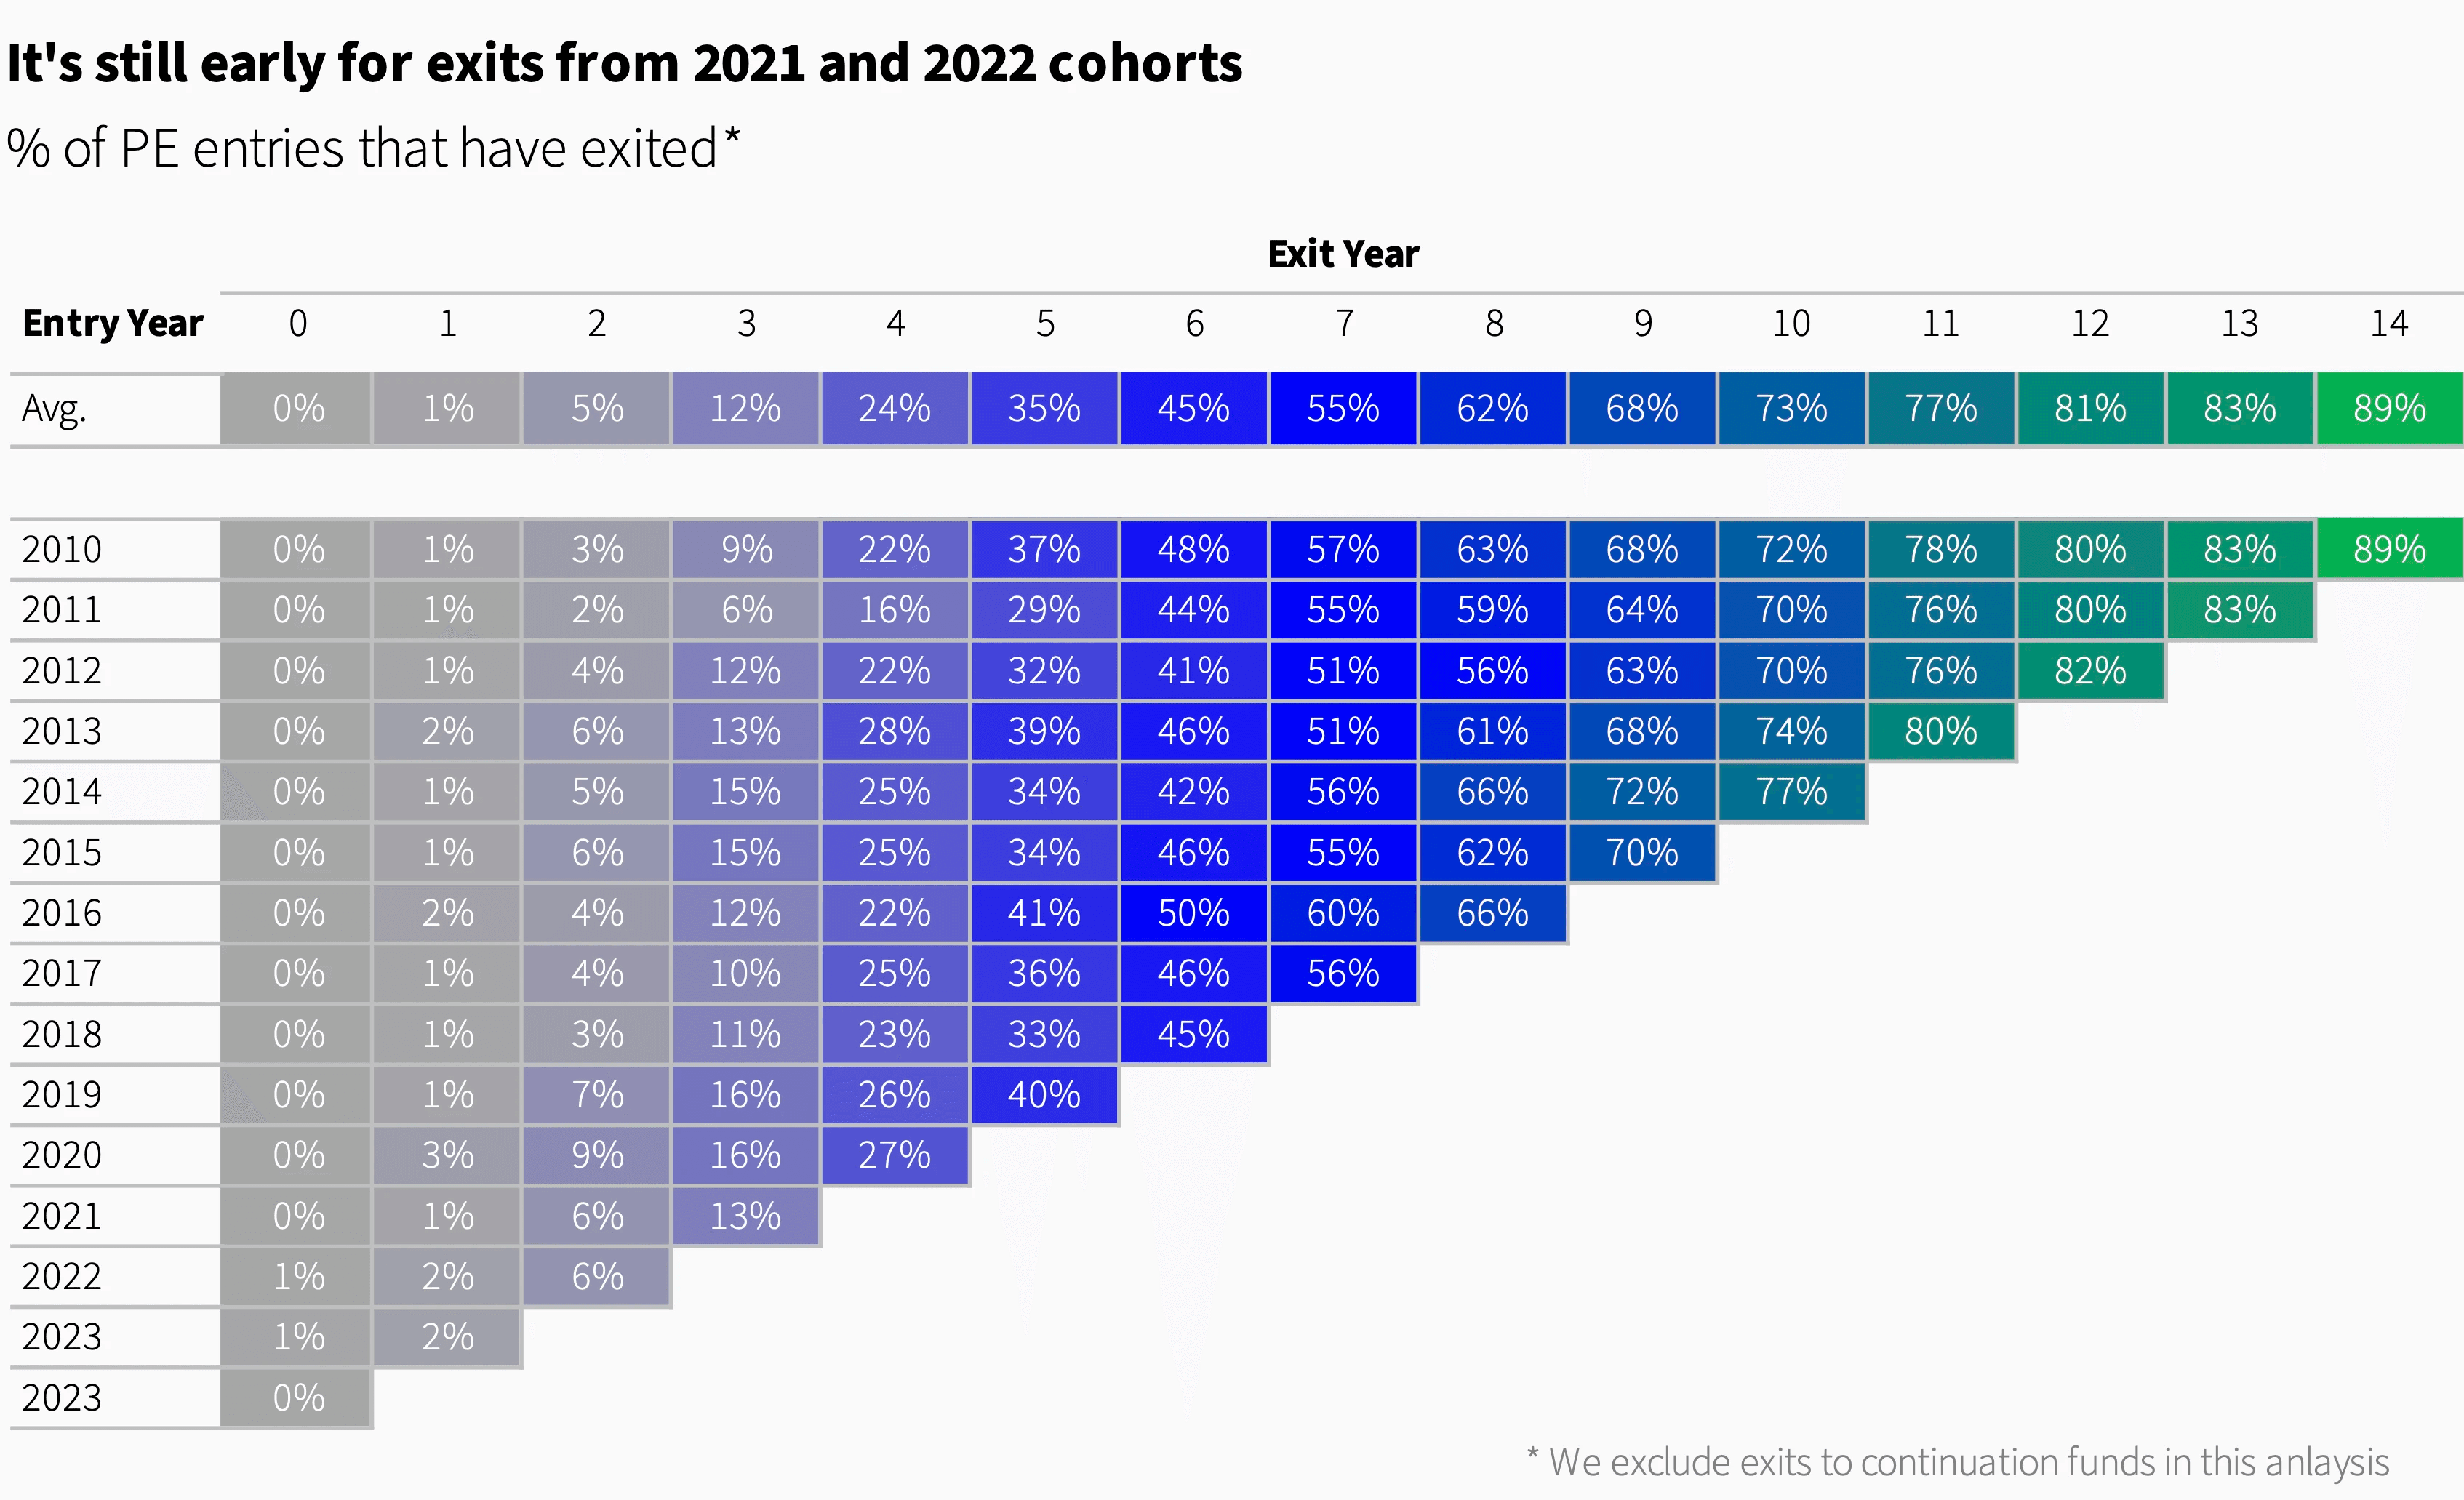
It’s also too soon to make any conclusions about exits from the high entry-valuation cohorts of 2021 and 2022. Typically, exits only ramp up in year 4, making 2025 and 2026 pivotal years to watch for those exits.
Exits by Sector
Science & Health saw the steepest decline in exit activity. Apart from regulatory challenges, it was also the sector that saw the biggest increase in 2021, so, understandably, activity is mean reverting. In contrast, exits in the Services and Industrial sectors have been more stable.

Consumer assets have the highest holding period. On average it takes a Consumer asset 6.2 years to exit. Assets in Energy & Materials and Industrials are also characterized by long holding periods (6.1 years). On the other side, TMT and Financial Services assets have the lowest holding periods.

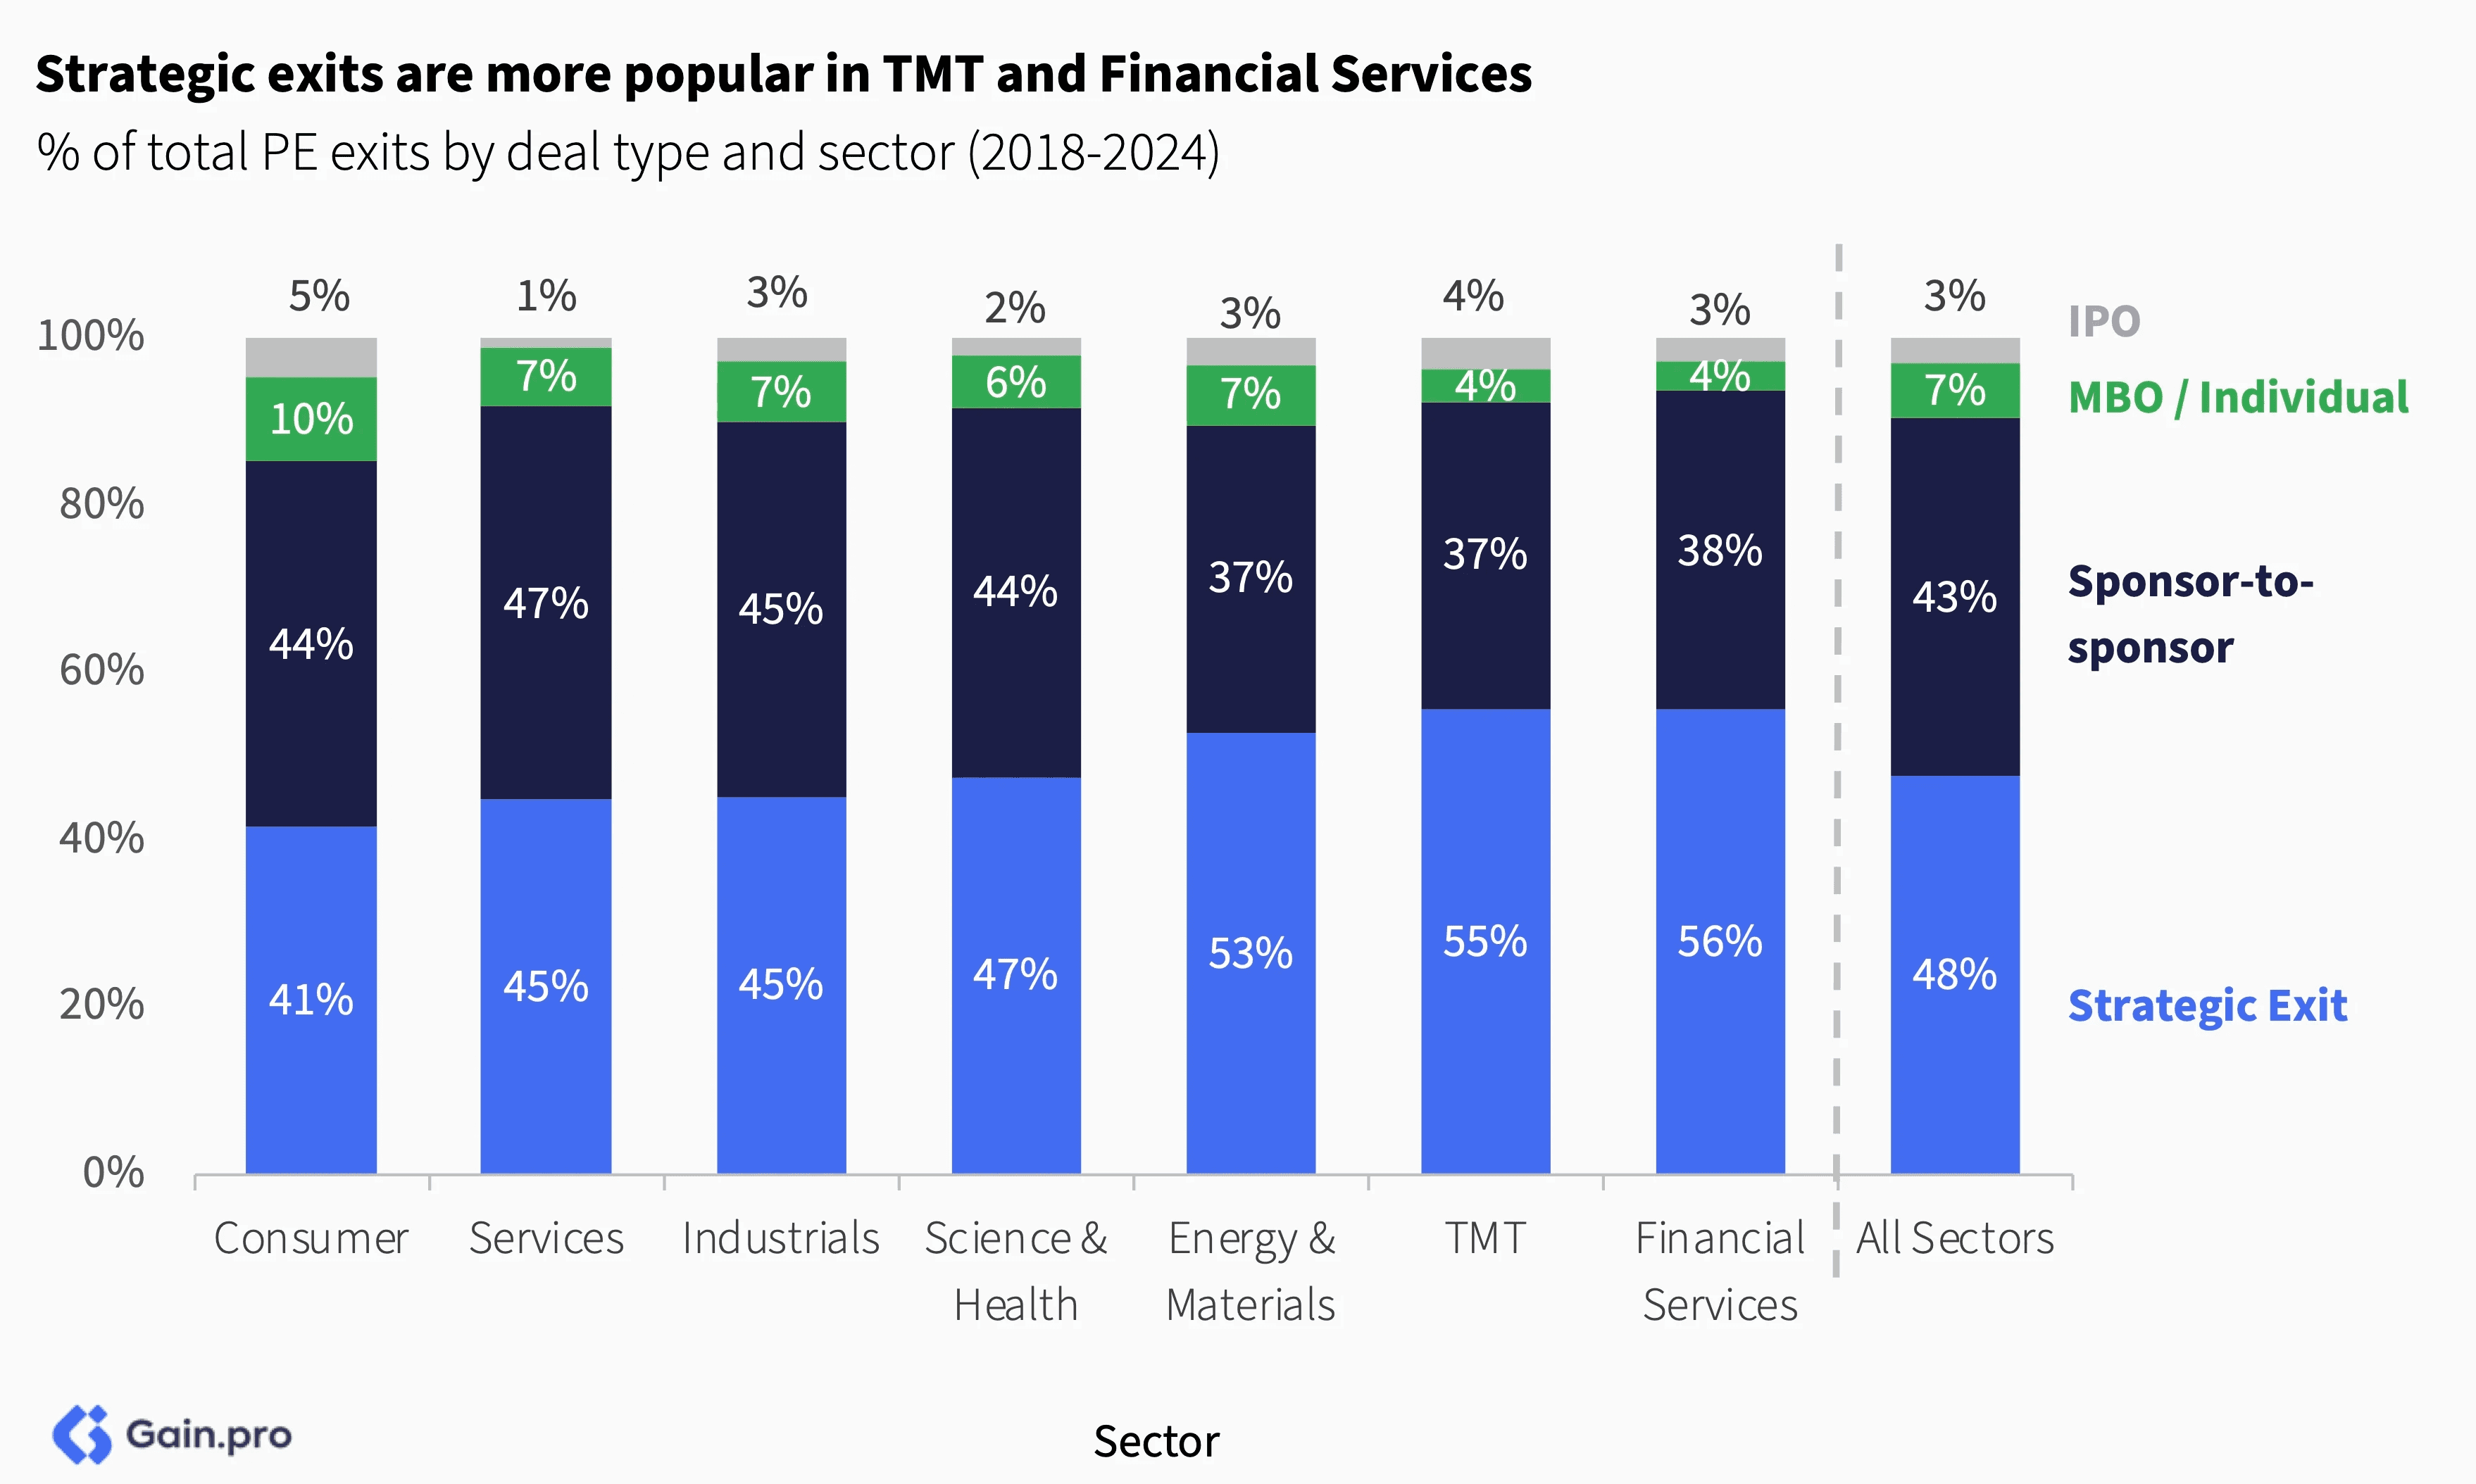
Strategic exits are more common in TMT and Financial Services, while sponsor-to-sponsor deals are more common in the Services and Industrials sectors. Consumer and TMT have more IPOs compared to other sectors.
Exits by Region
DACH and UK&I saw the steepest decline in exit activity. Other regions such as France, Italy and Iberia fared much better with deal count above or at their 2021 peak levels.

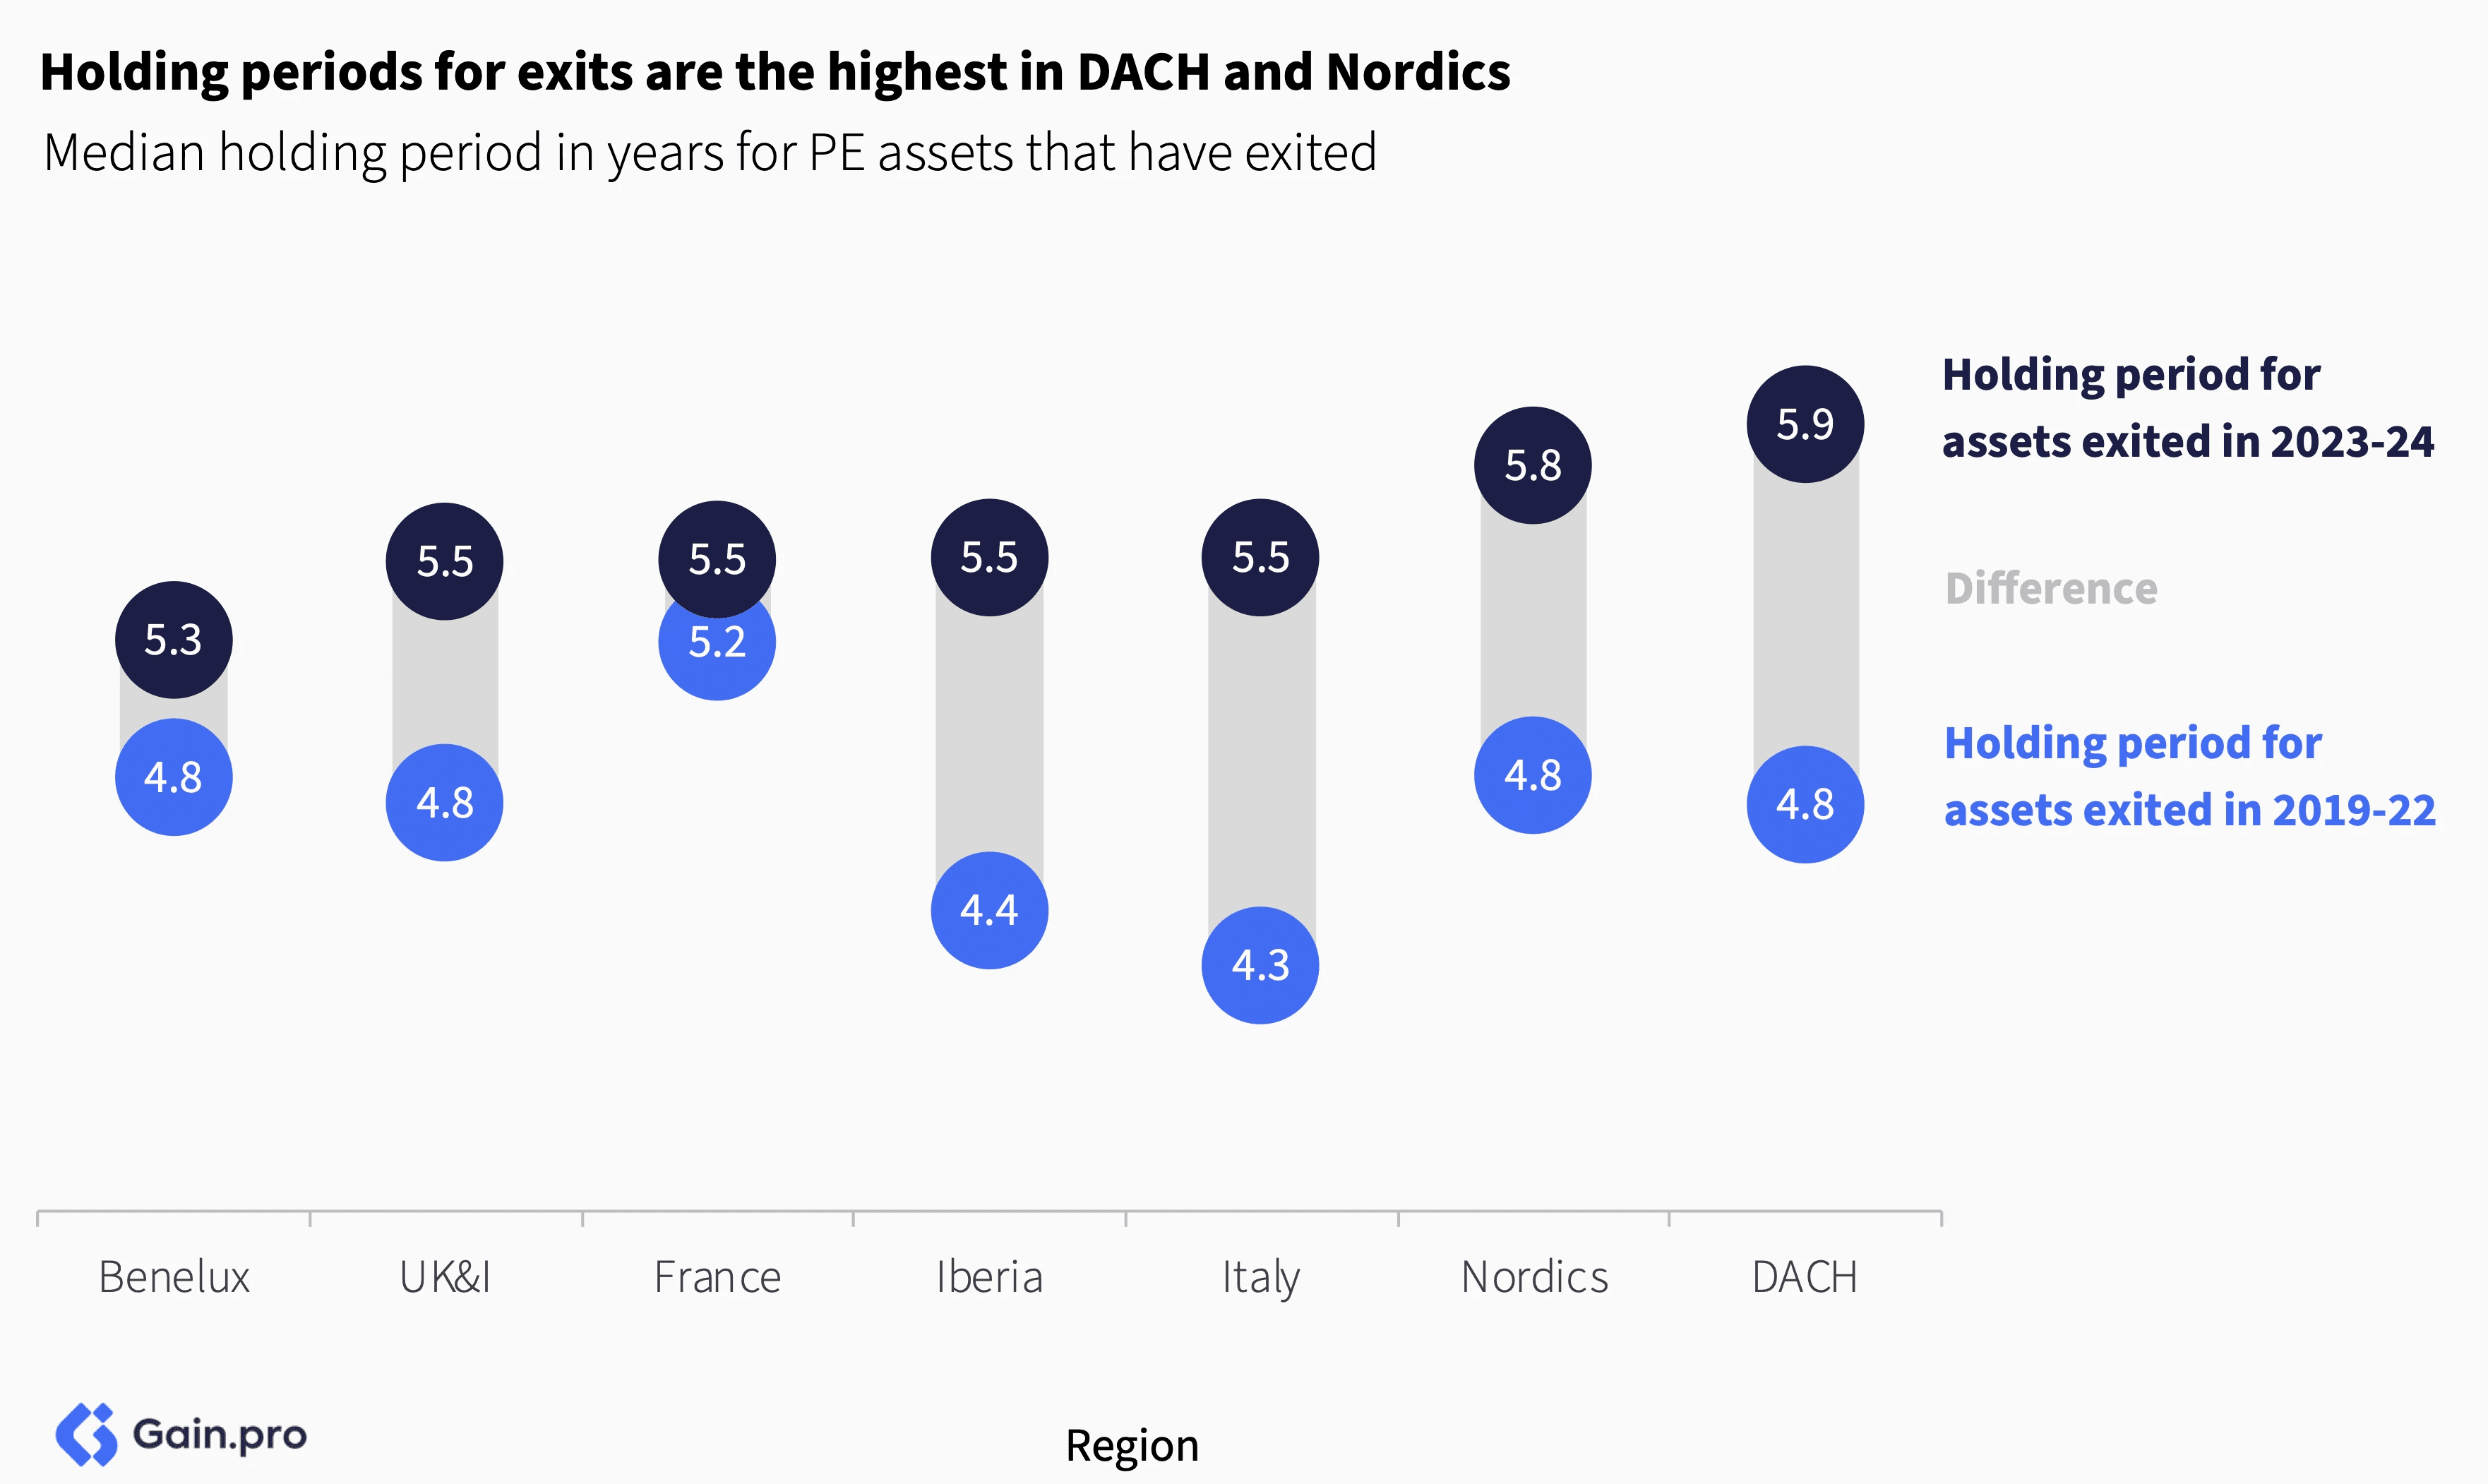
The holding period for exits is the highest in Nordics and DACH. On average, in those regions, it takes 6 years for a business from entry to exit. In comparison, markets like Benelux are slightly faster-moving with a median holding period of 5.3 years, which is only slightly higher compared to the 2019-22 levels.
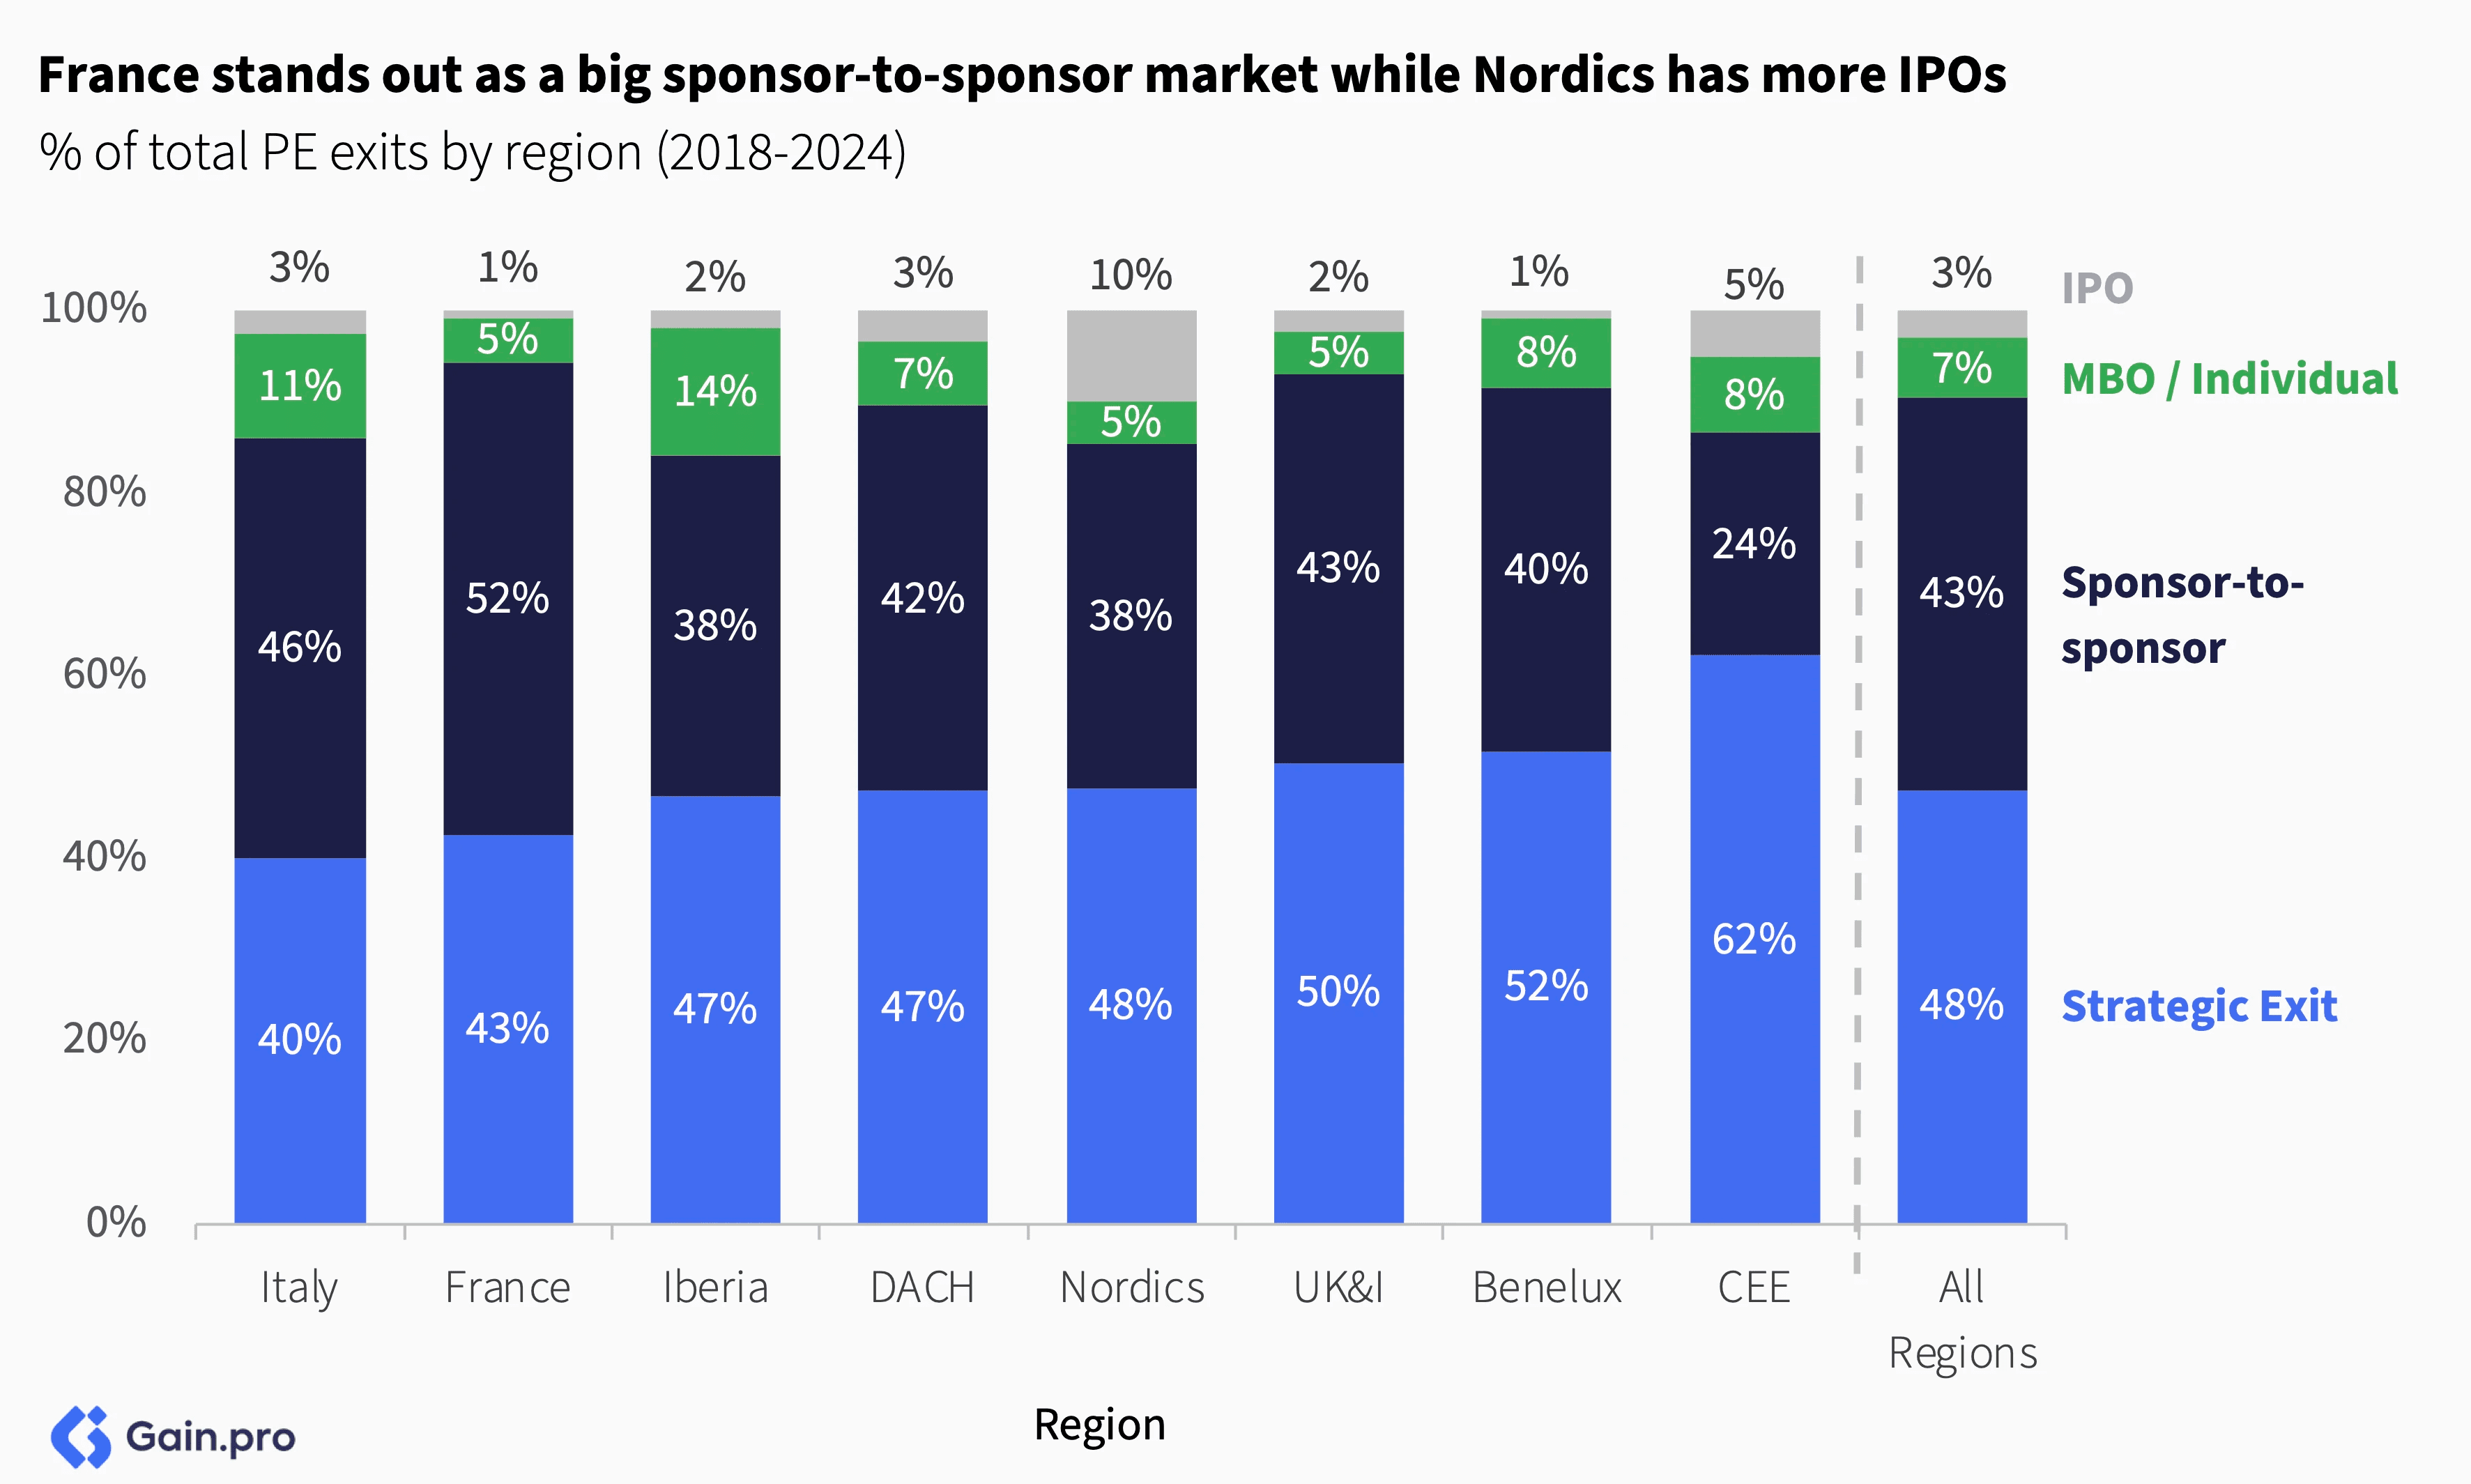
France stands out as a big sponsor-to-sponsor market. 52% of exits in France were sponsor-to-sponsor (vs. 43% for all regions). France has one of the highest PE penetration rates in Europe and the highest share of minority investors. As a result, it sees many investor-to-investor deals. Nordic regions lead Europe in terms of IPOs thanks to strong investor demand, favorable floating regulations and a thriving tech sector.
Chapter 04: Multiples
Overall
PE multiples were down a third year in a row. Tighter financing conditions and less competition for deals meant PE sponsors no longer needed to pay top dollar. As we look ahead, we expect deal multiples to bottom out as interest rates stabilize and deal activity returns.

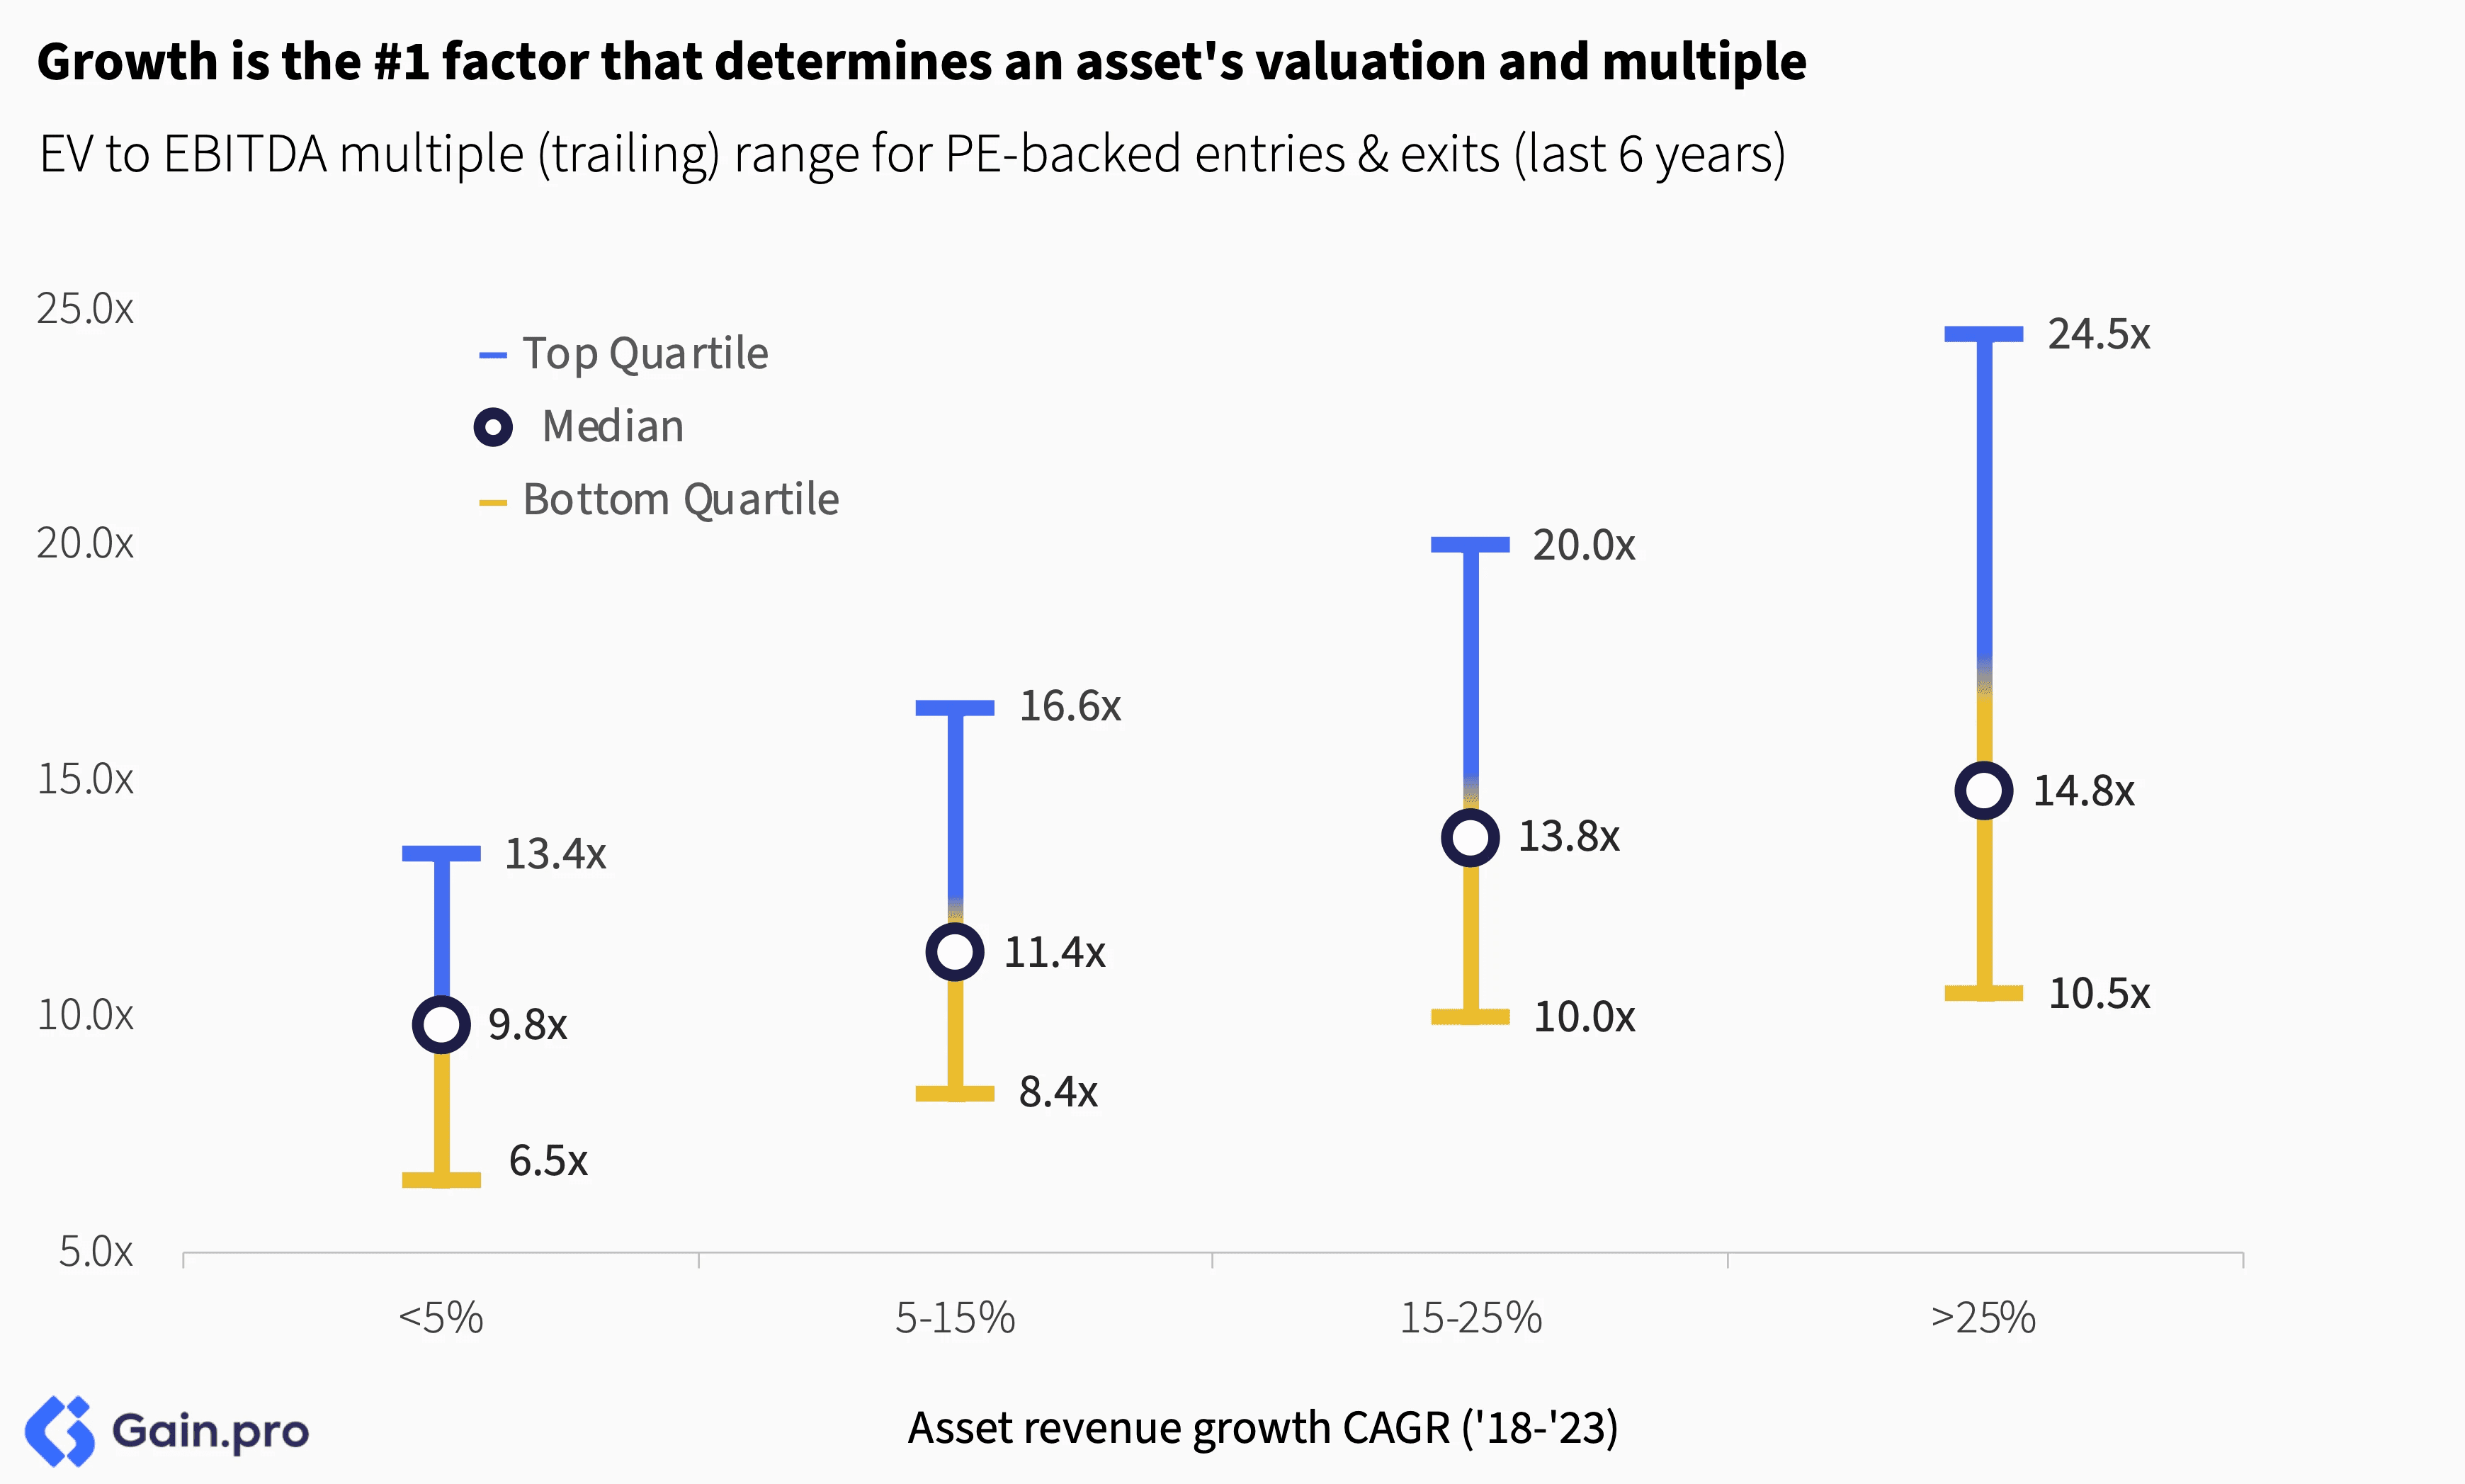
Growth remains the #1 factor for an asset's valuation and multiple. Assets that grow faster (>25% revenue CAGR) sell at ~50% premium to those that grow slower (<5% revenue CAGR).
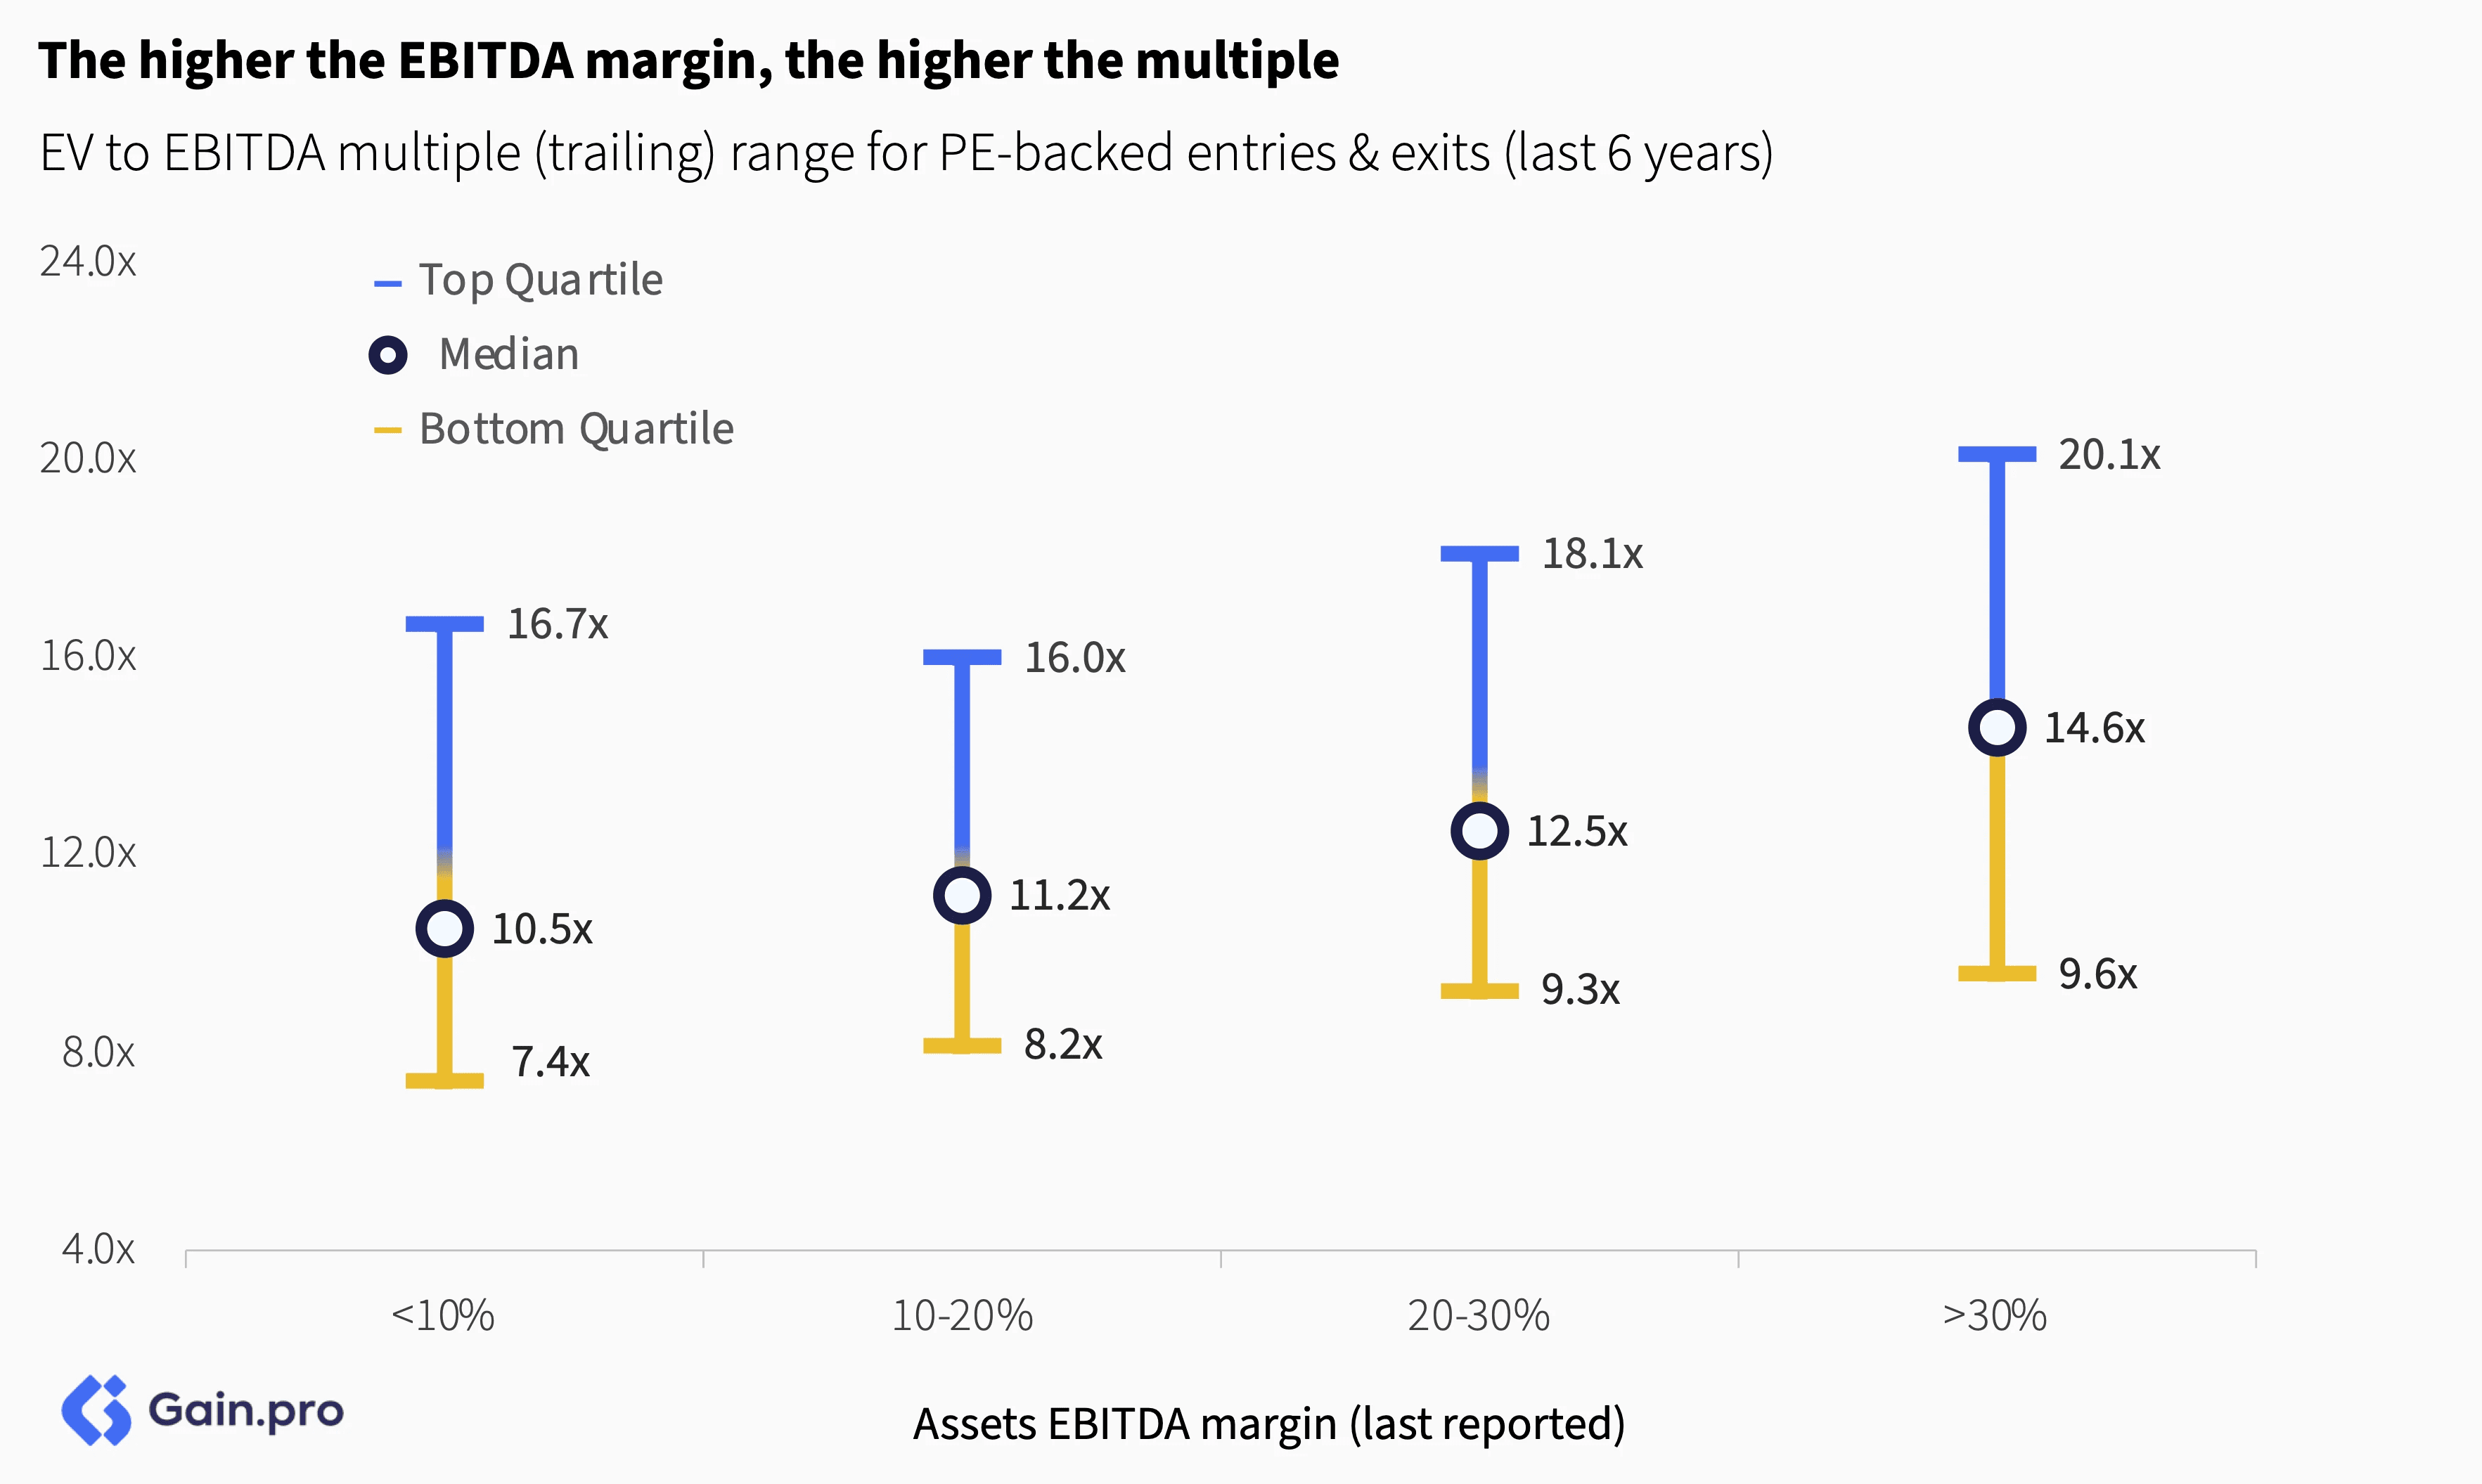
Multiples increase with the company’s profitability. Investors readily pay a premium for businesses that are high quality and resilient. High operational efficiency and strong cash flows also de-risk the transaction for the buyer.
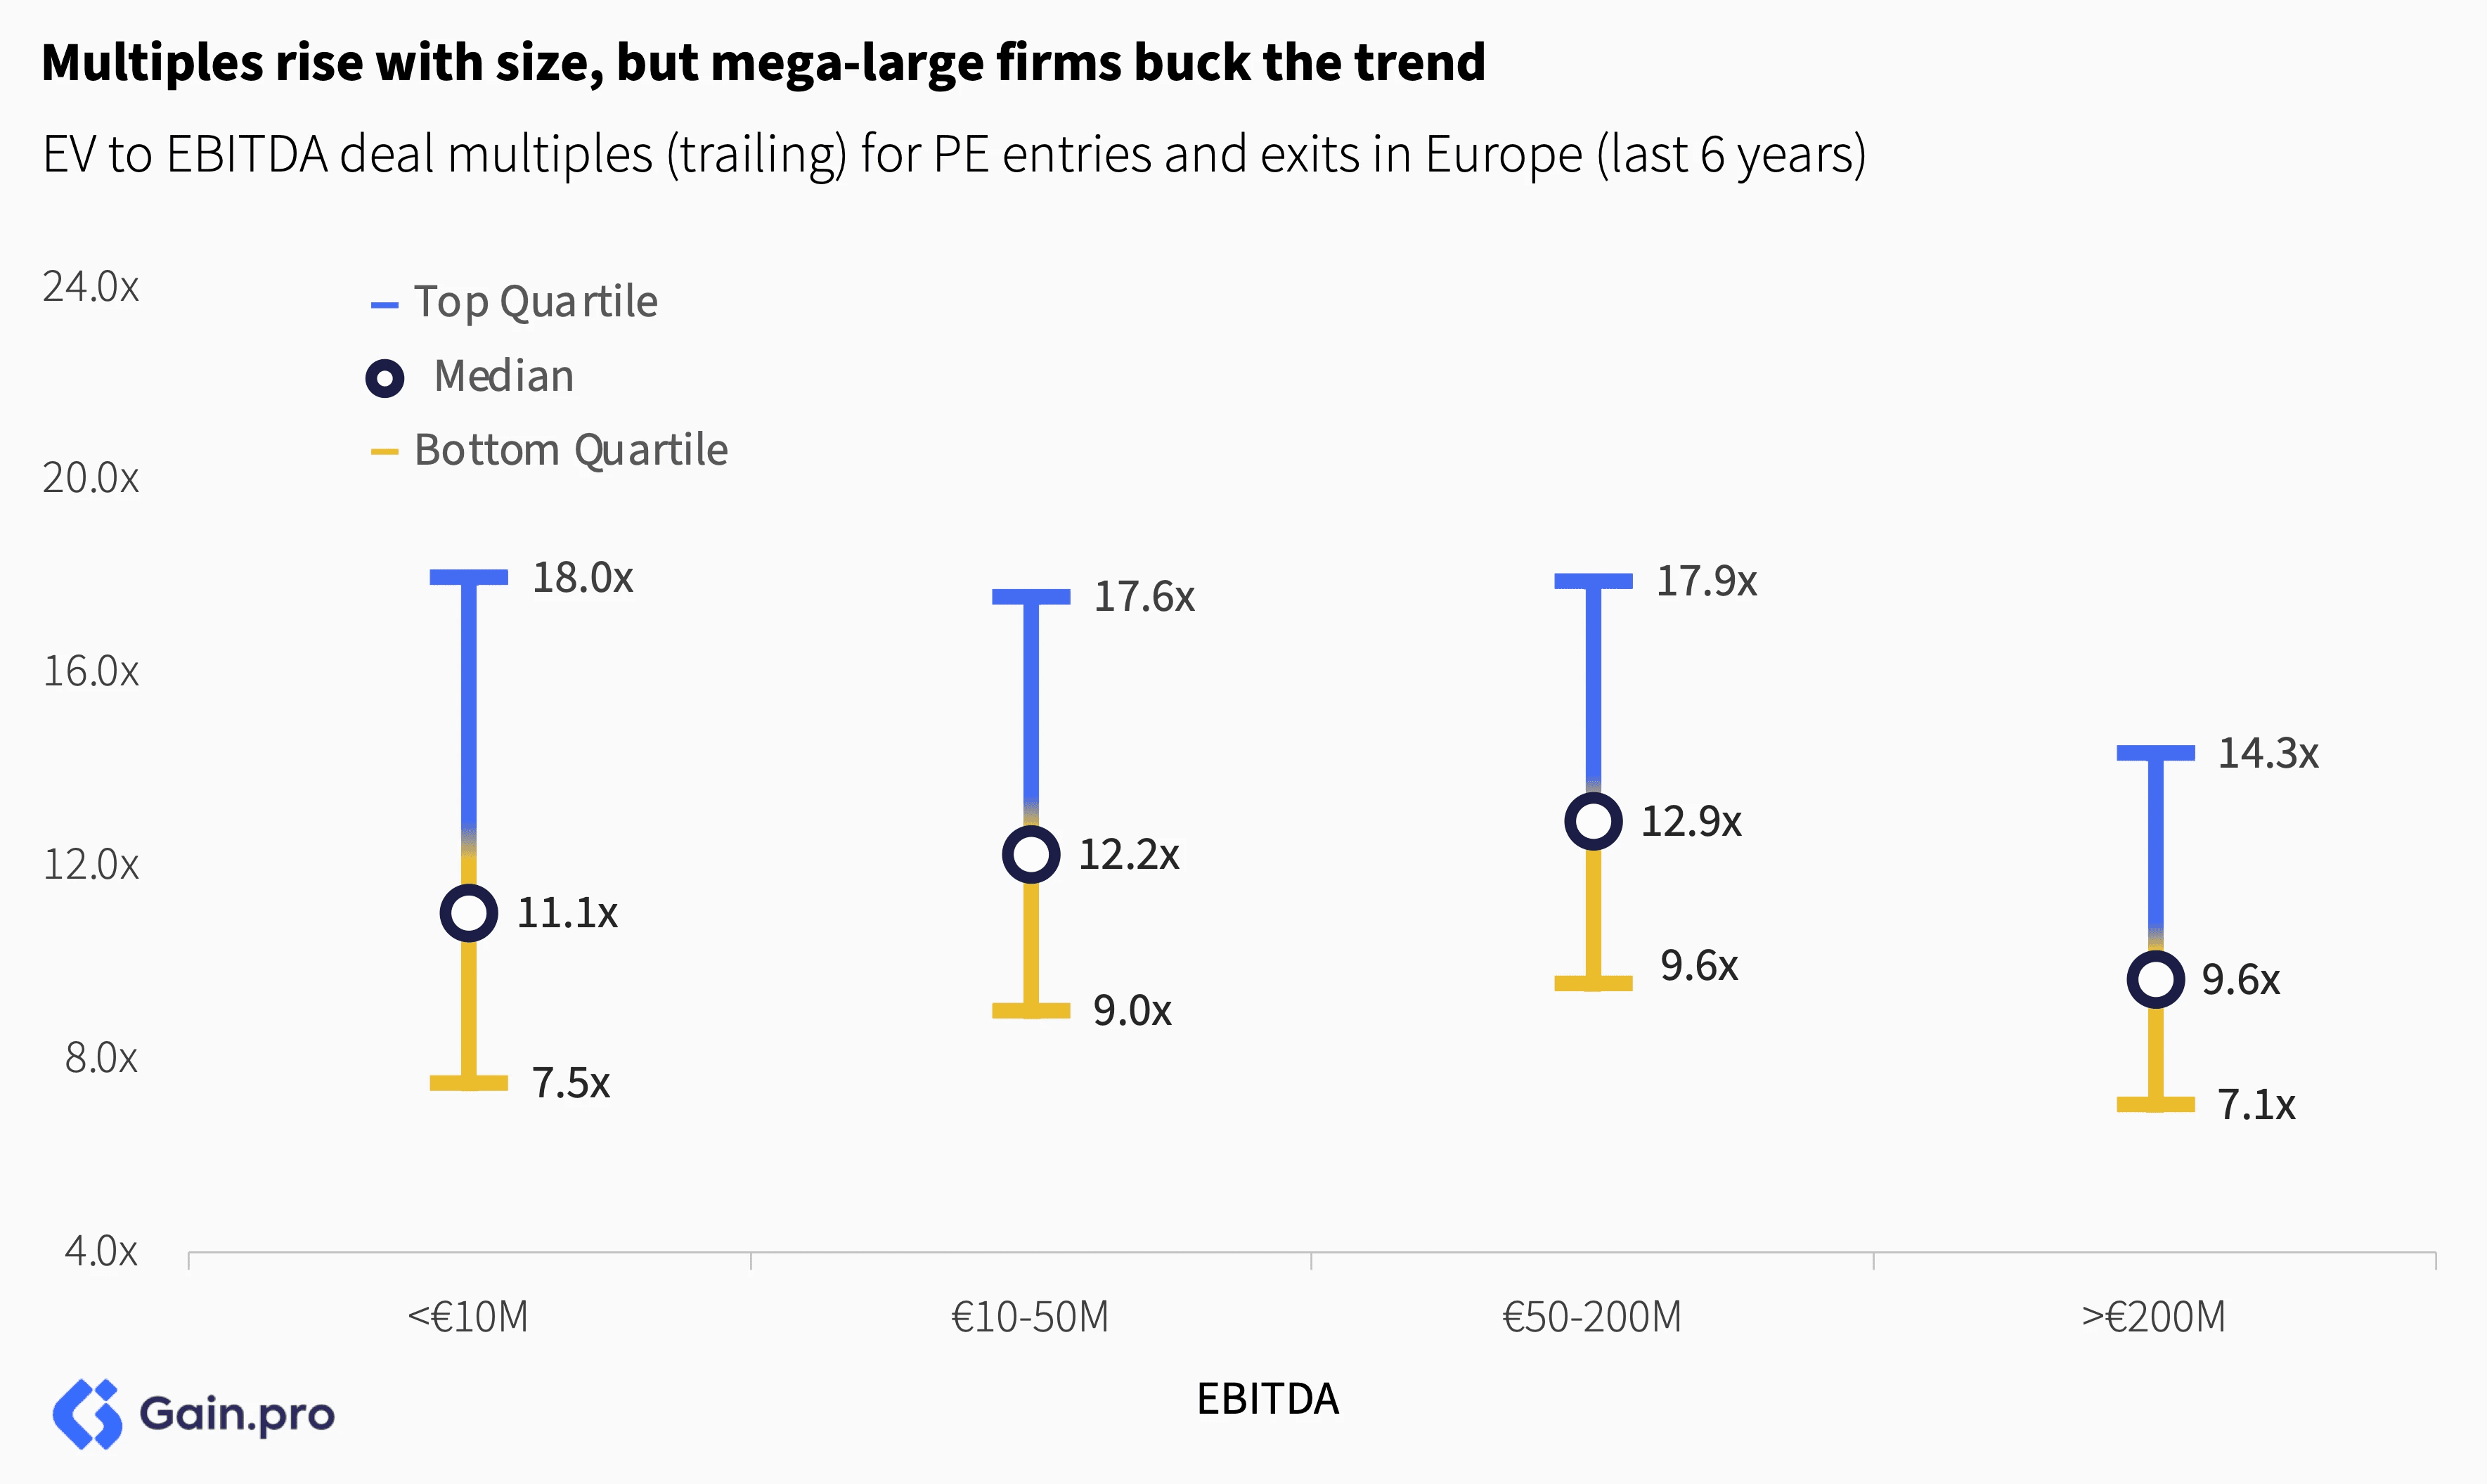
Multiples rise with size, but mega-large firms buck the trend. This exception is largely due to the high concentration of lower-growth assets among firms with EBITDA over €200 million.
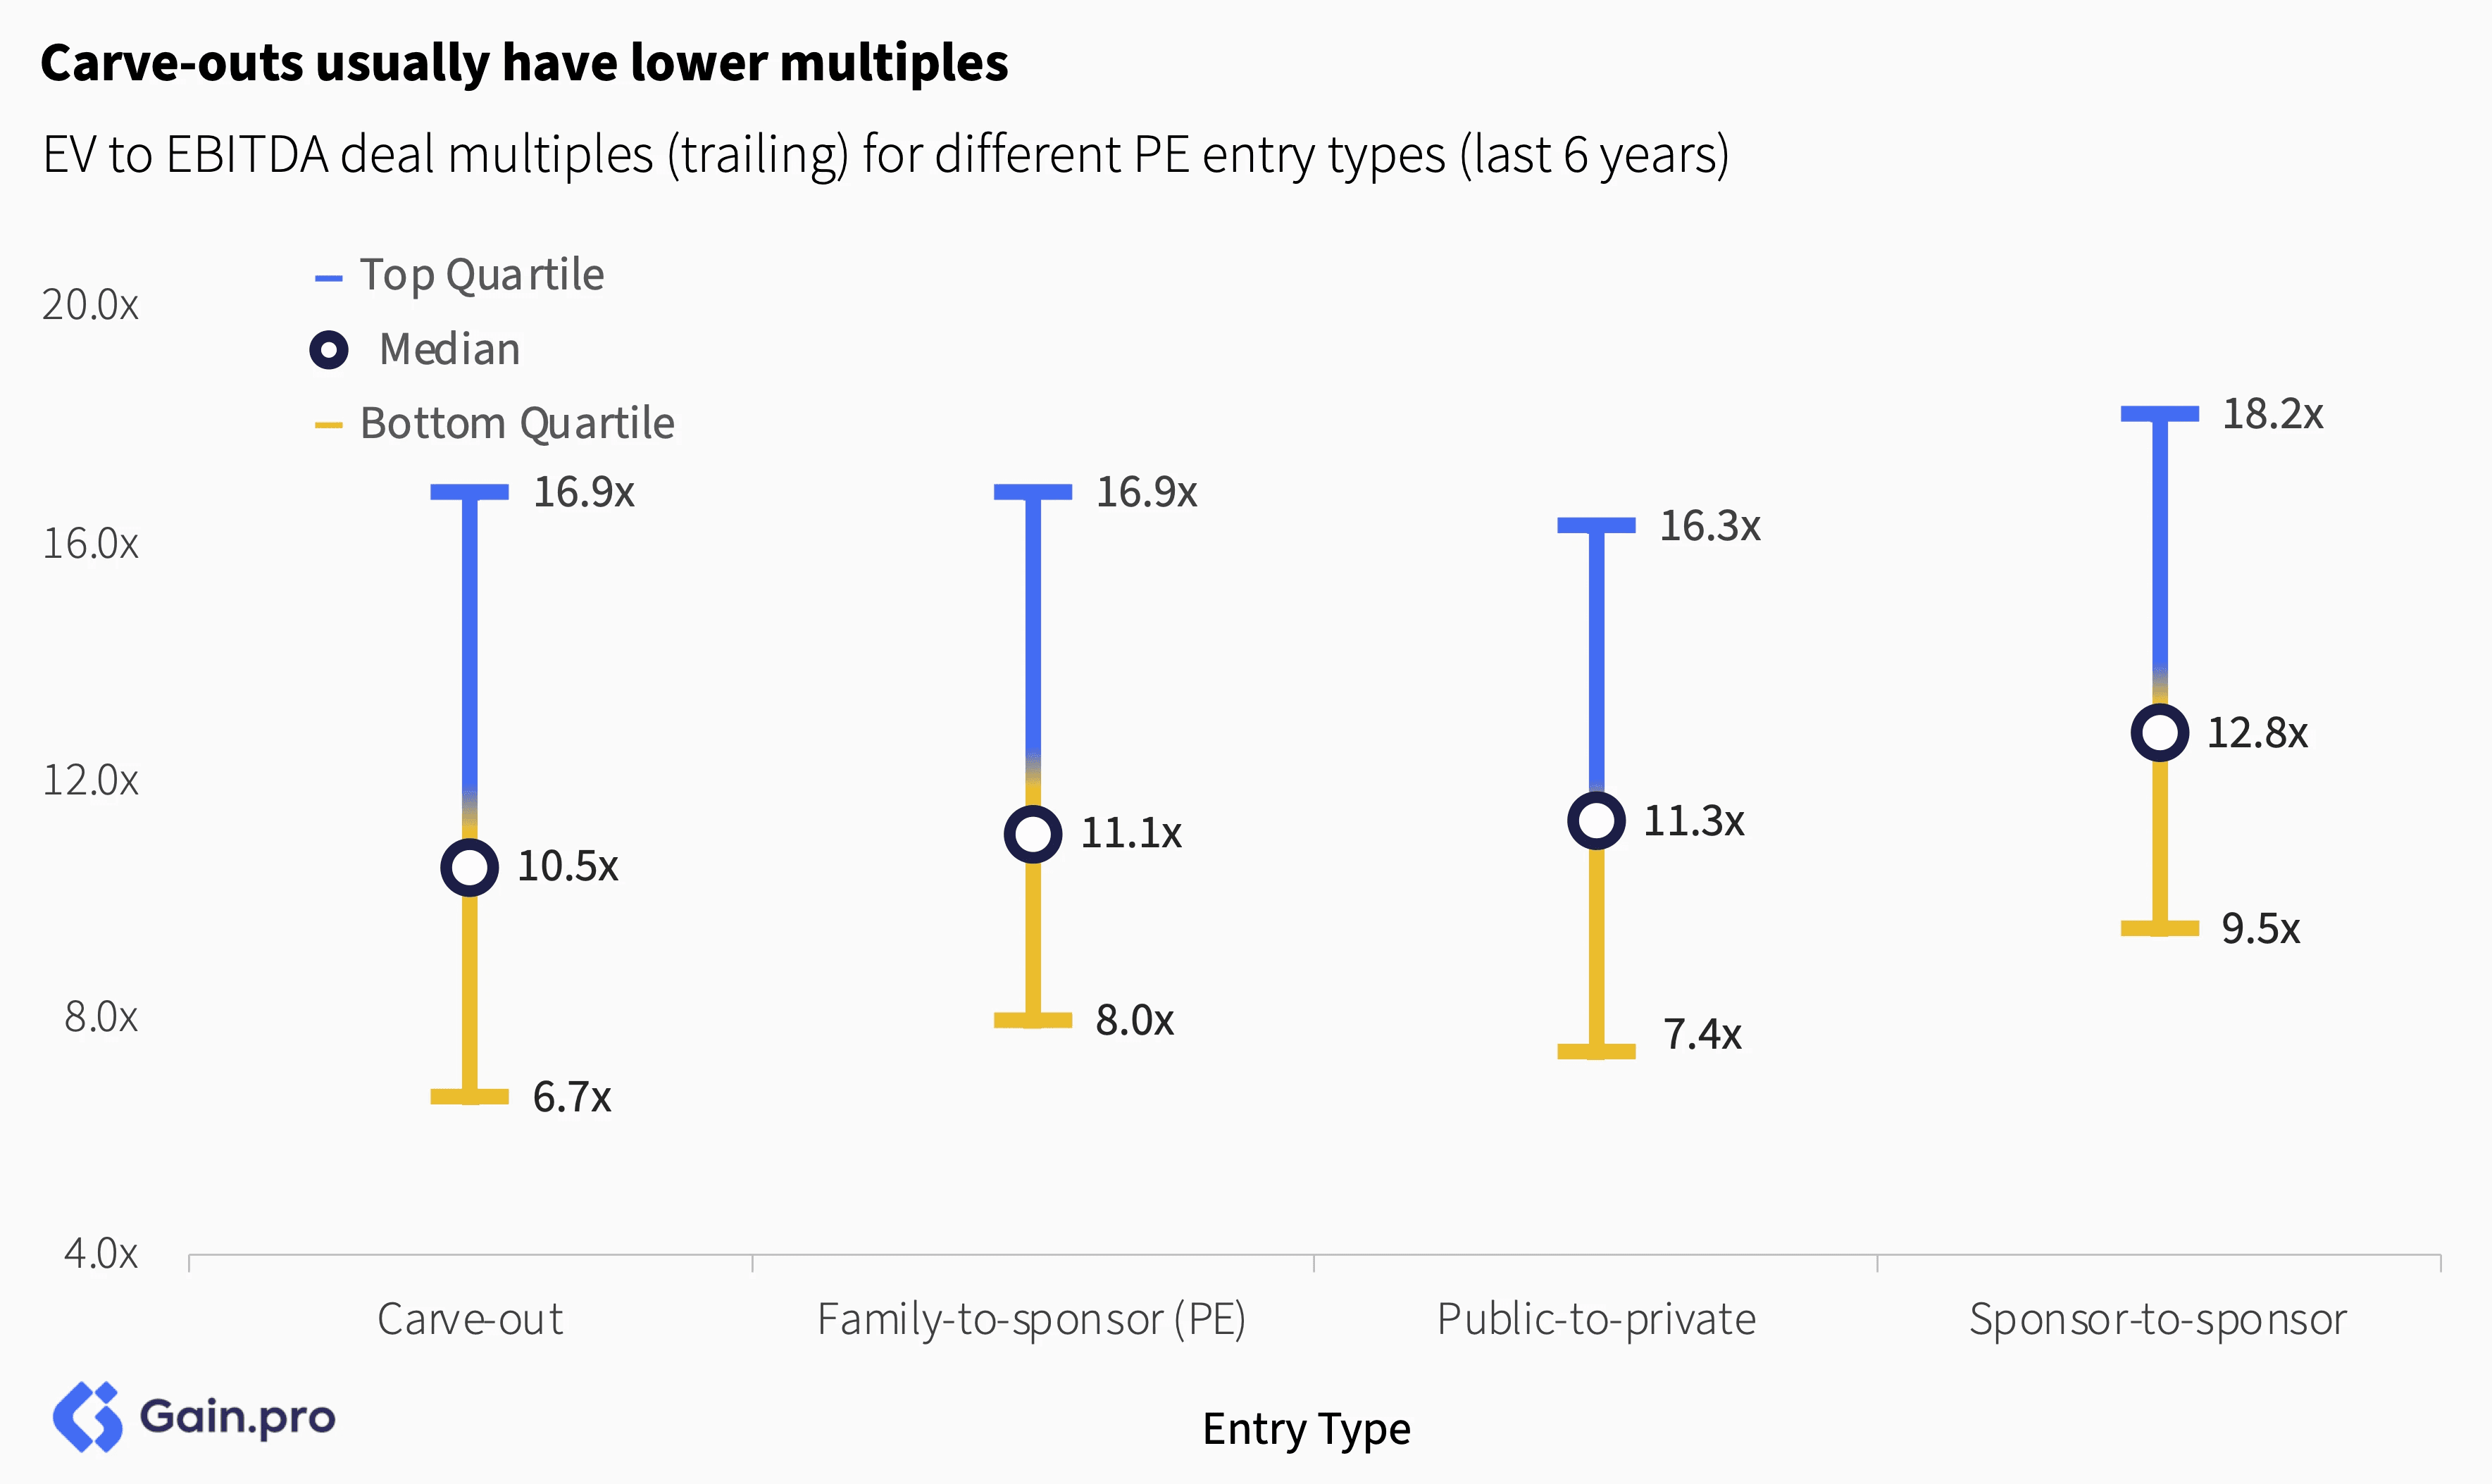
By entry type, carve-outs usually have lower multiples. These divisions tend to be underperforming and they need a lot of investment to build up all support functions post-acquisition.
Multiples are relatively similar for different exit types, except for IPOs which are higher. IPOs command higher multiples given the strong demand for faster-growing assets and interest from a diverse investor base. The downside? The exit isn't clean. You can't sell your full stake at once and you are exposed to share price performance.

By Sector & Region
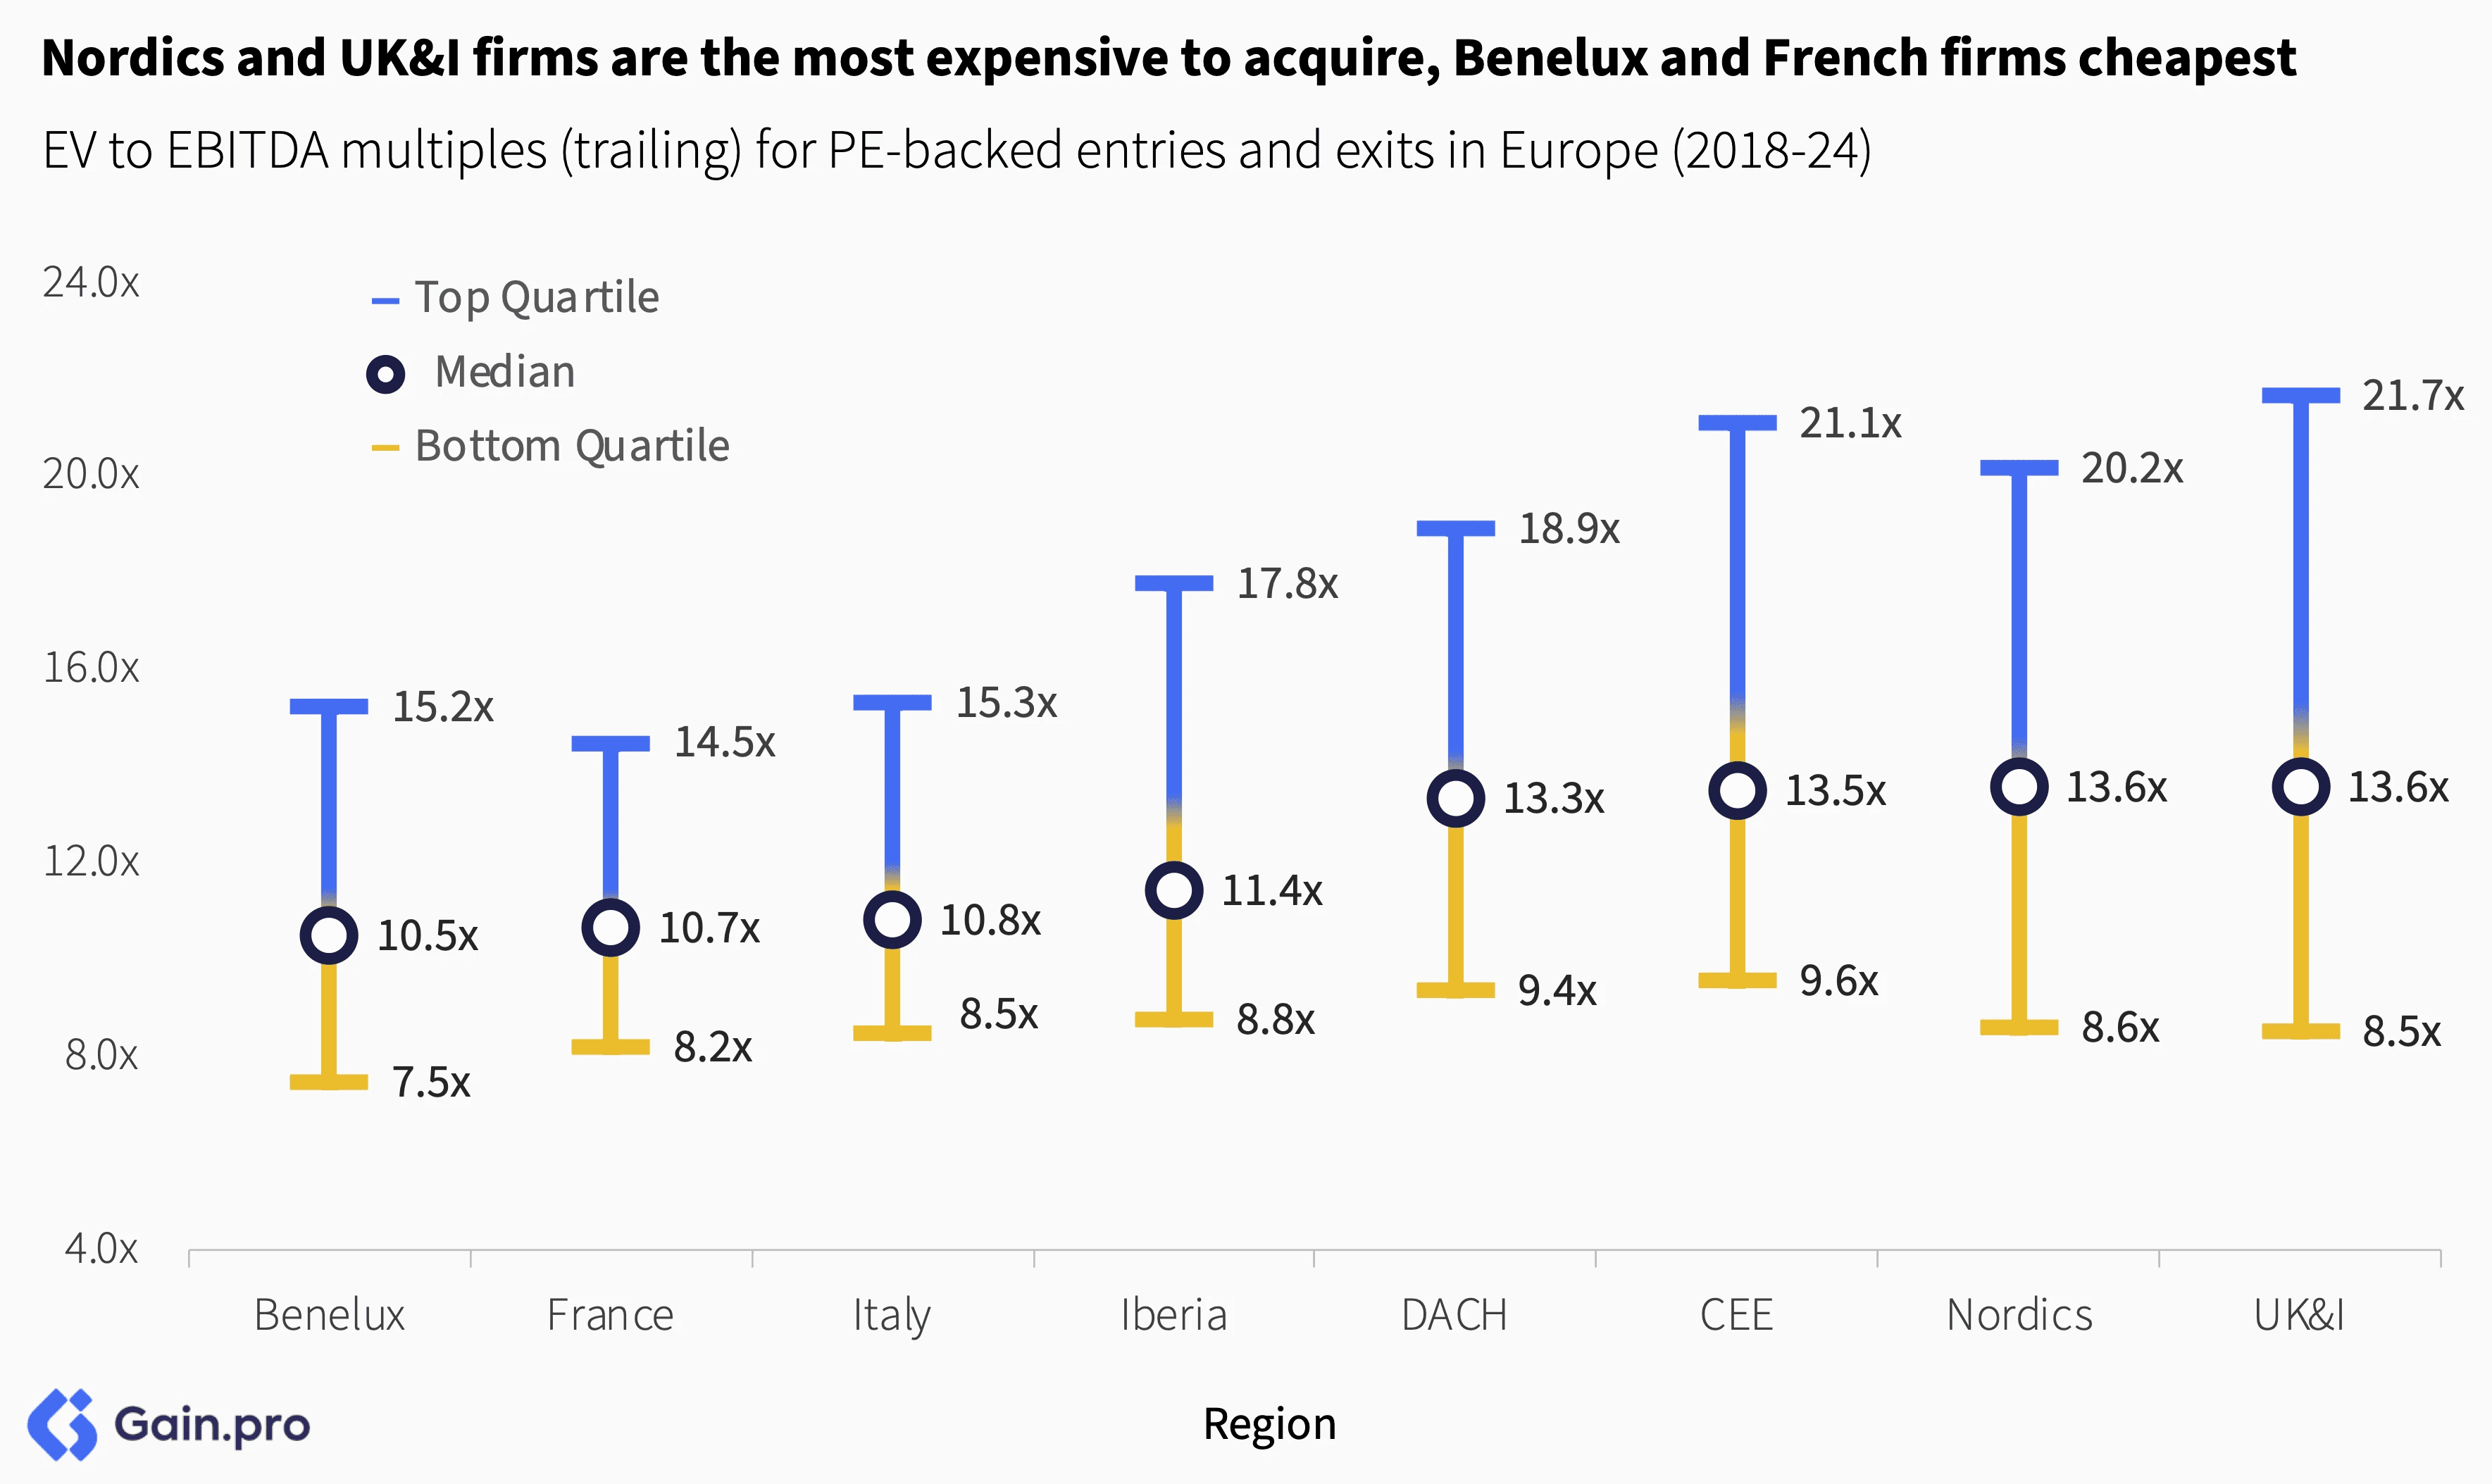
TMT and Science & Health command a healthy premium over other sectors driven by their high growth rates, attractive margins and resilience. On the other side, multiples are significantly lower for slower-growth sectors such as Industrials and Consumer.

PE multiples are highest in Nordics and UK&I. Nordics is home to some of the fastest-growing assets and has a sector tilt towards high-growth TMT and Services sectors which have higher multiples. UK&I is one of the most penetrated PE markets with stiff competition from local and international players. On the other side, entry multiples are lower in Benelux and France, which have a higher share of Industrials and Consumer assets and more domestic investors.
Chapter 05: Portfolio Stats
Revenue Growth
Growth for PE-backed assets is coming off cycle highs, down vs. 2022 and 2021. The median PE-backed business grew 12.4% in 2023 vs. 19.5% in 2022 and 17.1% in 2021. Growth is key to PE value creation and a further weakening could become a worrying factor.

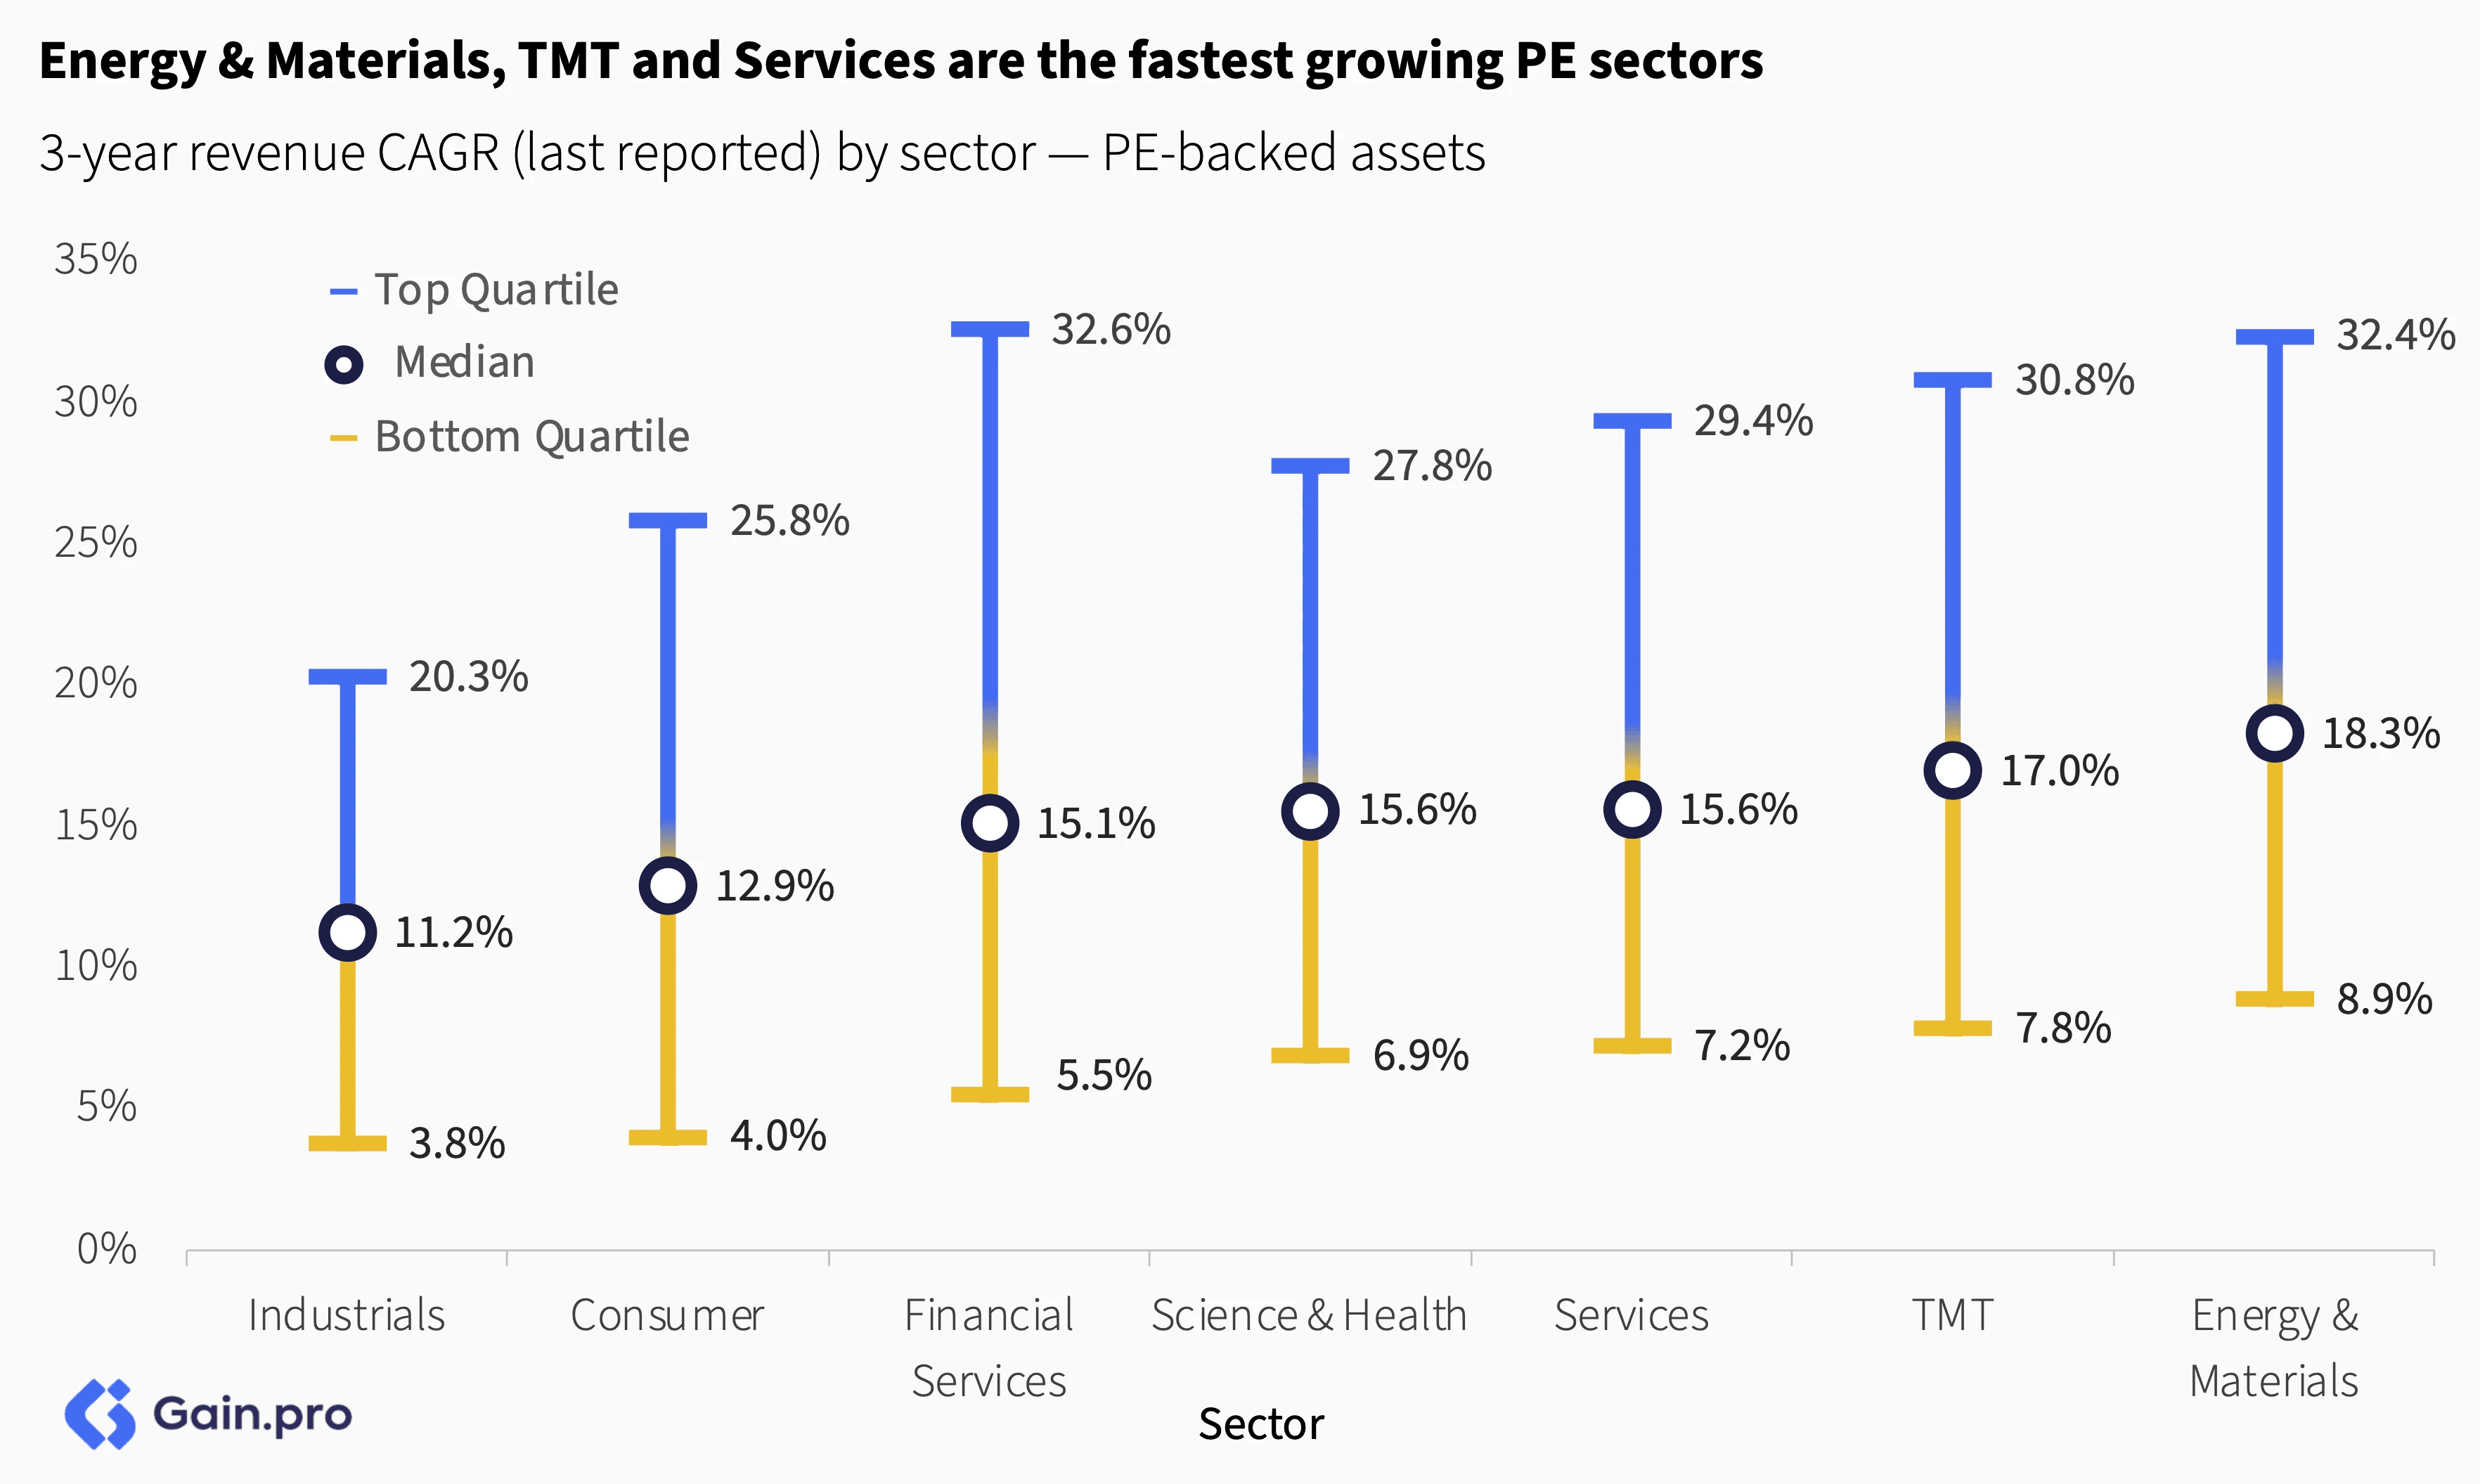
Energy & Materials, TMT and Services are the fastest-growing PE sectors, while Consumer and Industrials lag behind. The Energy sector, particularly assets in renewable and EV distribution plays, have benefited from the record-level of energy prices and regulatory stimuli. TMT and Science & Health, in addition to having strong organic growth, also have above-average buy-and-build activity.
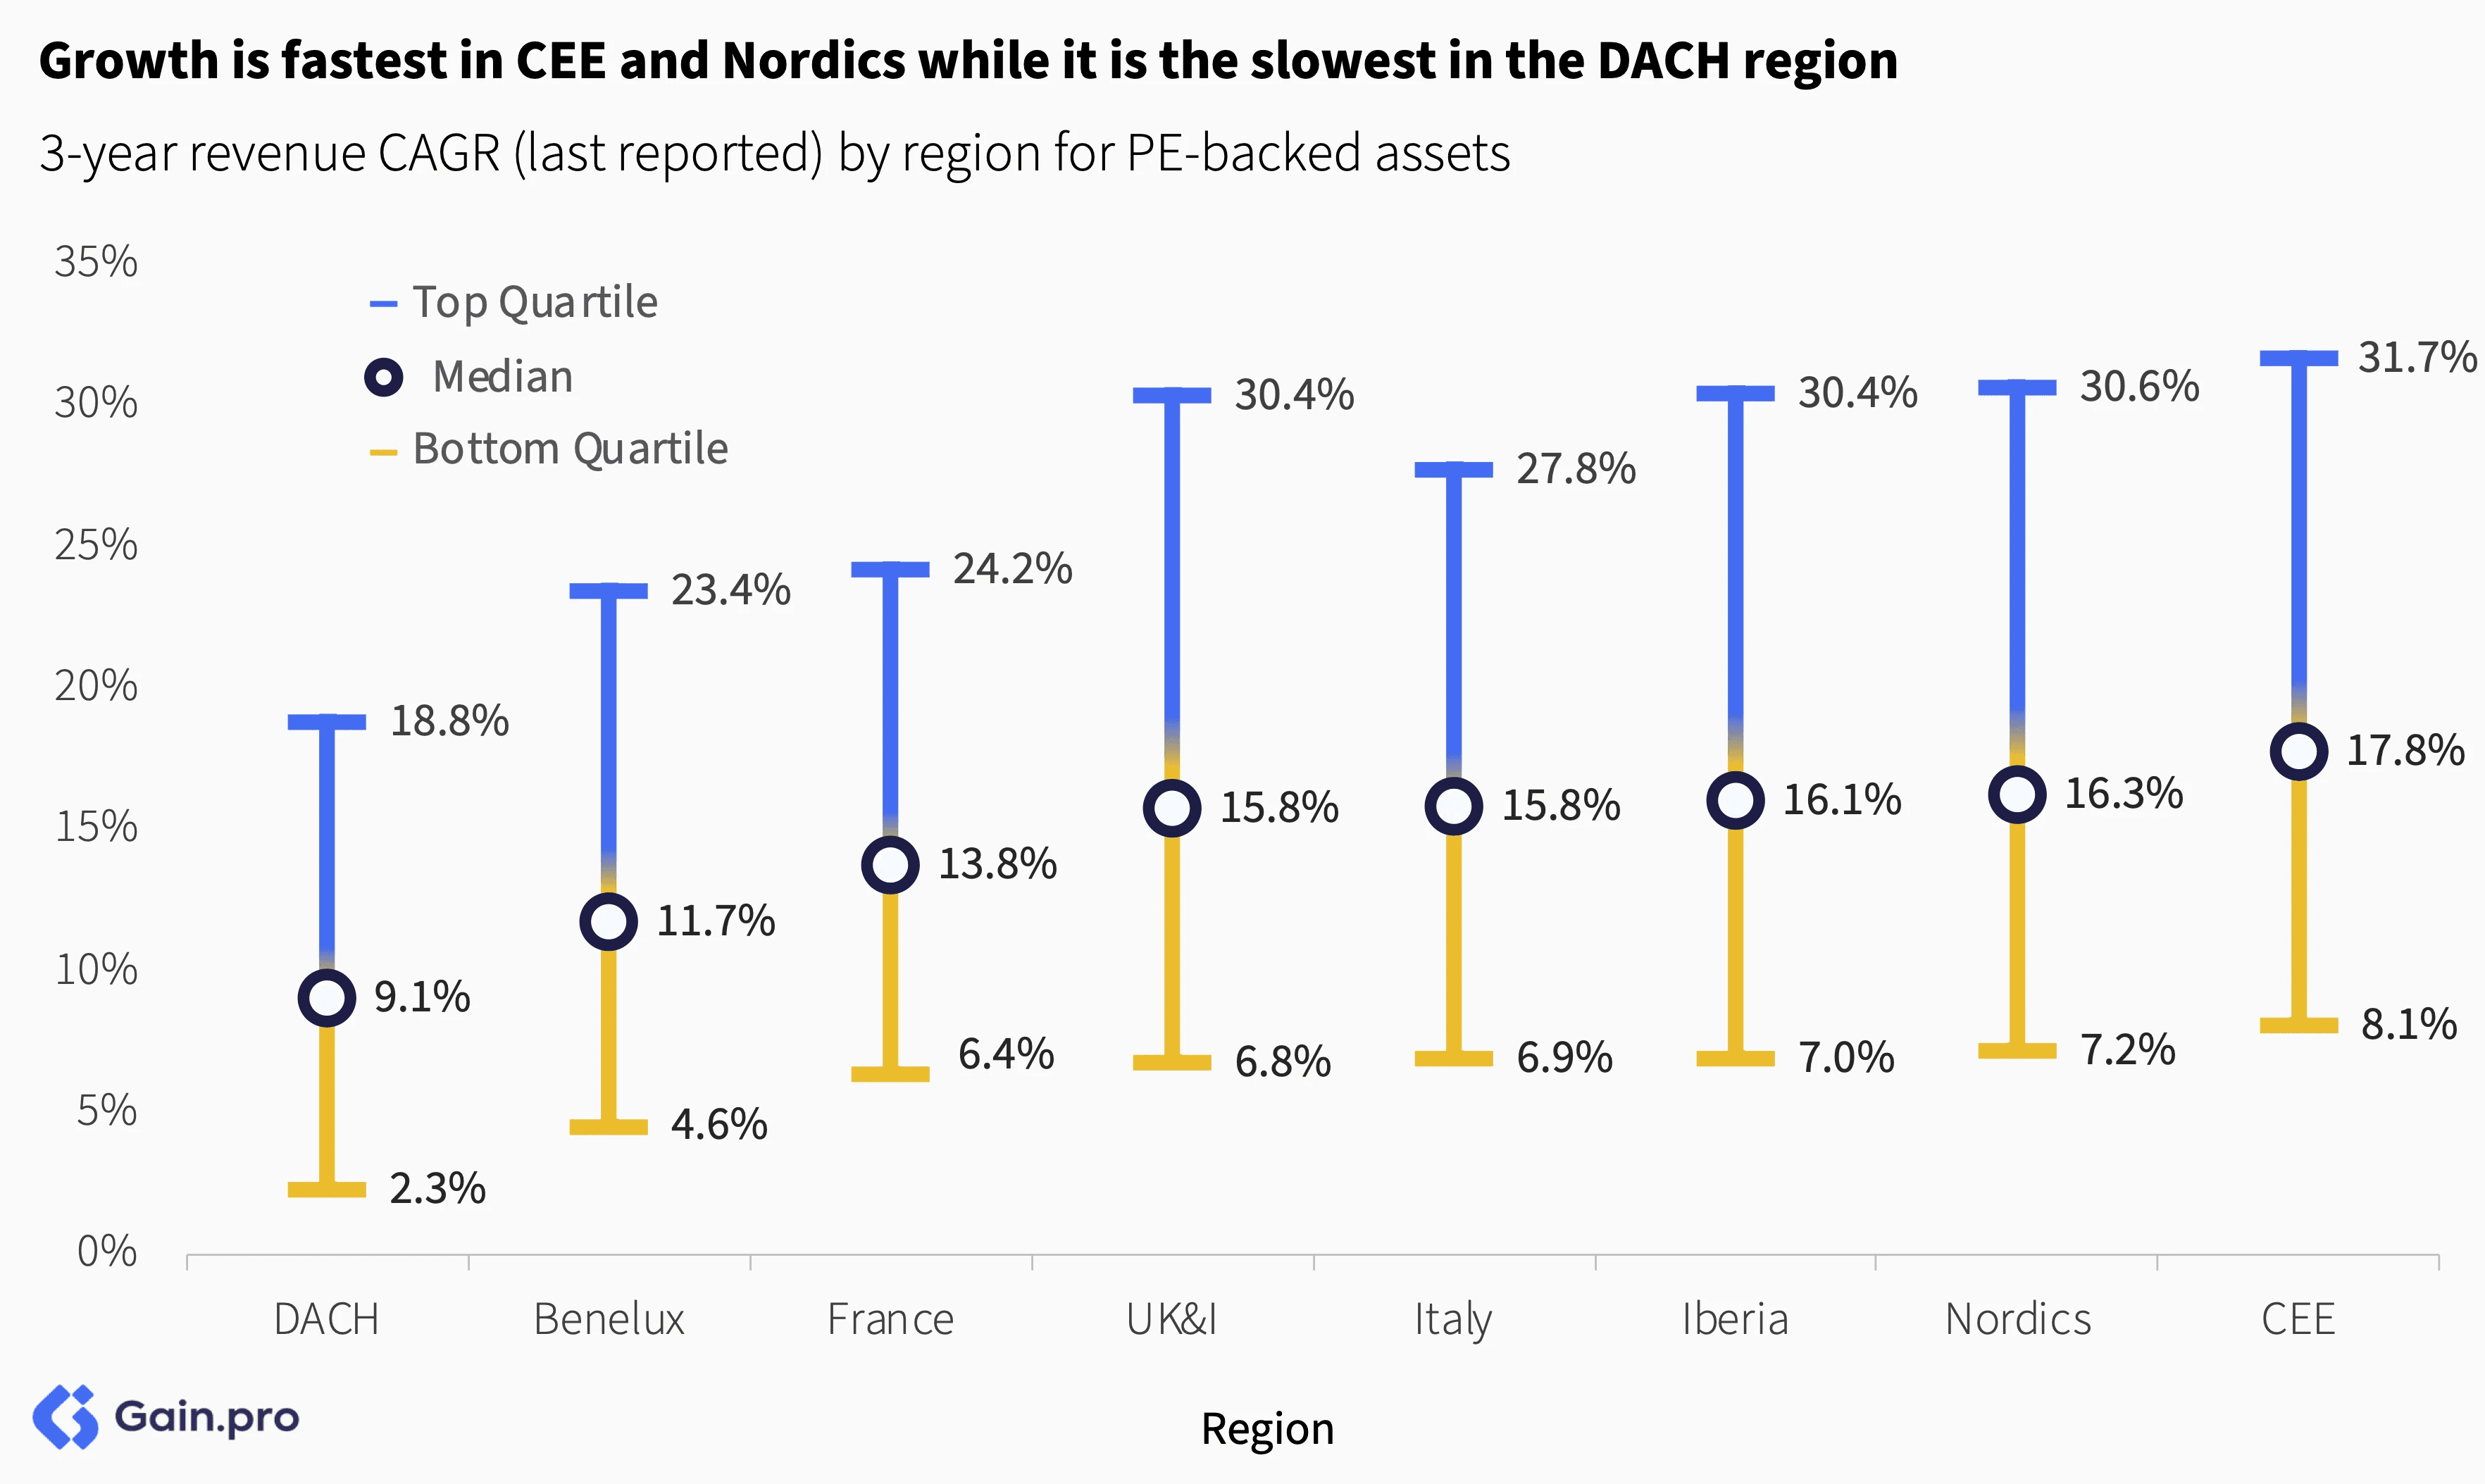
Growth is fastest in CEE and Nordics and slowest in DACH. CEE has a high concentration of fast-growing young businesses while the Nordics region is home to a lot of fast-growing TMT and Services businesses. In contrast, DACH is home to many mid to slow-growing Industrials assets.
EBITDA Margins
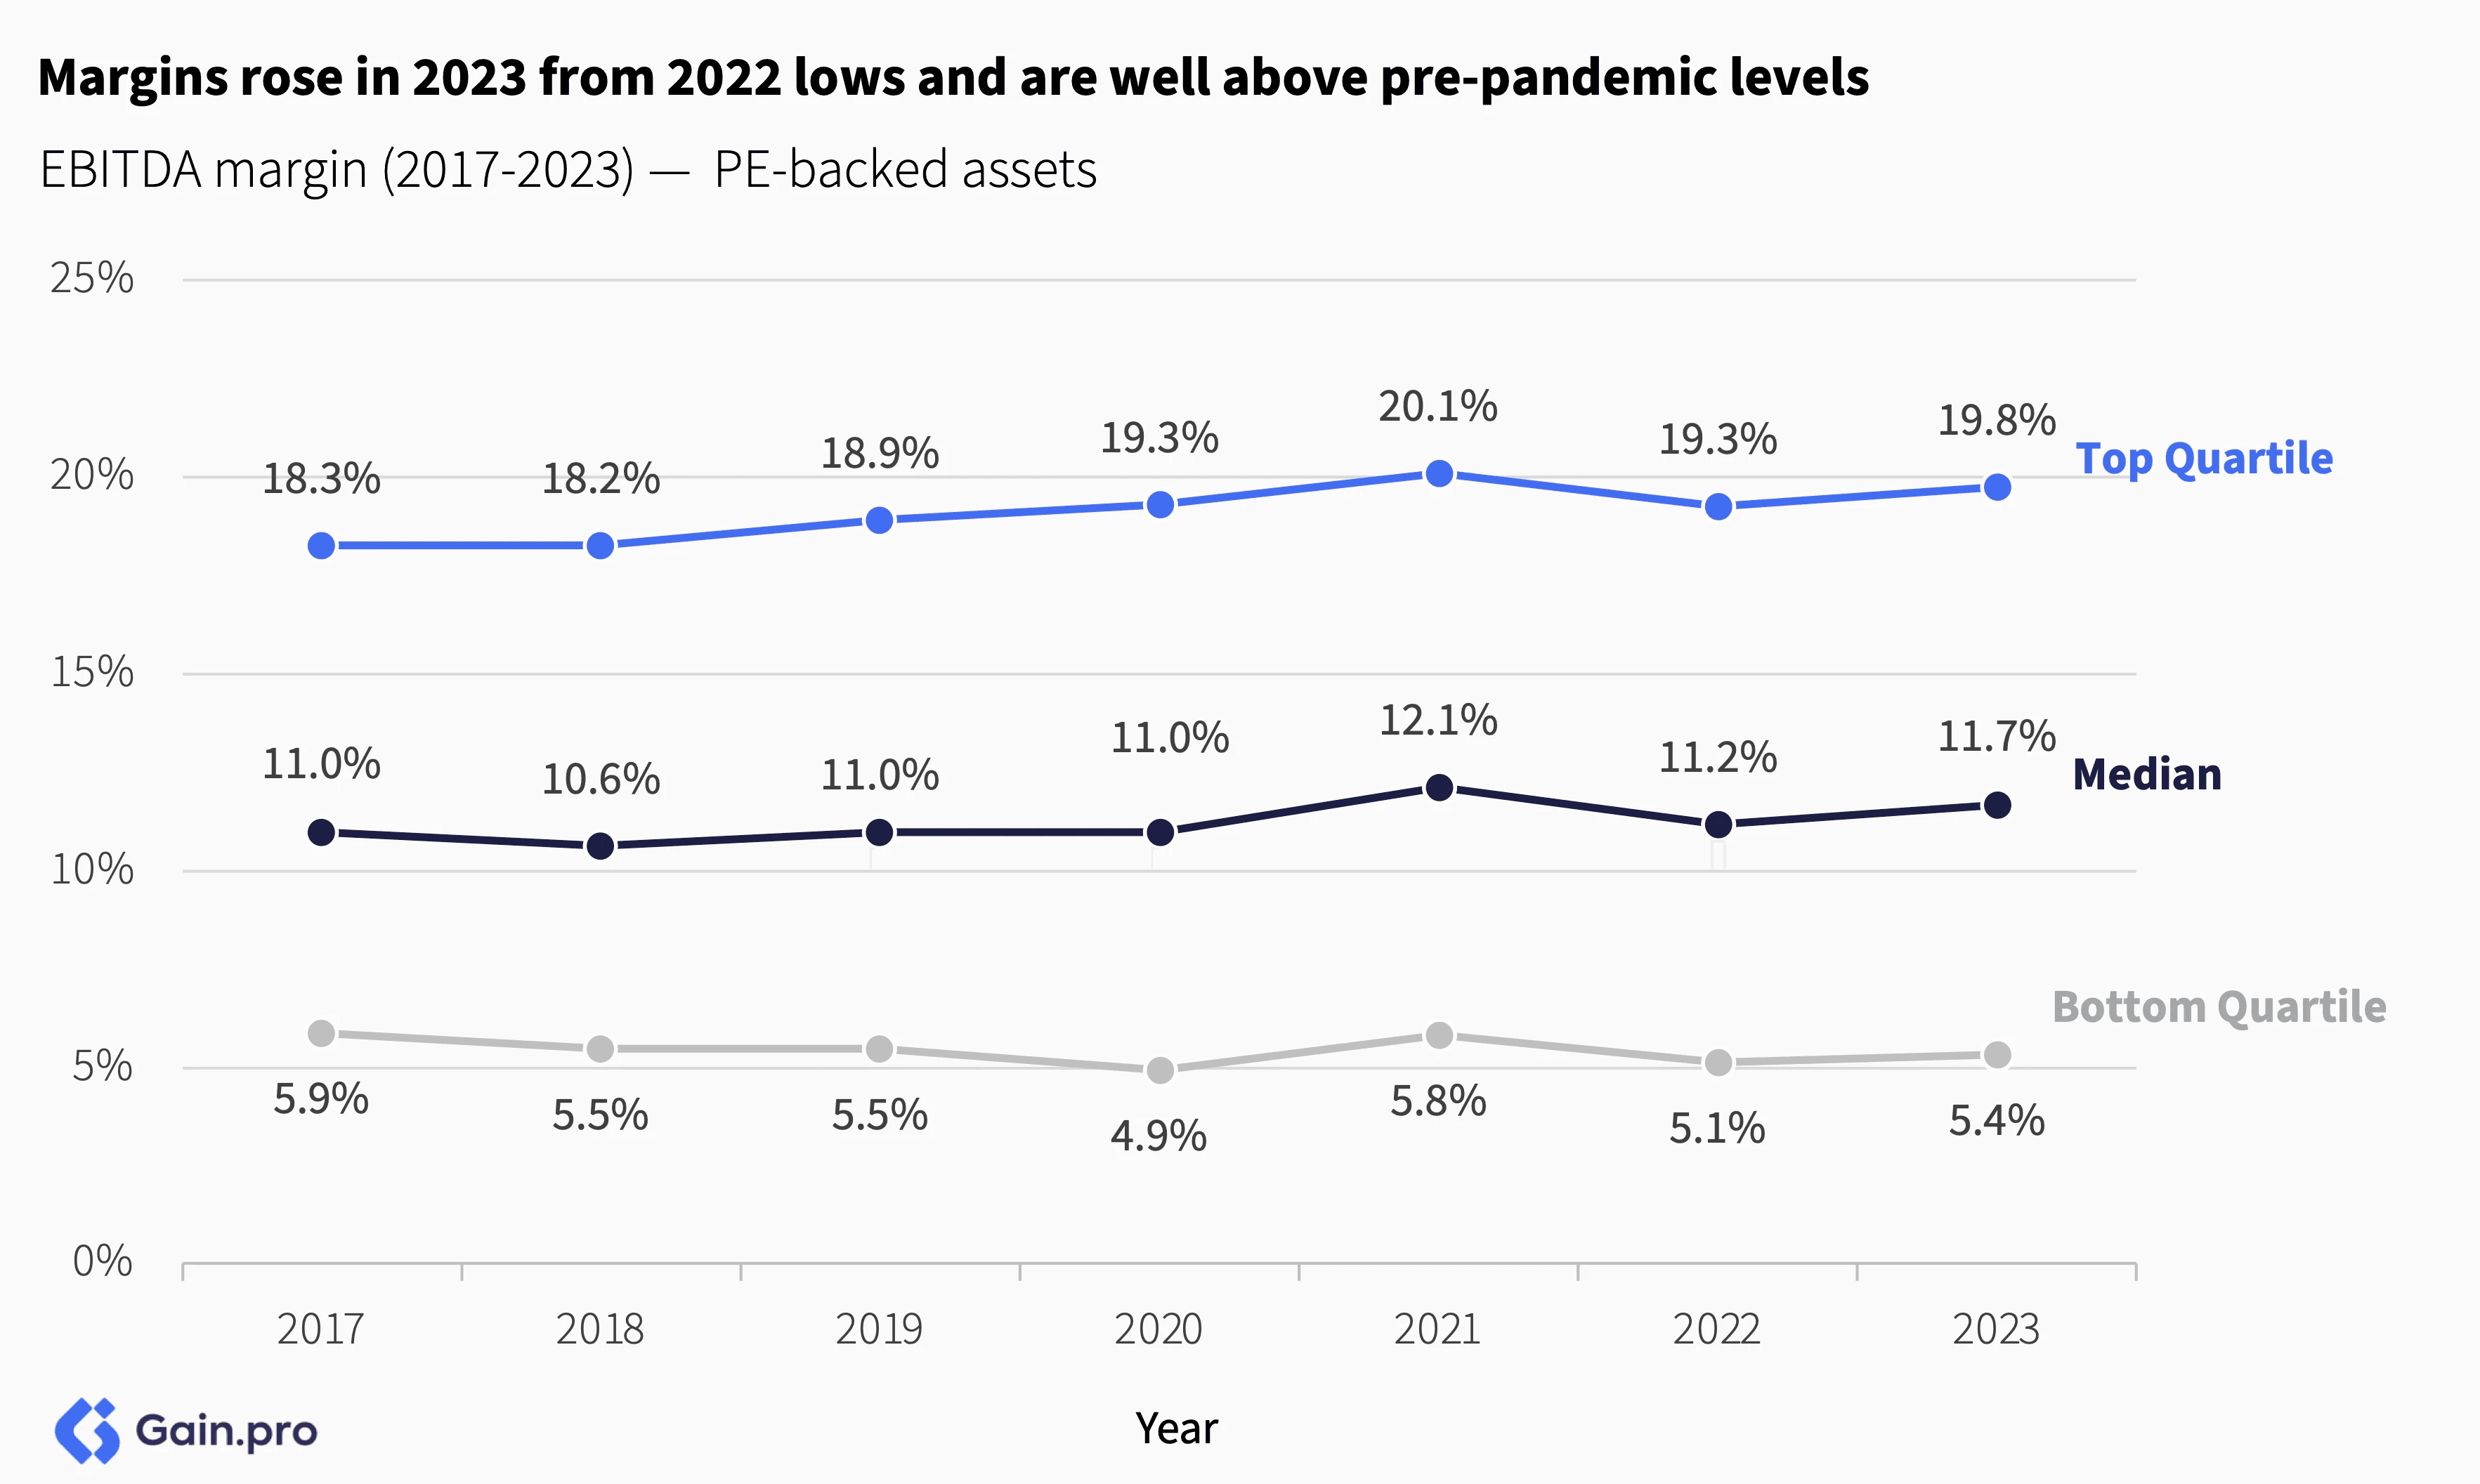
EBITDA margins for PE-backed businesses have expanded slightly over the last few years. The median PE-owned asset has a margin of 11.7% now (up from 11.0% in 2017). Further, the spread between quartiles has remained stable, as has the relative outperformance of high-margin businesses.
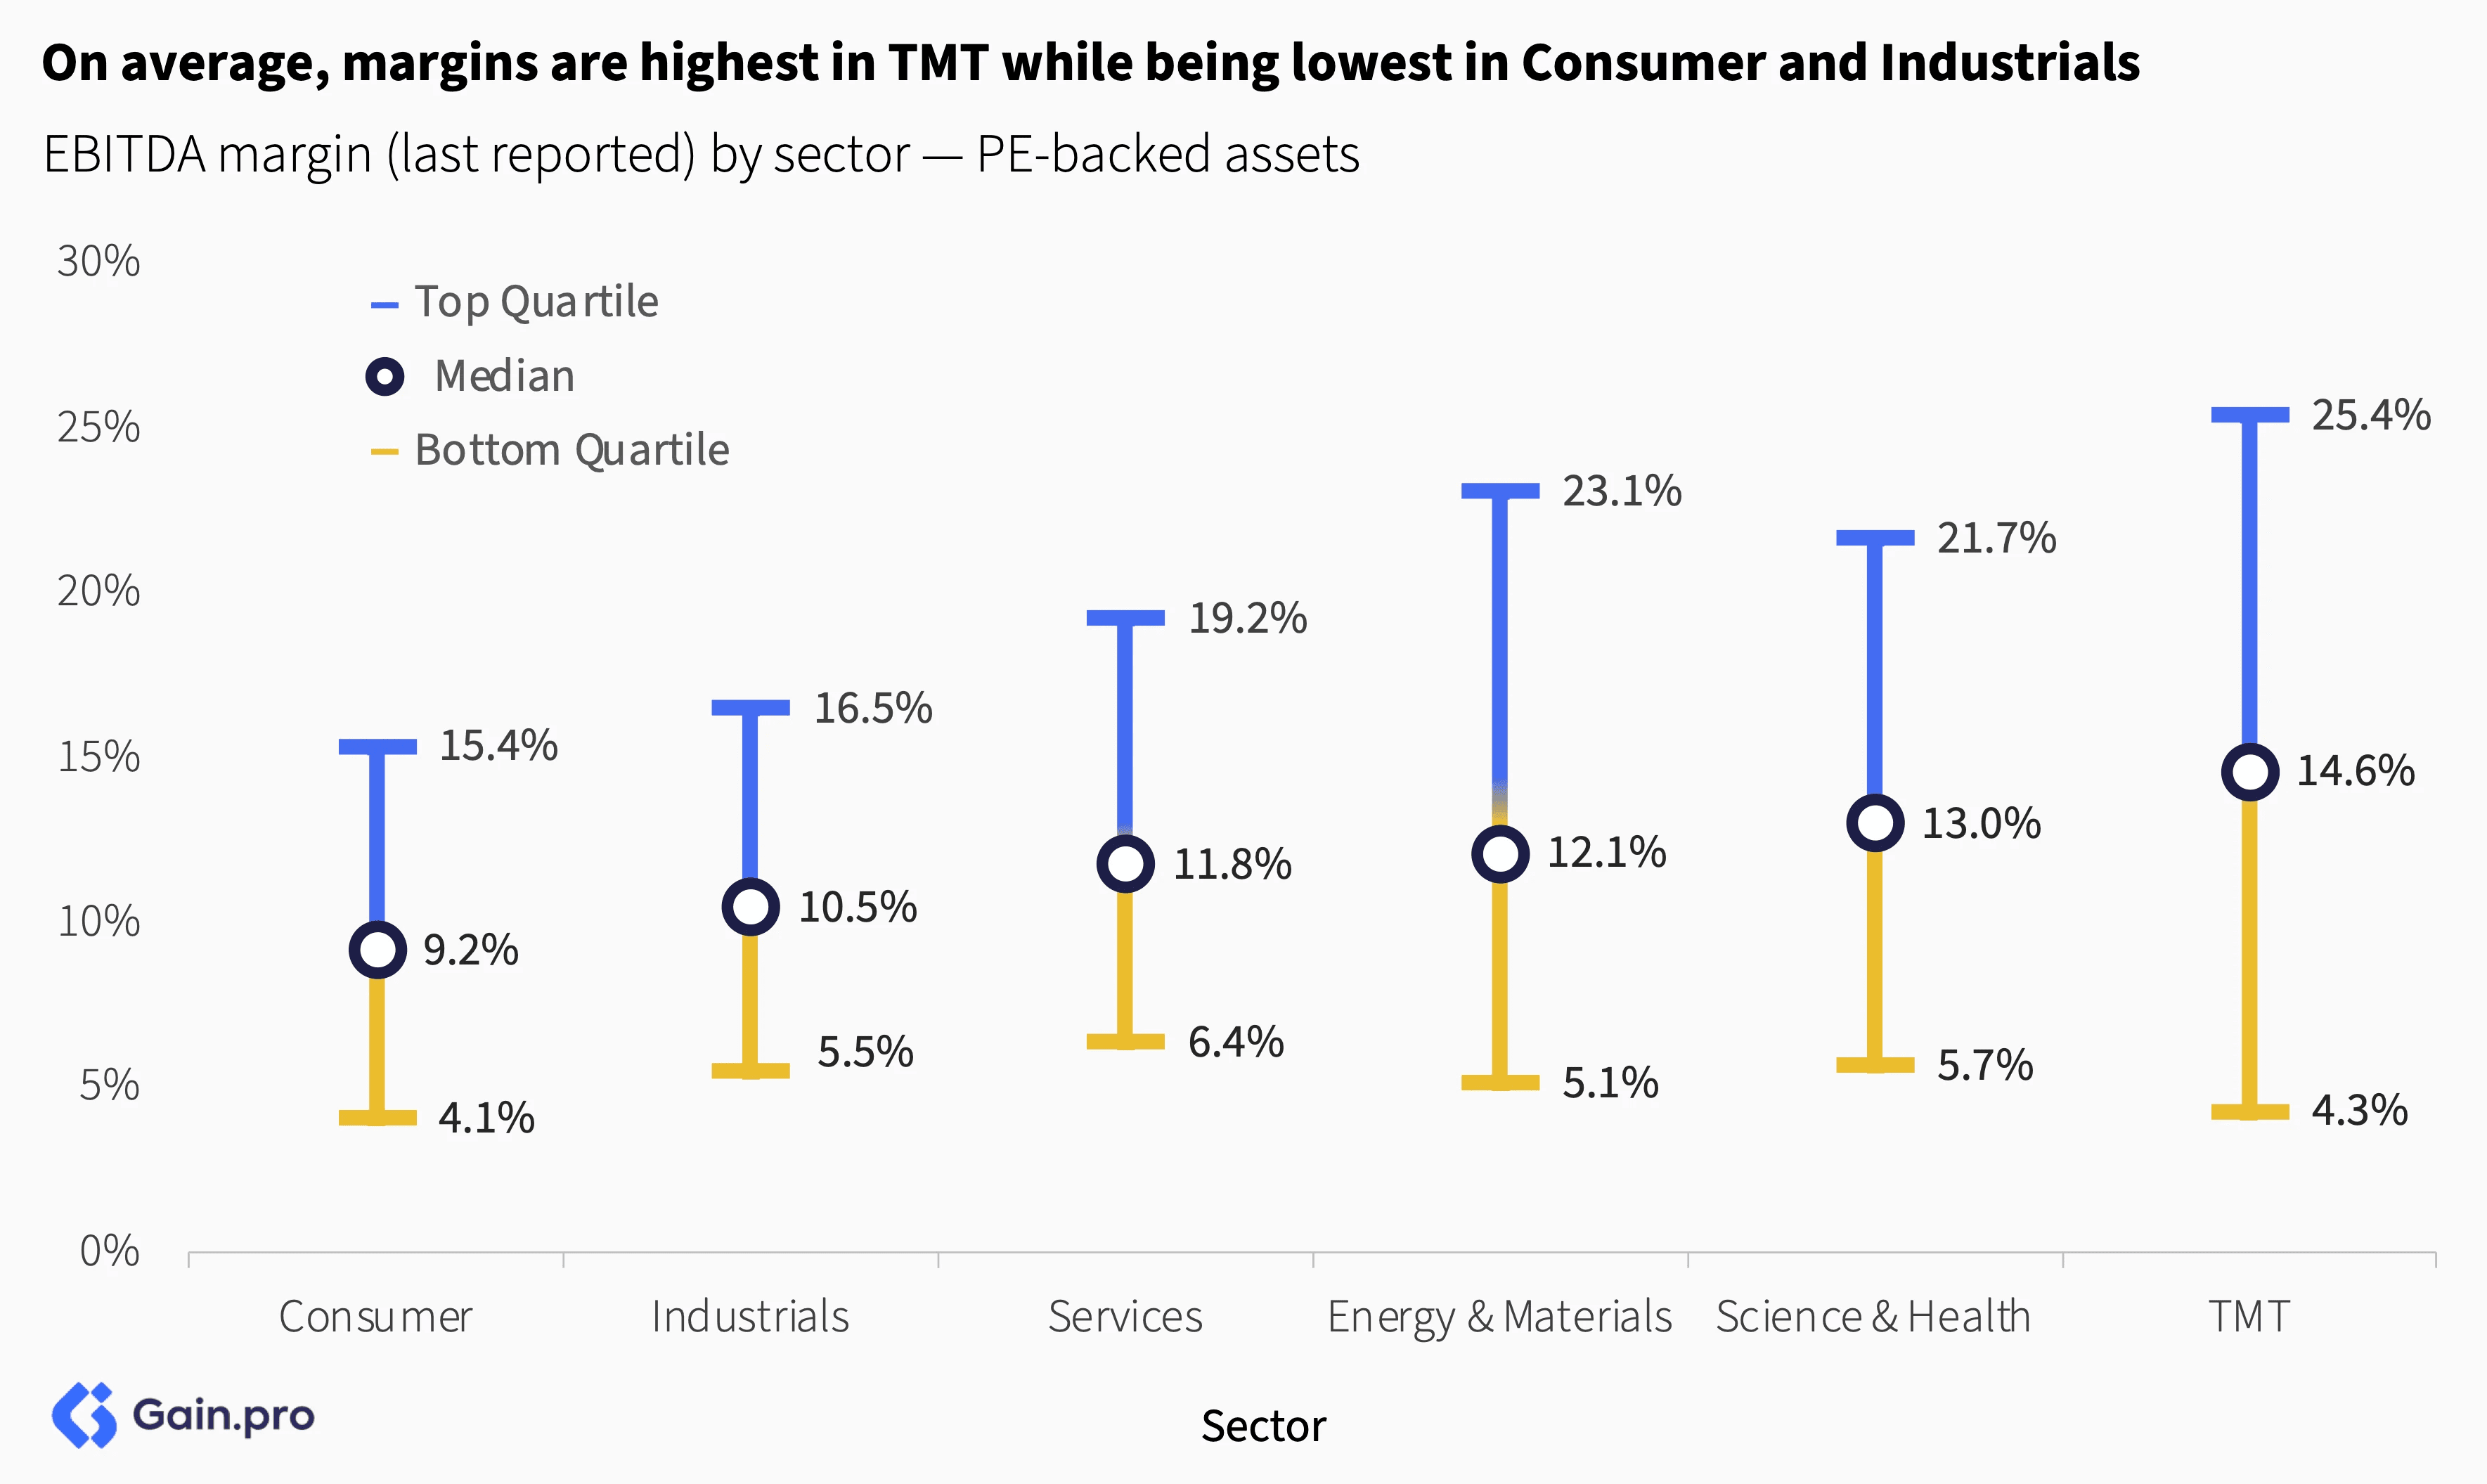
Margins are the highest in asset-light sectors such as TMT and Science & Health which also have scale benefits. On the flip side, margins are lowest in Consumer and Industrials which have low gross margins and high operational costs.
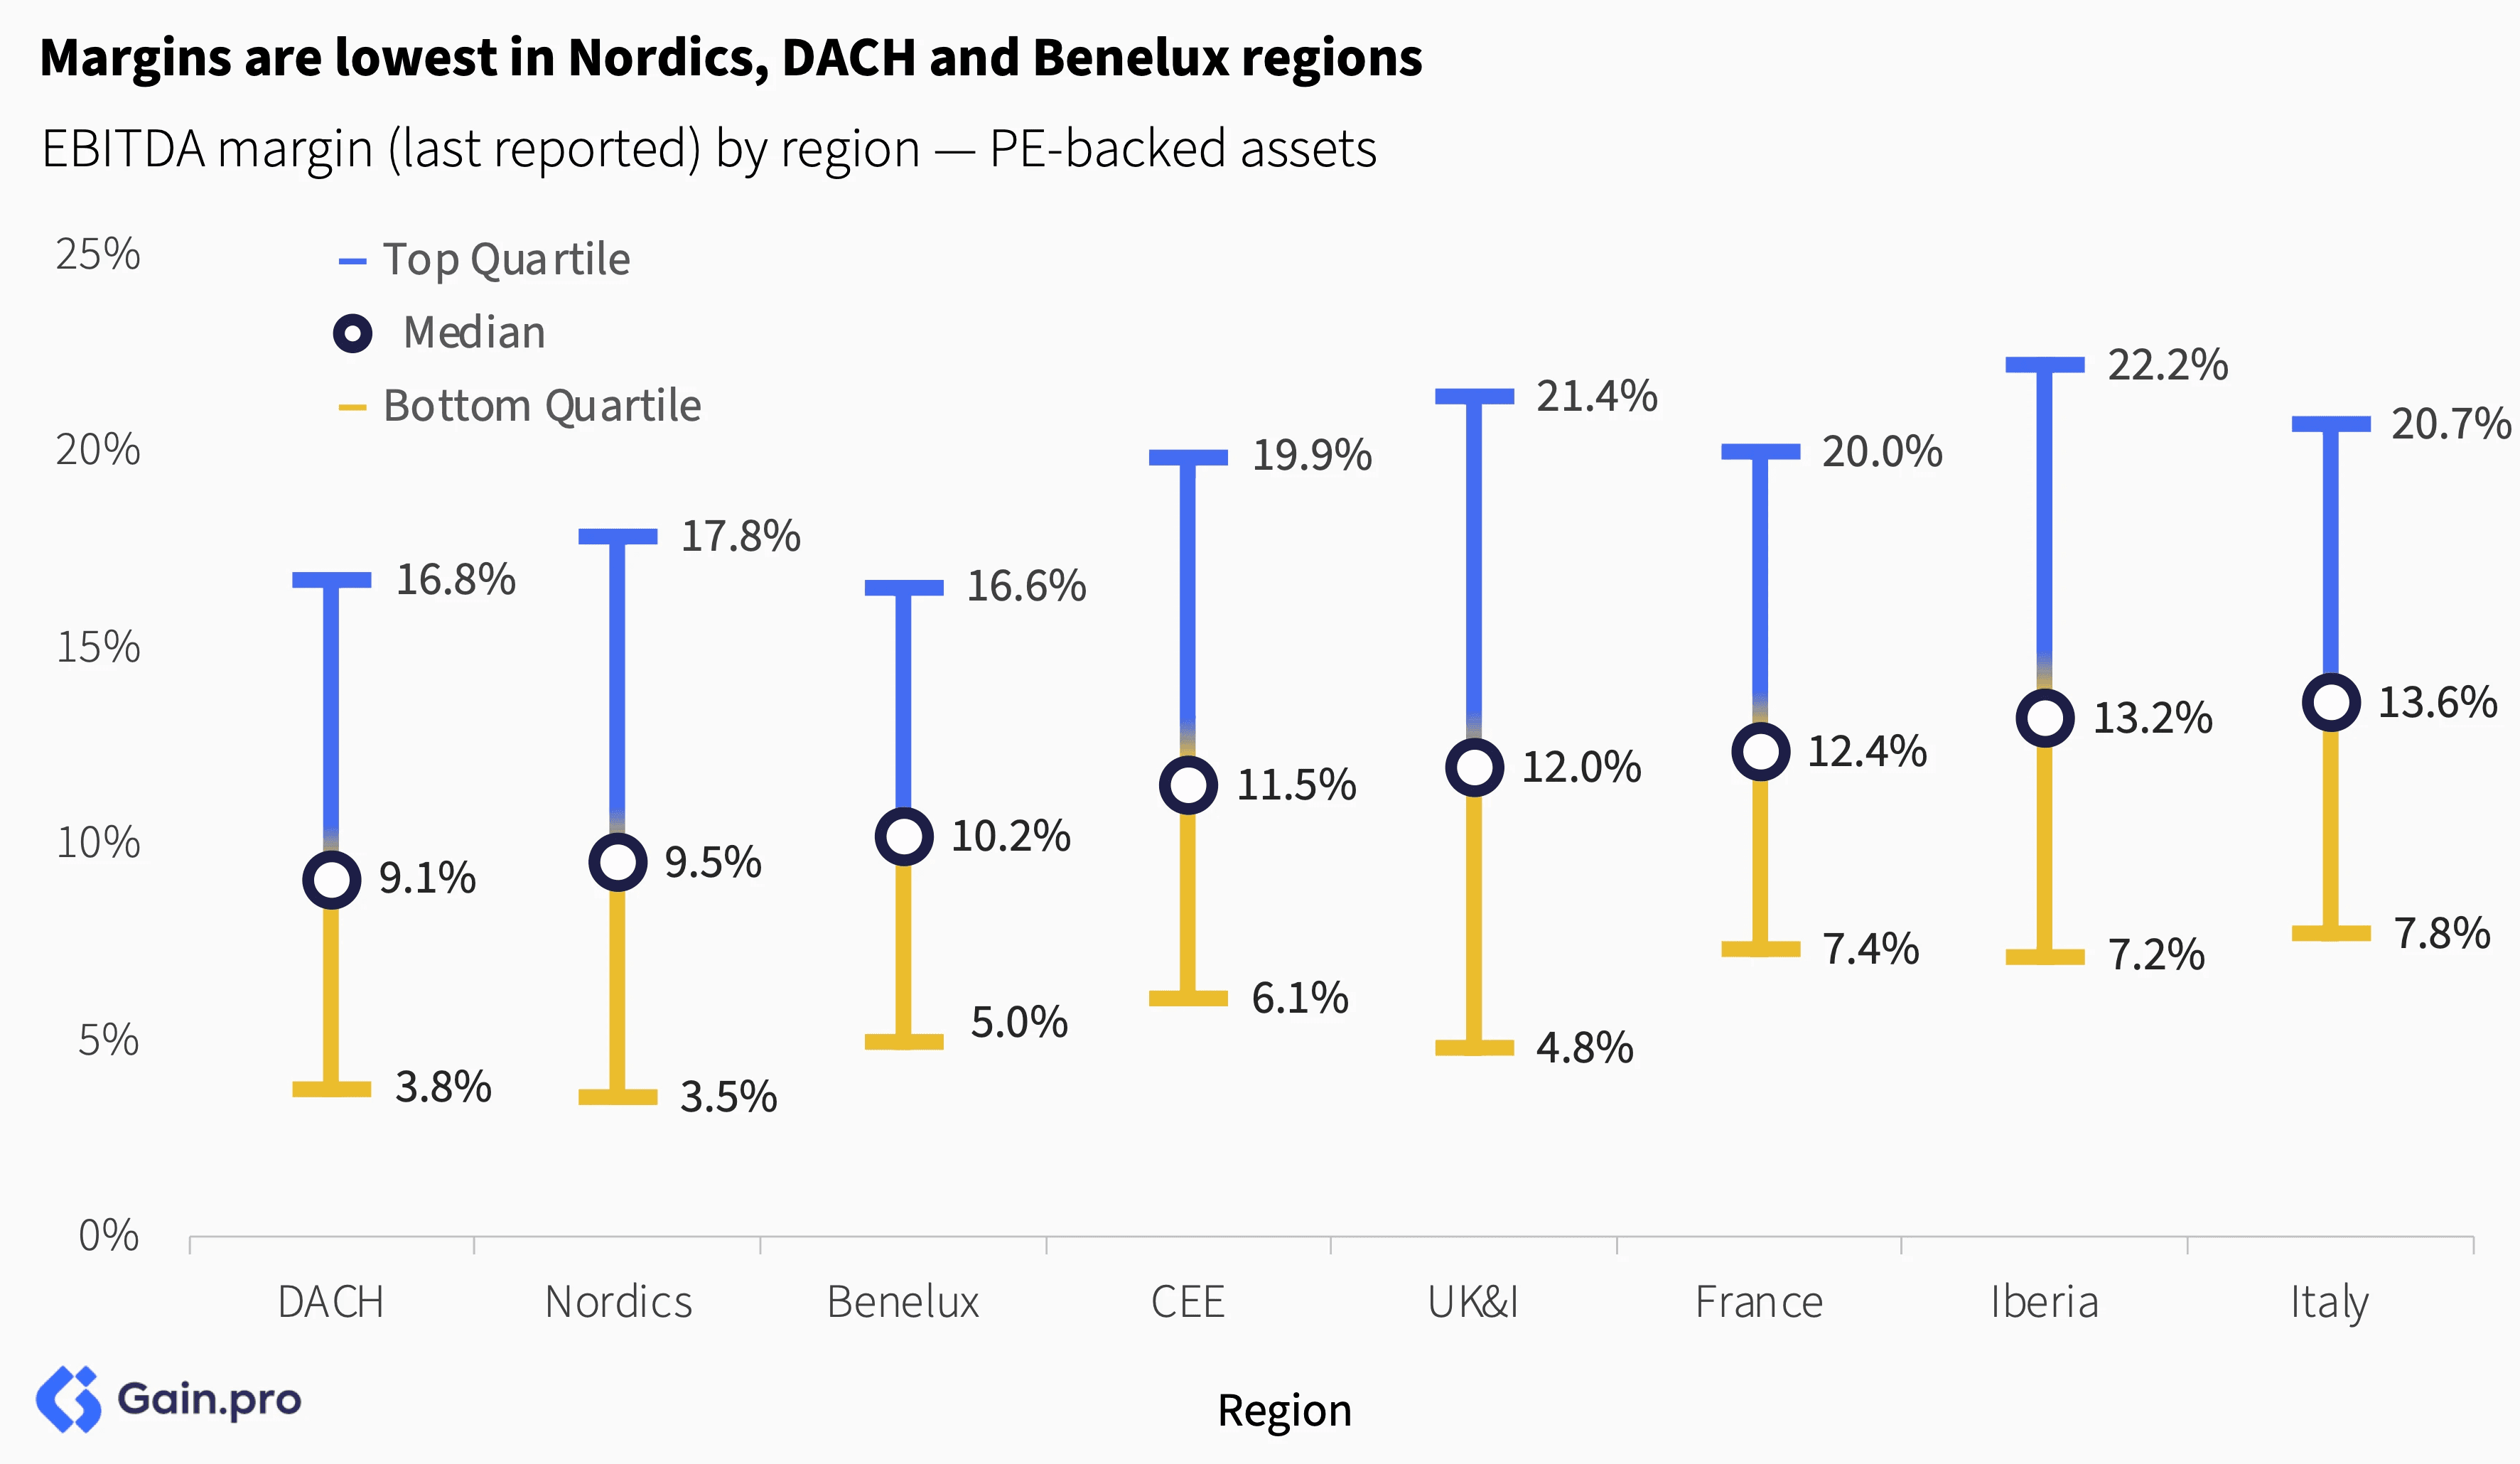
Margins are not very different across geographies except in DACH and Nordics where they are lower. DACH market in particular has a high proportion of lower-margin Industrials assets which drag the margins down.
Methodology
The data for this report comes from Gain.pro.
We define PE-backed entries as those in which a PE firm took a minority or majority stake. We define PE-backed exits as those in which a PE firm sold a minority or majority stake. We exclude any VC rounds from our analysis. Both entries and exits exclude aborted deals. Post 2023 data includes live deal count.
We only focused our analysis on assets HQ’d in Europe.
We estimate the deal count for the last 4 quarters based on prior deal history and the percentage of deals that are announced or added post-quarter close.
Our historical data might change as we add and update new deals to the platform.
For metric calculations, we only included assets that had a hand-curated profile on Gain.pro (10+ hours of primary research). Where possible, we have used 2024 metrics. But in cases where numbers are still being reported, we have relied on 2022-23 metrics.
All EBITDA-related aggregates such as EBITDA margin and EV/EBITDA multiples exclude Financial Services from calculations.