Introduction
Welcome to the inaugural edition of “The State of European Private Equity” report. In this report, we go deep into the PE landscape in Europe. We share insights on entries, exits, multiples, add-ons, holding periods, growth rates, margins and much more.
Table of contents
Executive Summary
Here is a summary of our key findings:
Entries — Buyout deal activity in 2023 was the lowest it’s been in 6 years (down 32% from peak). Energy & Materials (-18%), Services (-27%) and Industrials (-25%) sectors proved to be more resilient. Q1 2024 data shows promise with the deal count exceeding both 2023 and pre-pandemic levels.
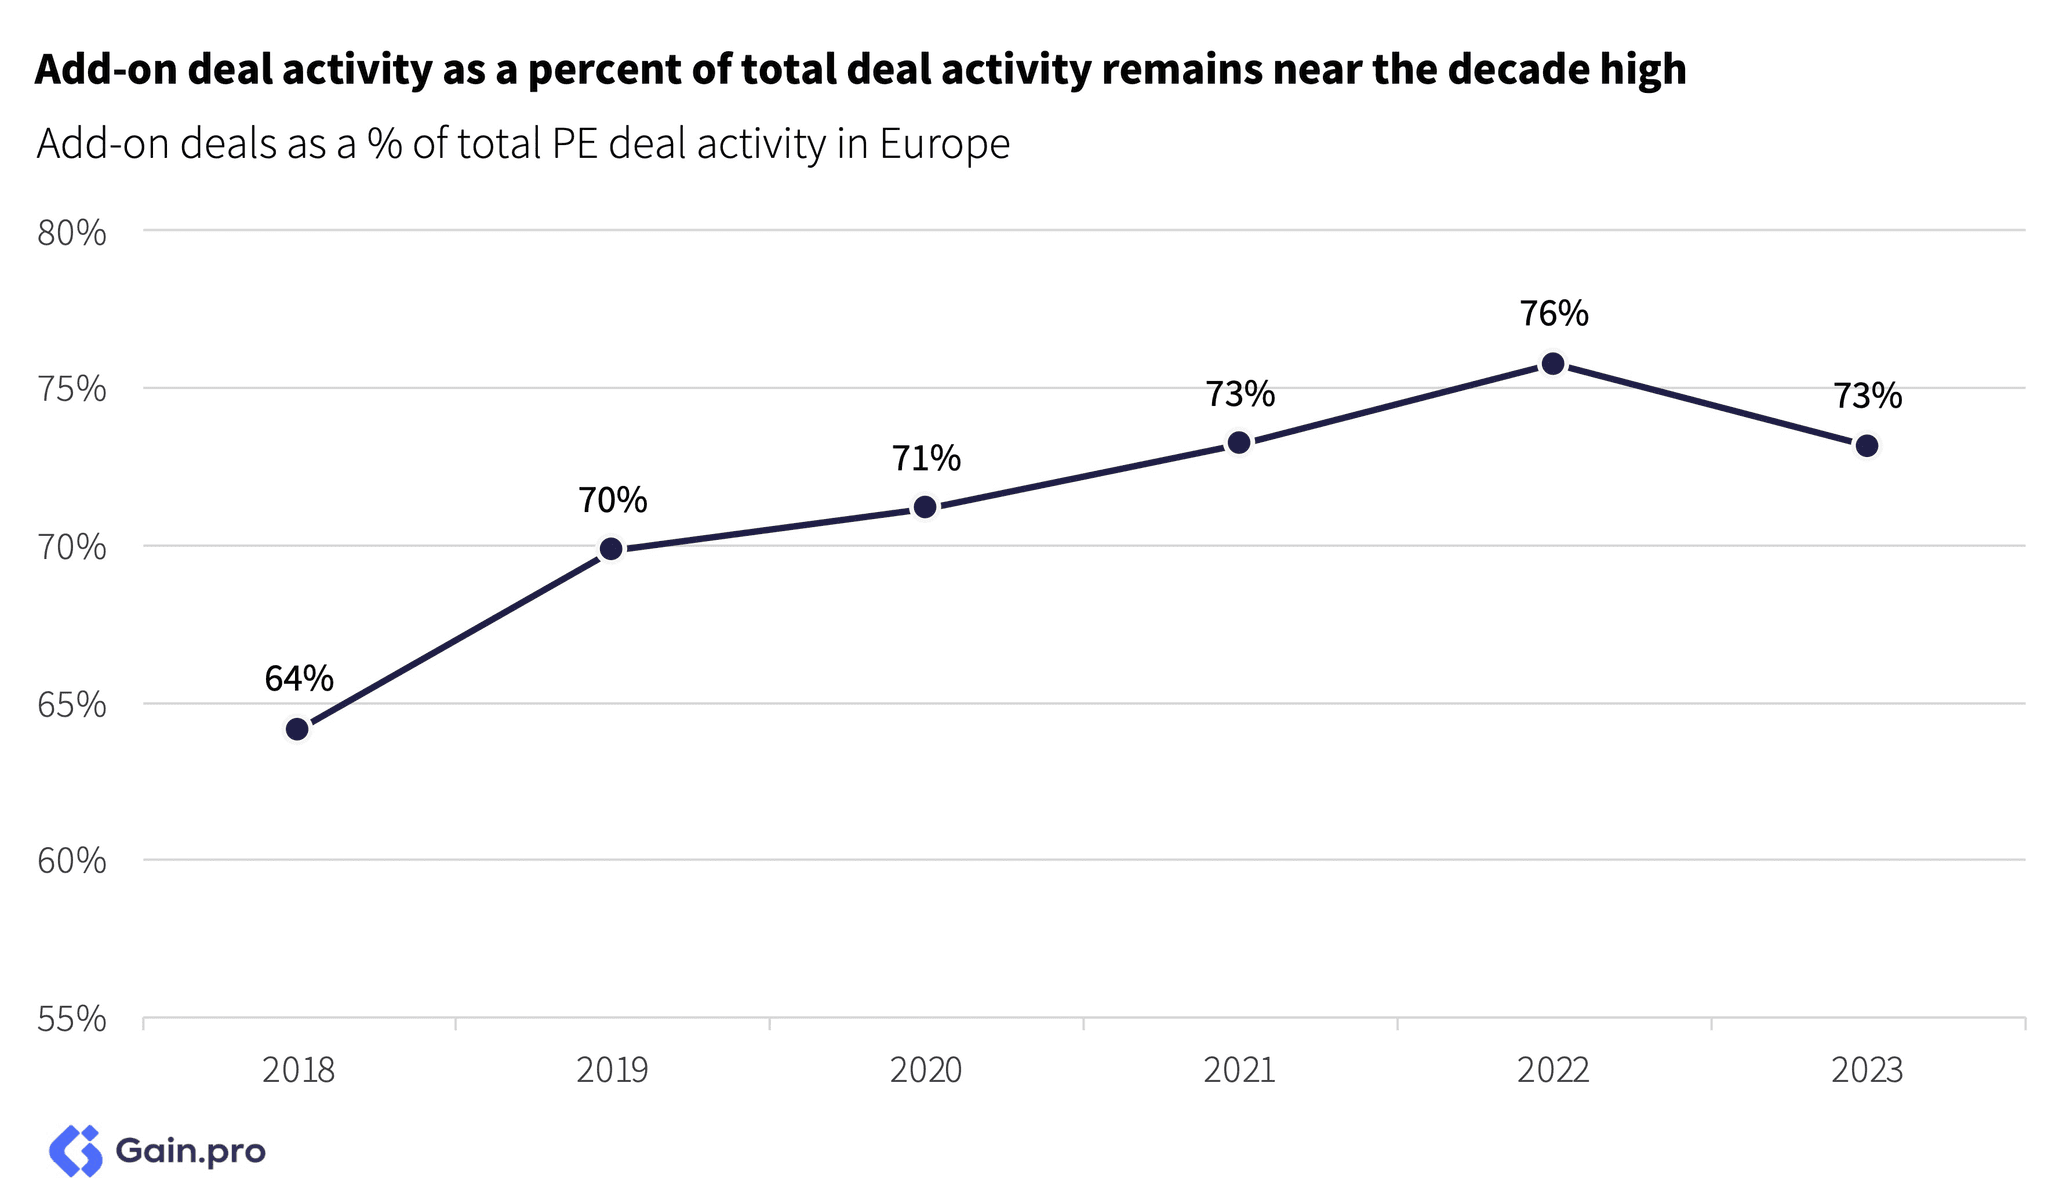
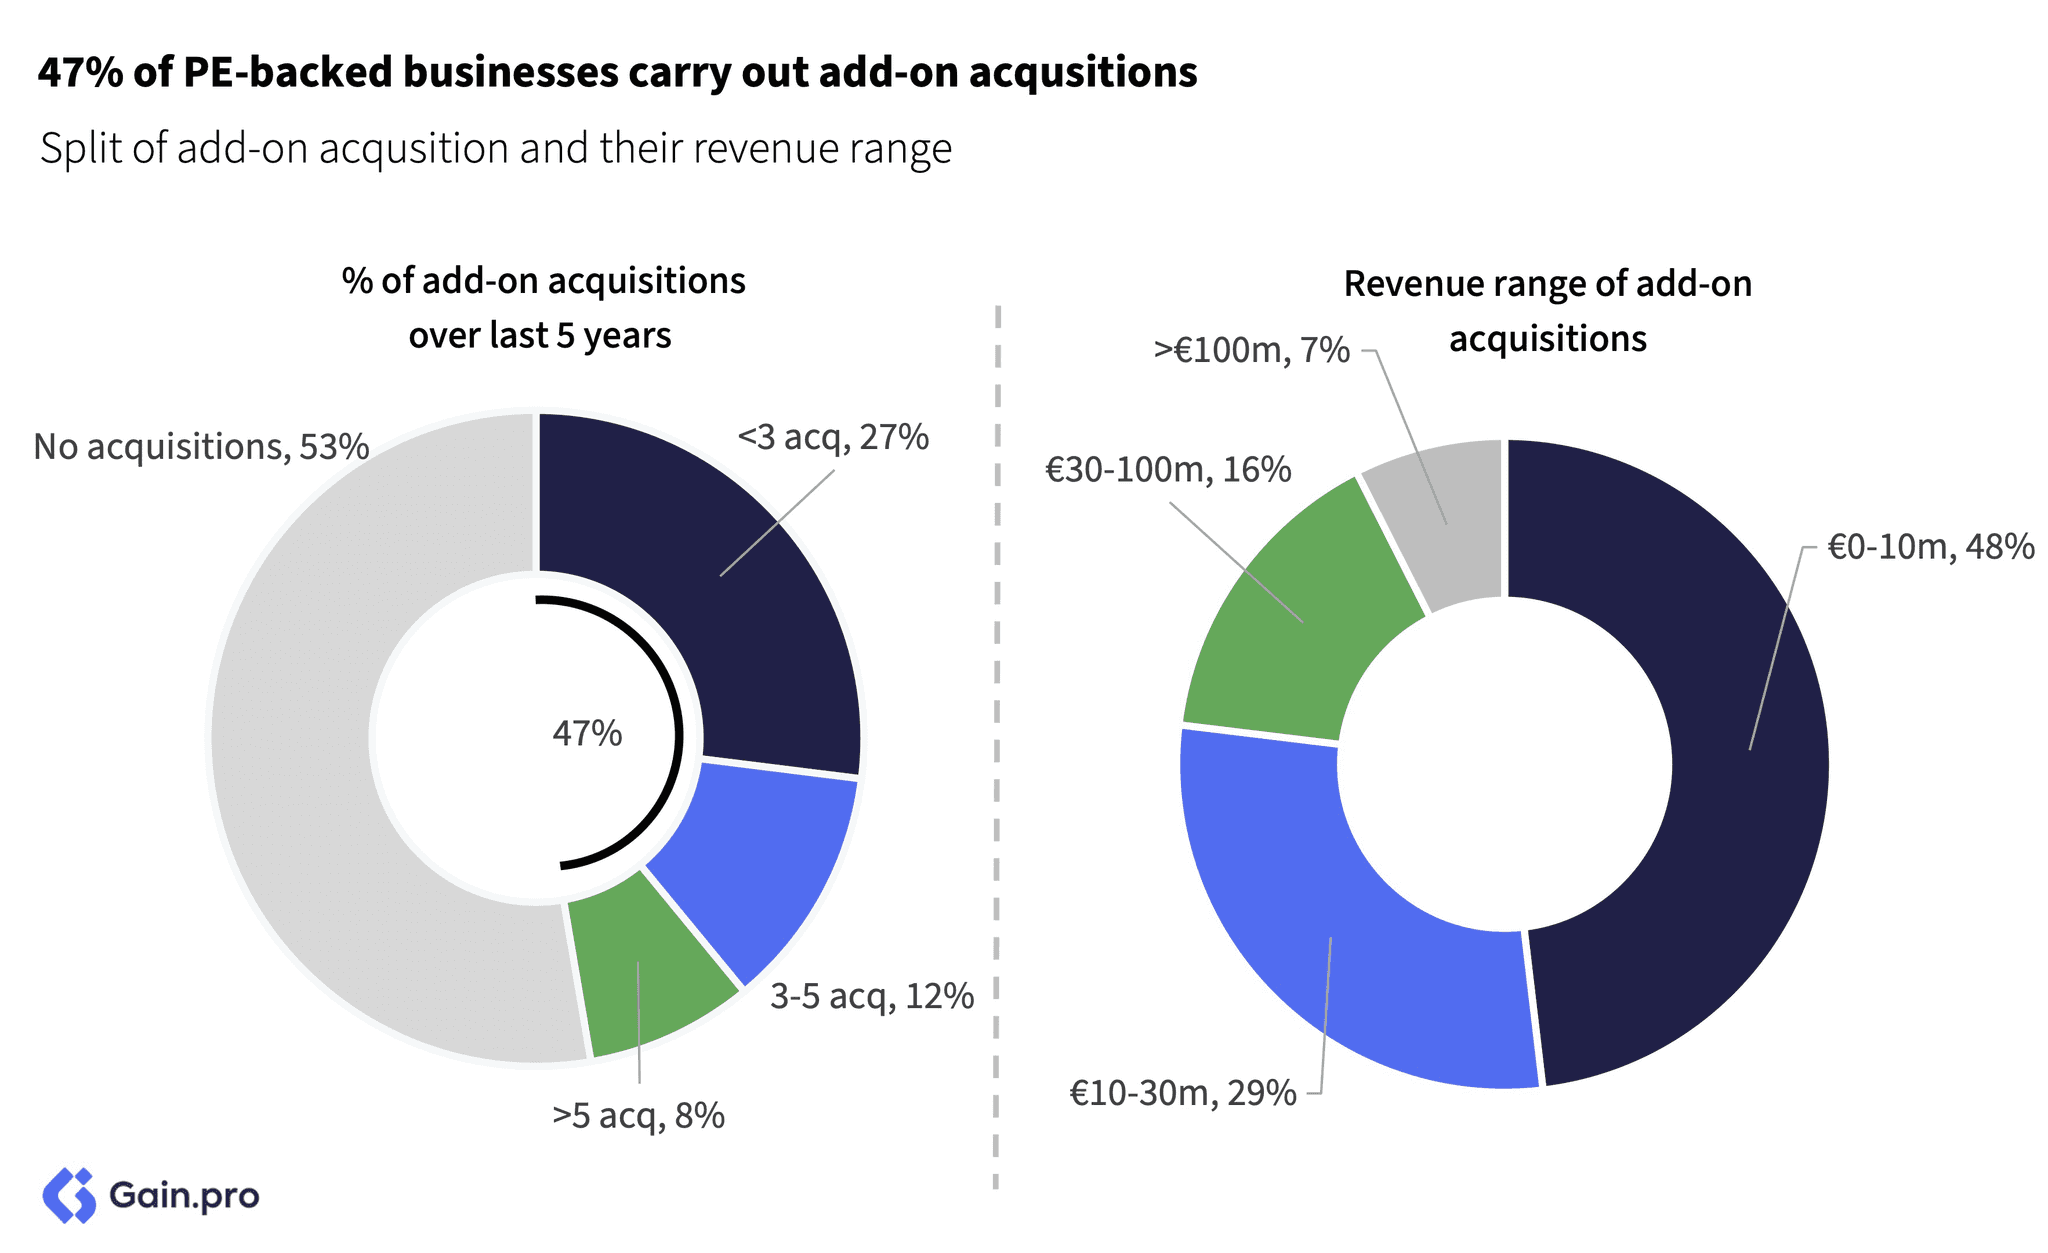
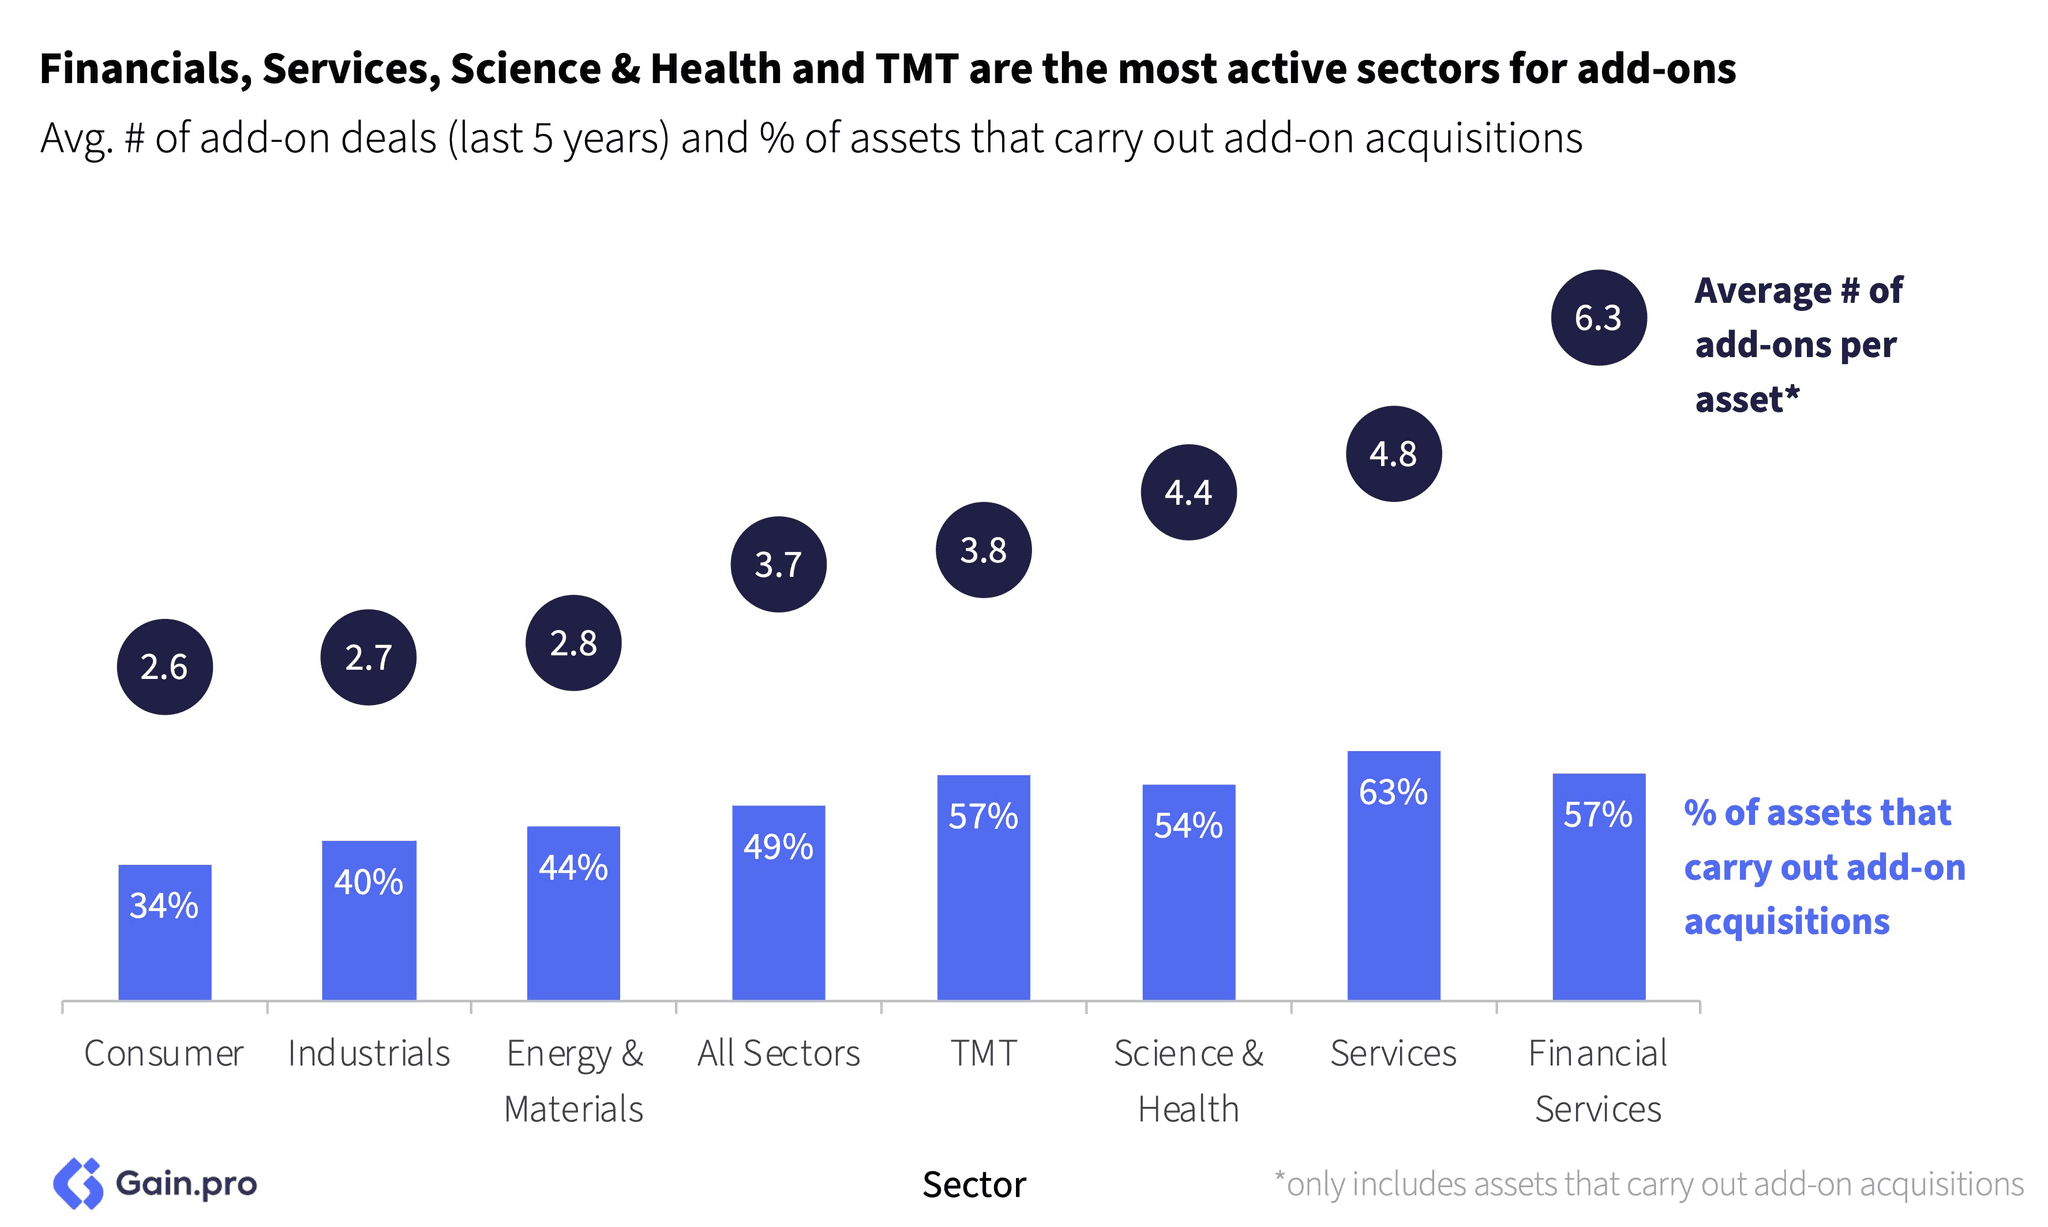
Add-ons — Add-on activity also took a hit in 2023 (down 31% YoY). Despite the decline, the ratio of add-ons to total PE deal activity remains near the decade-high. Close to half (47%) of PE-backed businesses employ a buy-and-build strategy (making at least one acquisition), with assets in Services and Financial Services leading the charge.
Exits — Exits slowed down meaningfully in 2023 but recent data suggests that exits have now stabilized. The current environment favors strategic buyers and it is no surprise that the share of strategic exits has risen from 33% in 2018 to 48% in 2023.
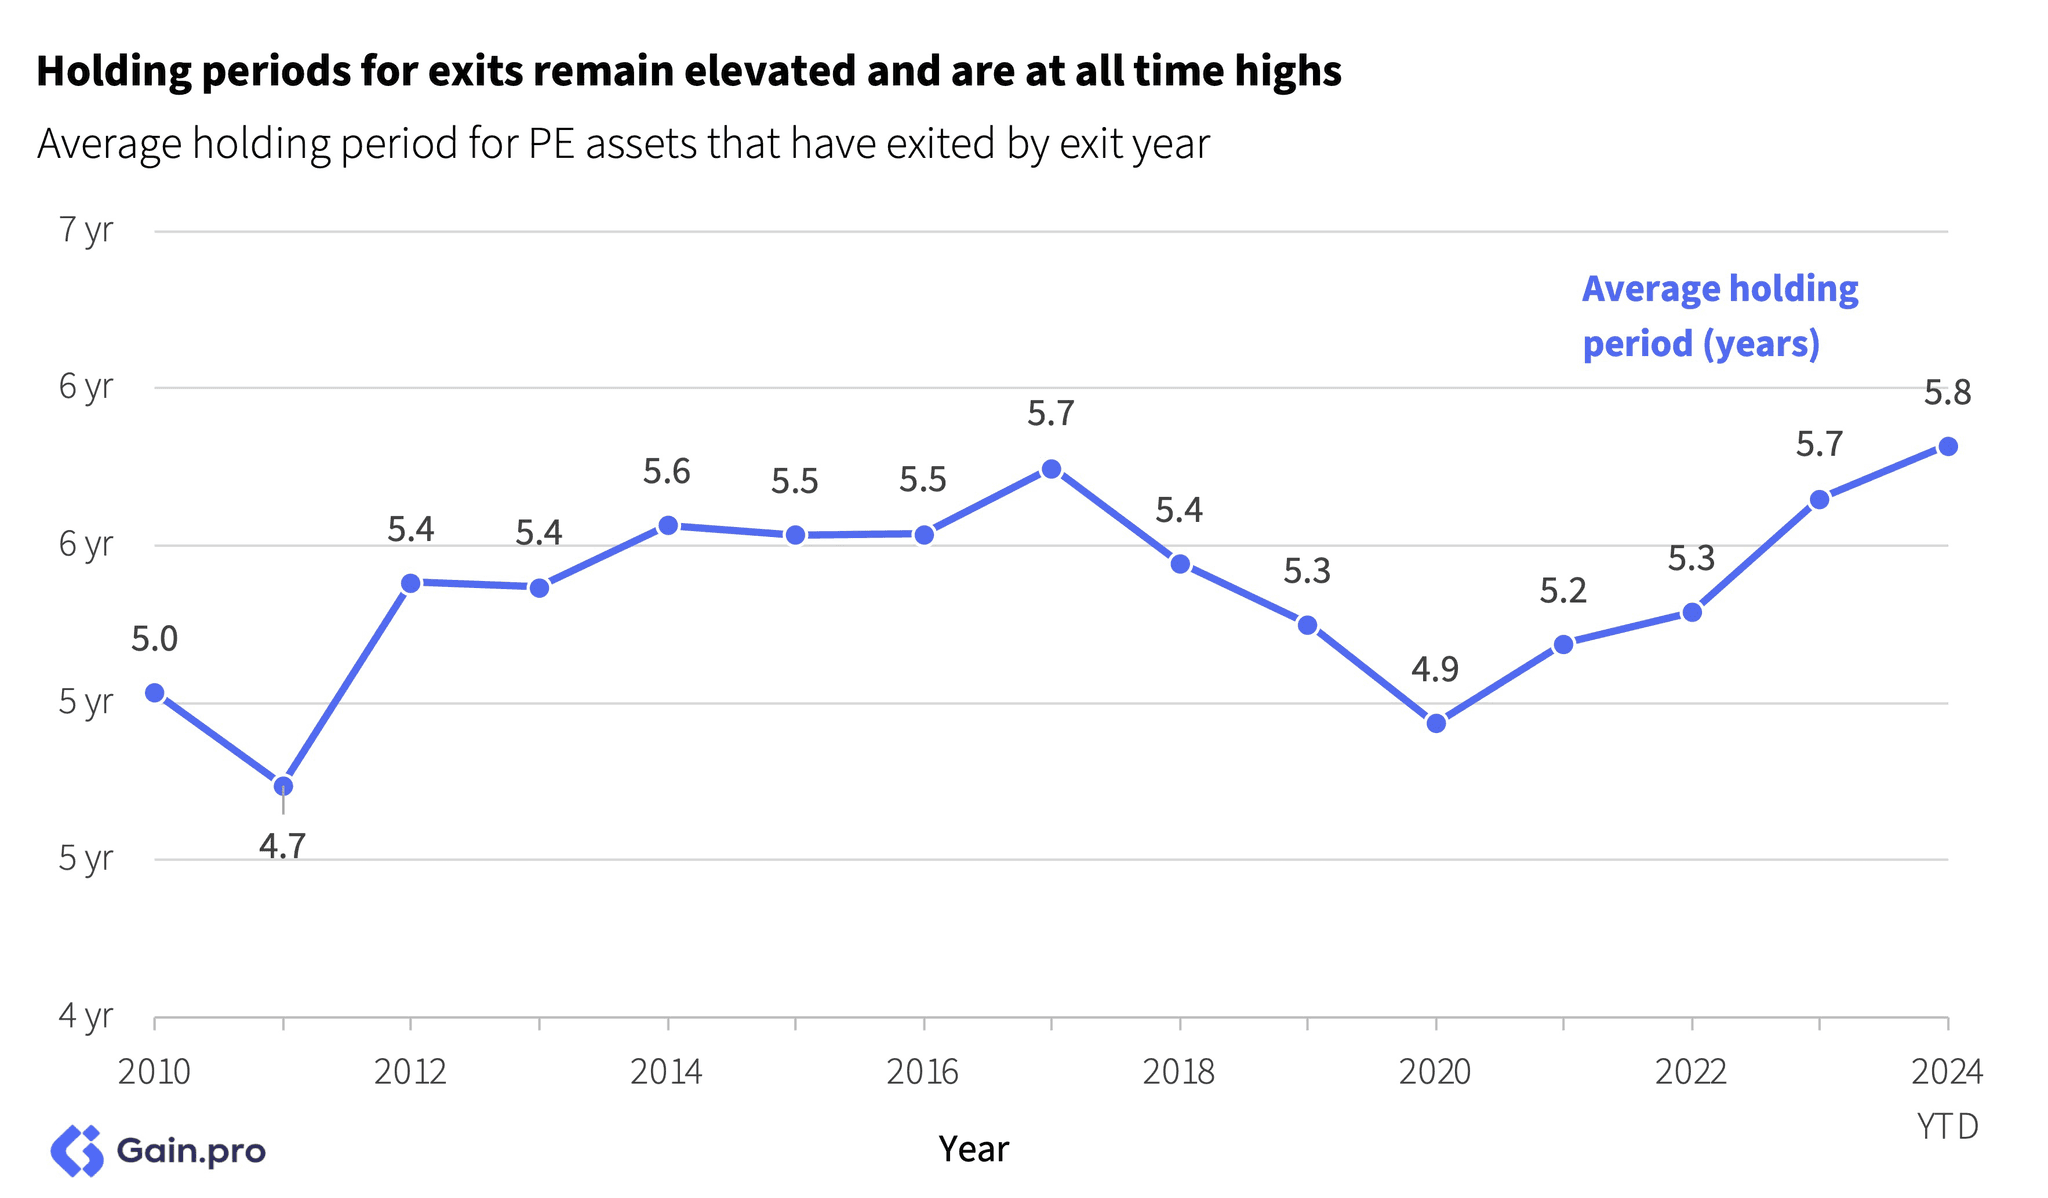
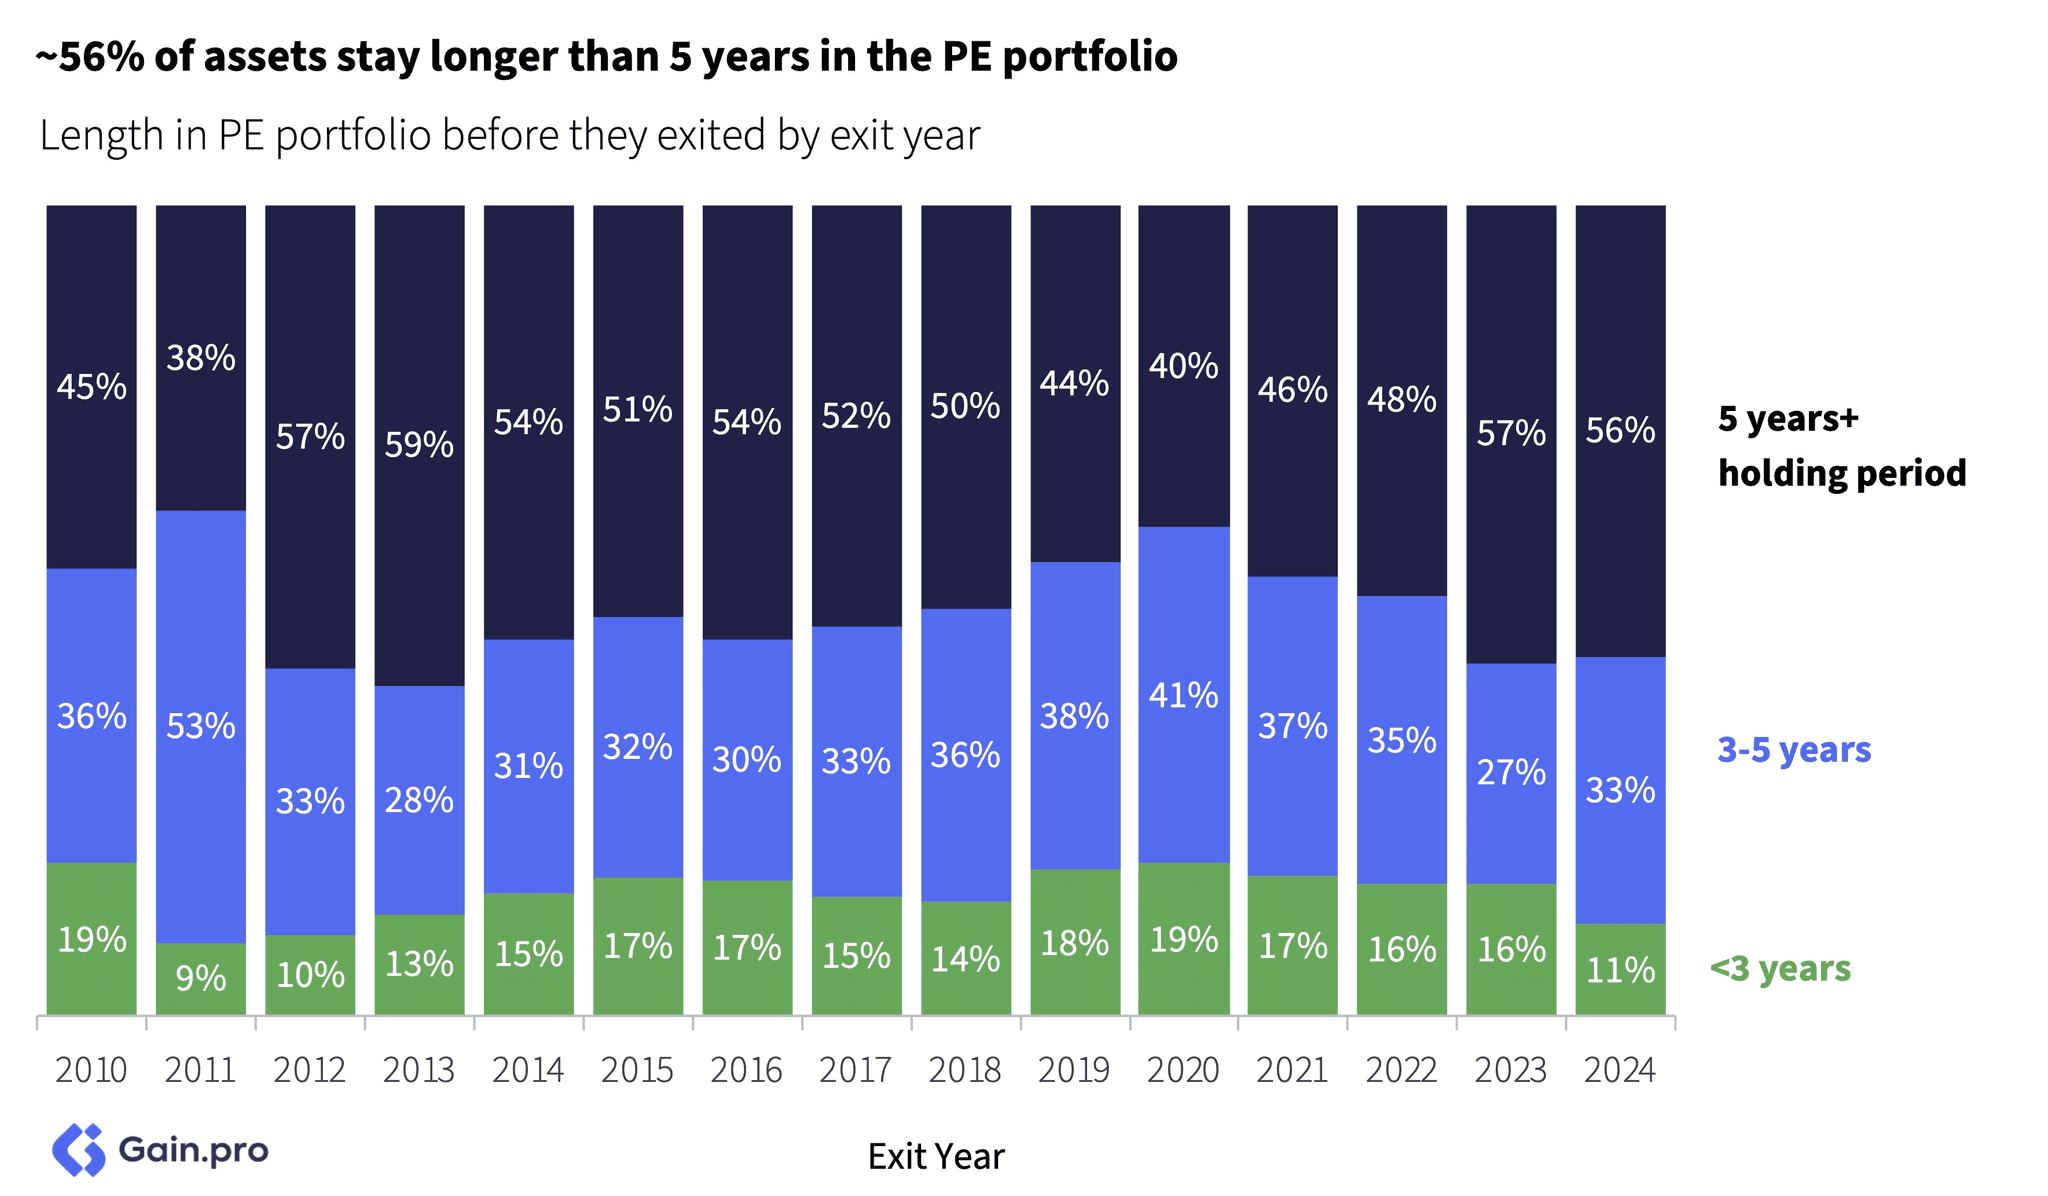
Holding Periods — 56% of assets that exited in 2023/24 stayed longer than 5 years in the portfolio. The average holding period is at an all-time high of 5.8 years vs. 4.9 years in 2020. By sector, Consumer, and by region, UK&I have the longest holding periods.
Multiples — Entry and exit multiples contracted sharply in 2023 (down 25-30% from the peak). TMT and Science & Health commanded a healthy premium vs. other sectors while the discount for add-on deals narrowed vs. platform multiples.
Growth and Margins — Revenue growth for PE-backed assets was the strongest in years. PE-backed assets grew 18.8% YoY in 2023 and EBITDA margins expanded too (up 170 bps in the last 7 years).
These insights barely scratch the surface. We hope you find the time to go through the full report. If you have any questions do not hesitate to reach out to sid.jain@gain.pro.
Chapter 01: Entries
Overall Trend
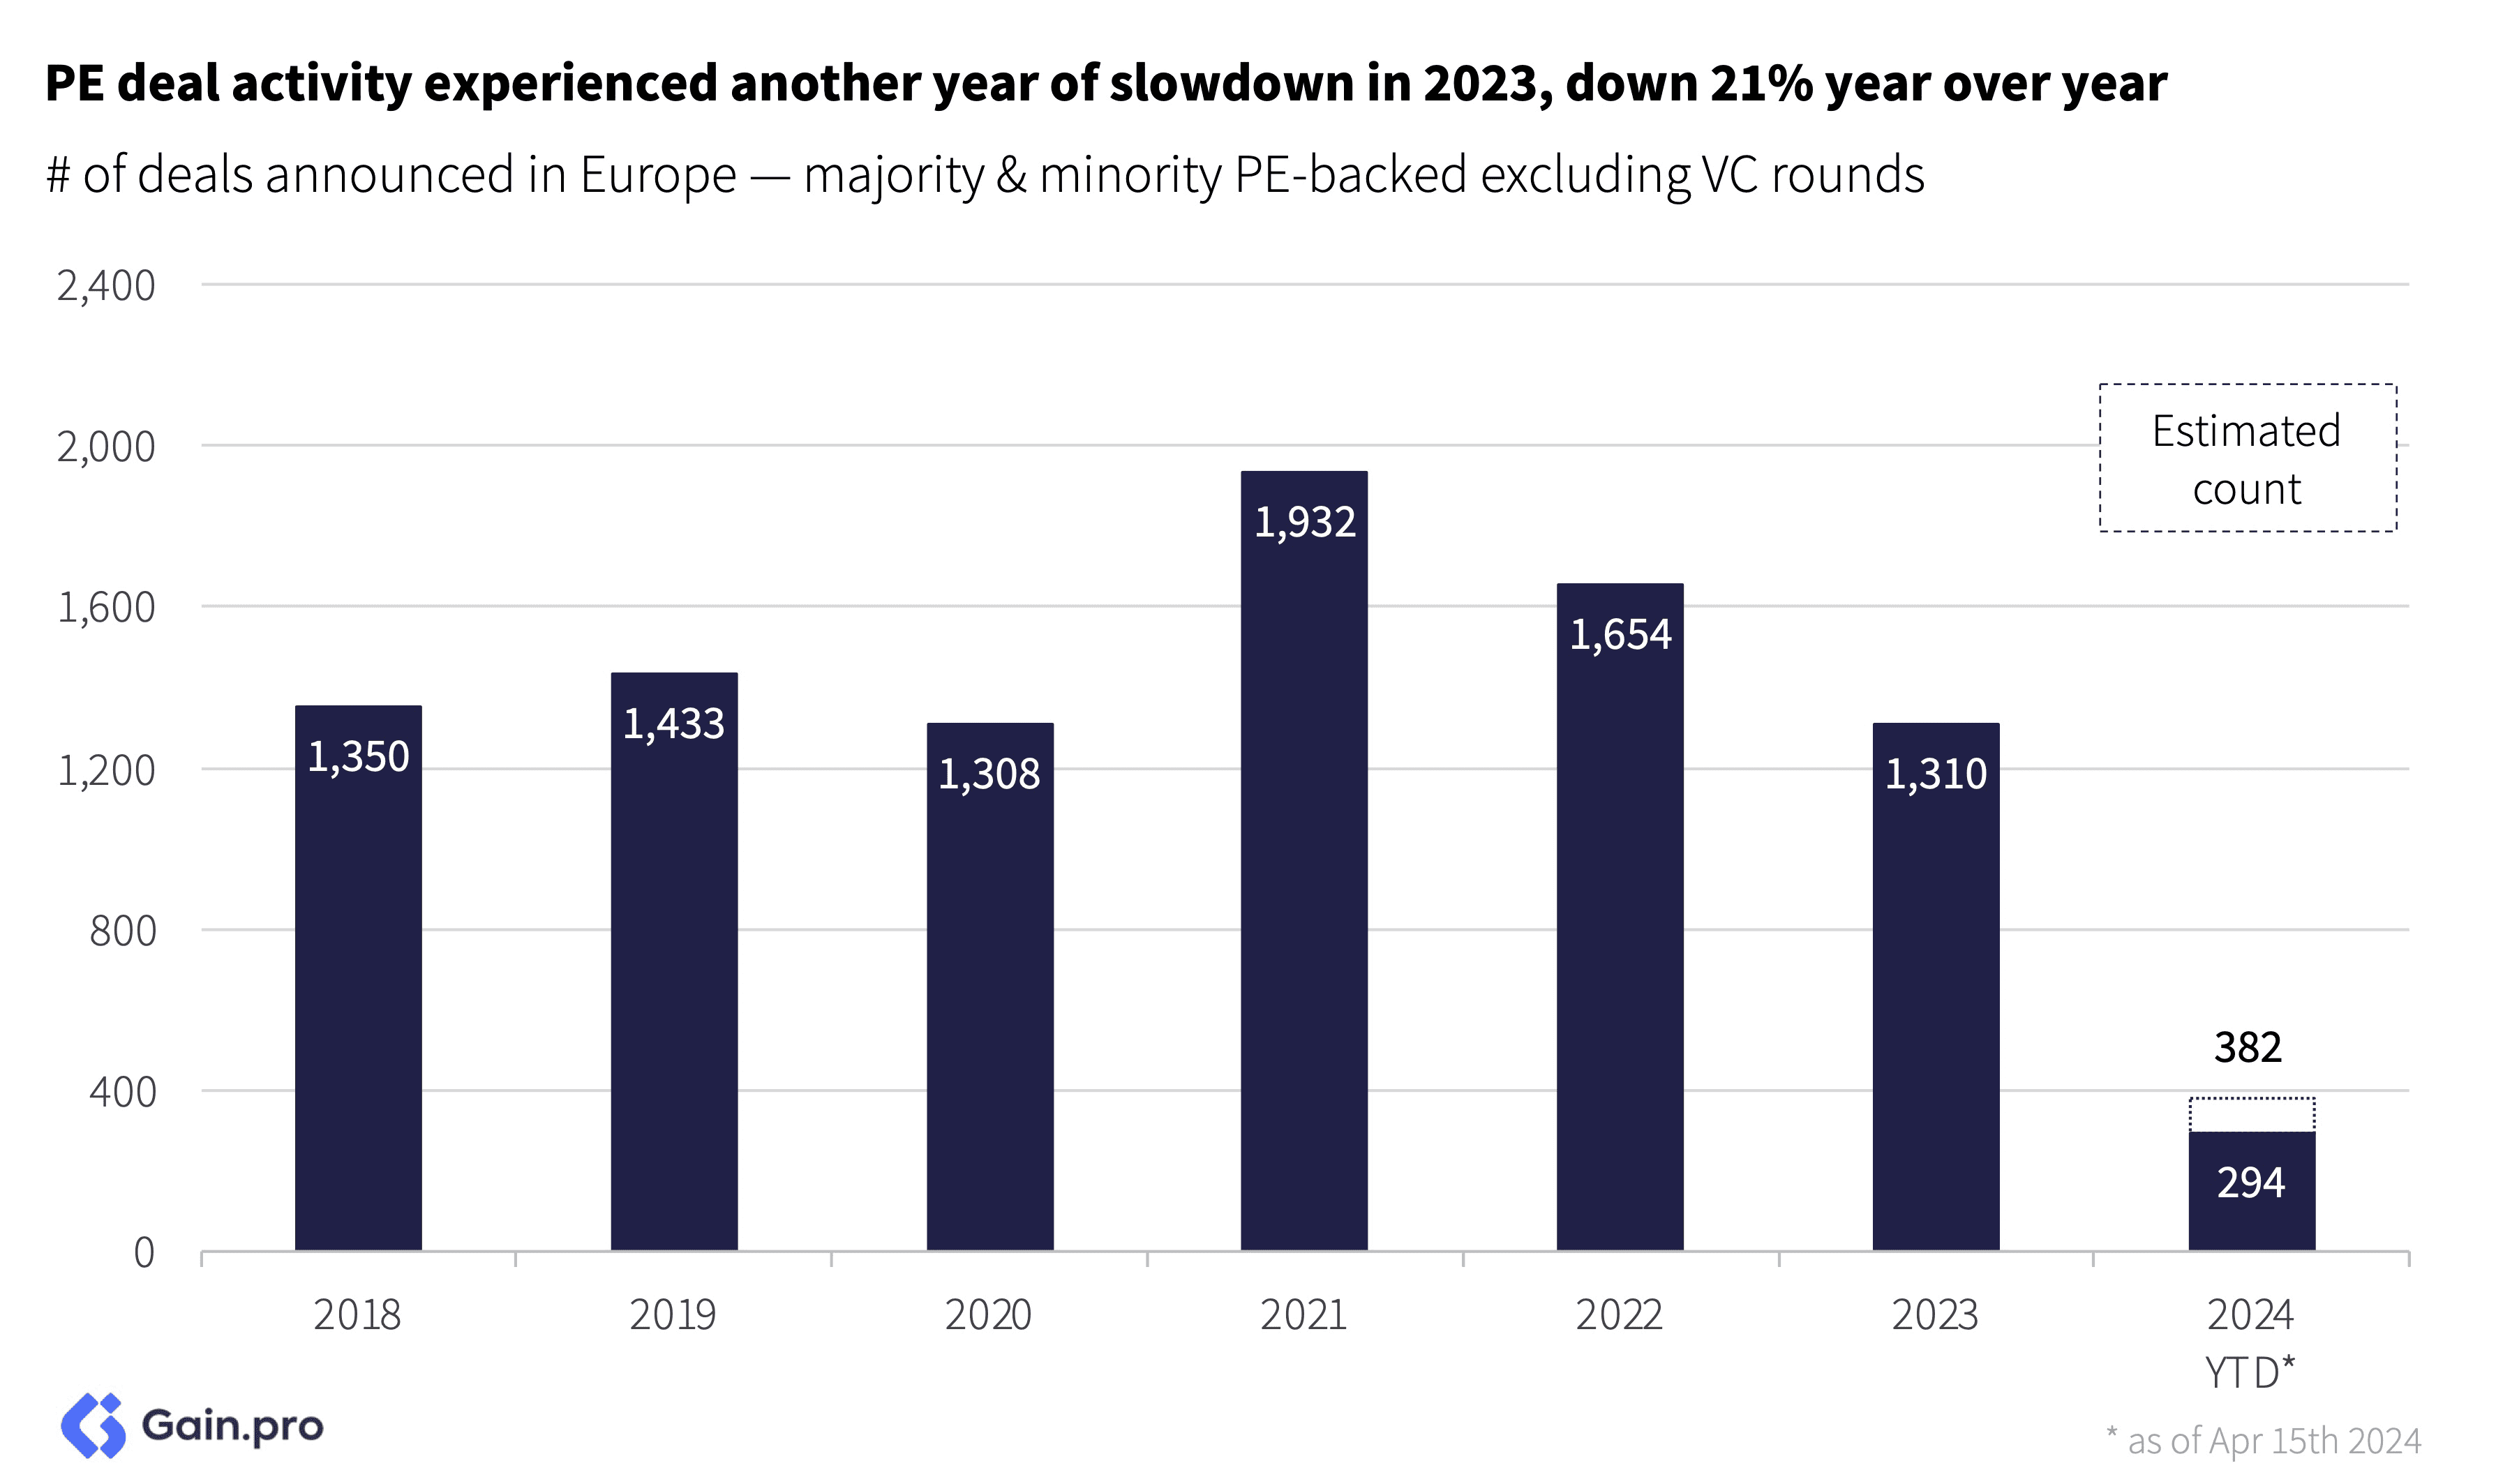
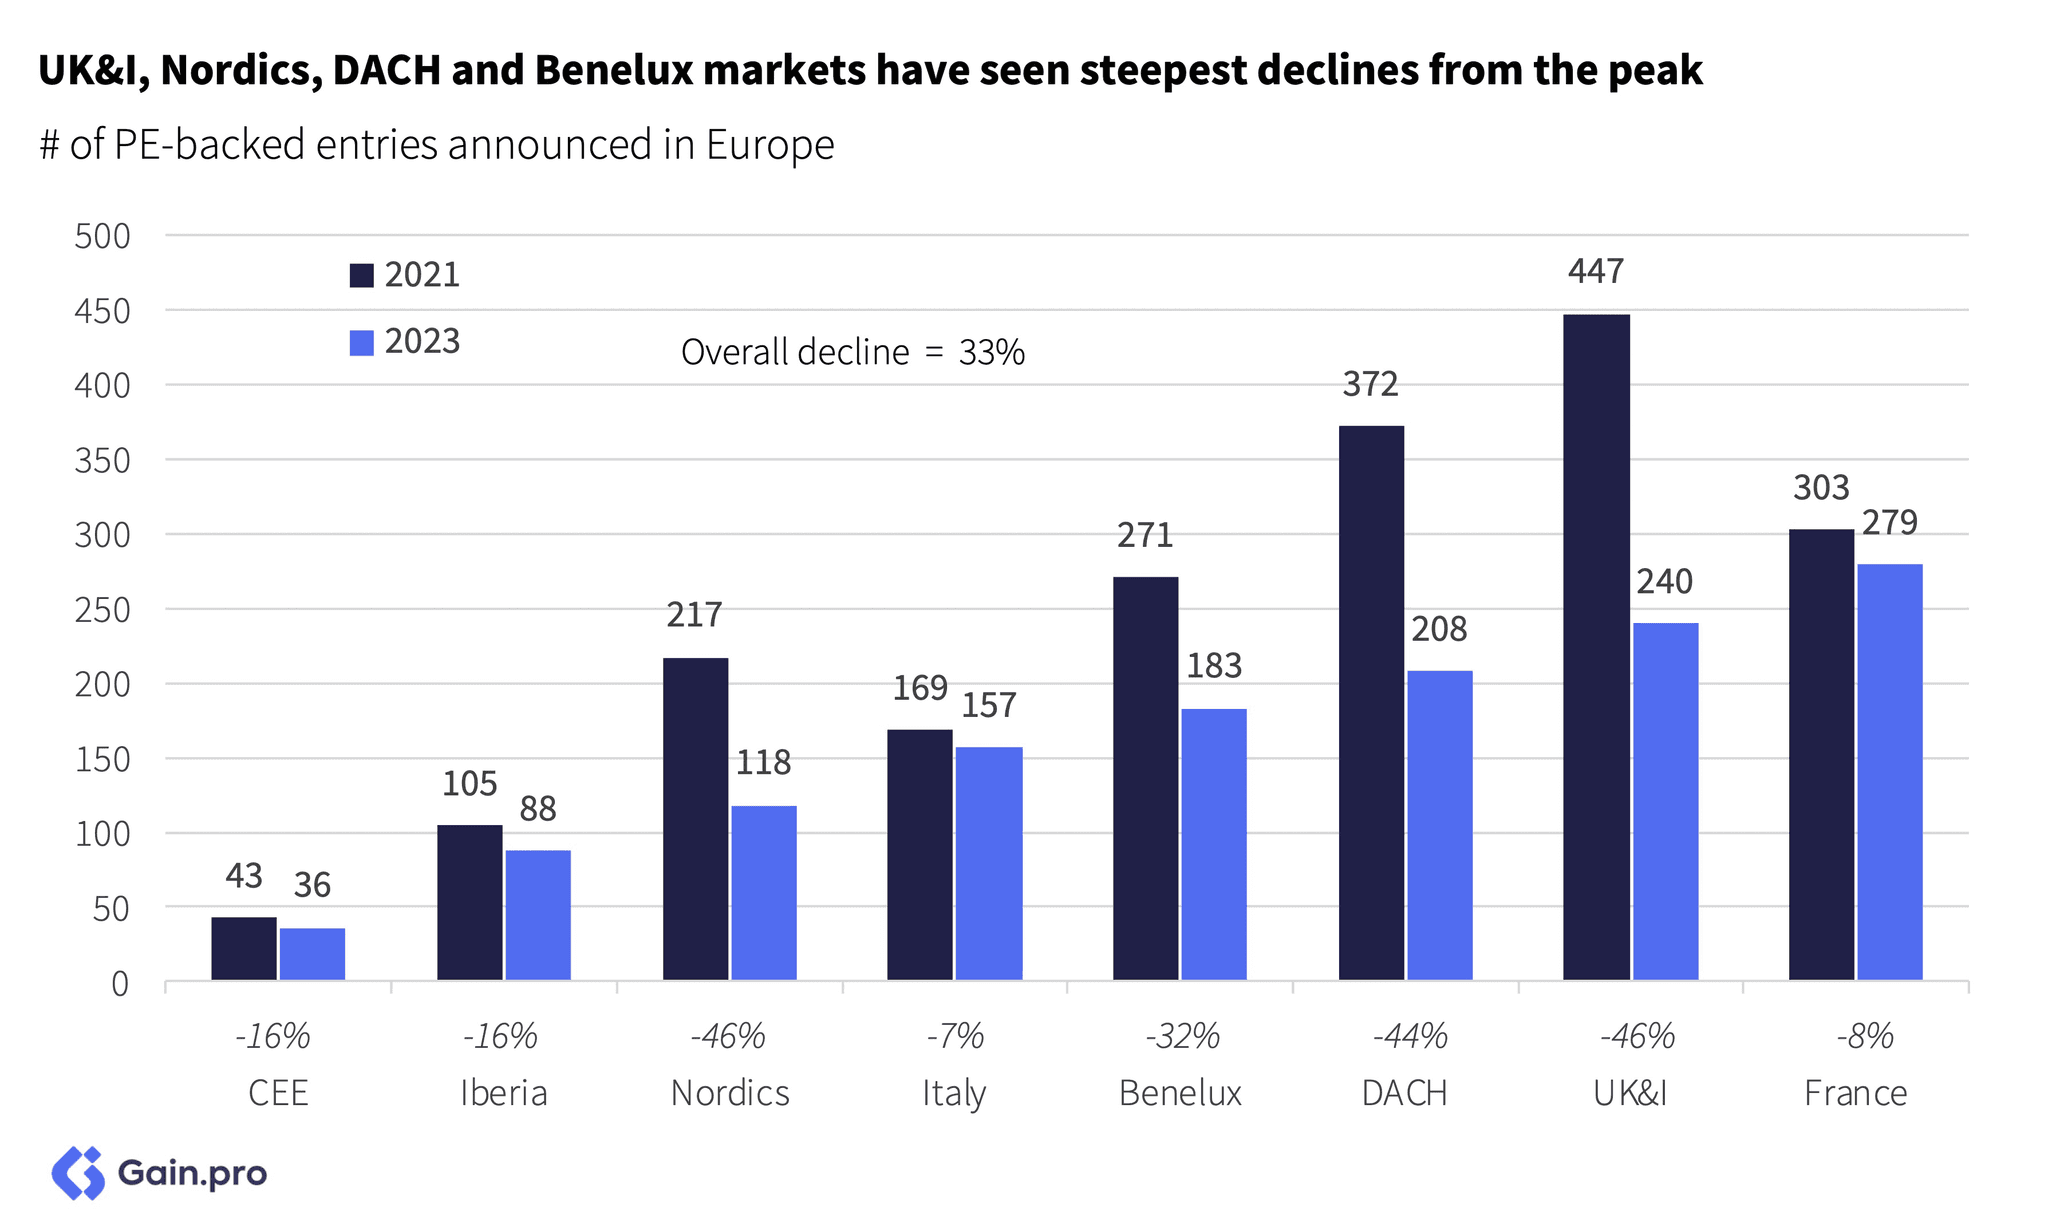
Buyout deal activity in 2023 was the lowest it has been in 6 years. Entries were down 32% from their 2021 peak. The slowdown in entries can primarily be attributed to high interest rates which raised borrowing costs for PE sponsors. However, the most recent data from 2024 is starting to show promise.
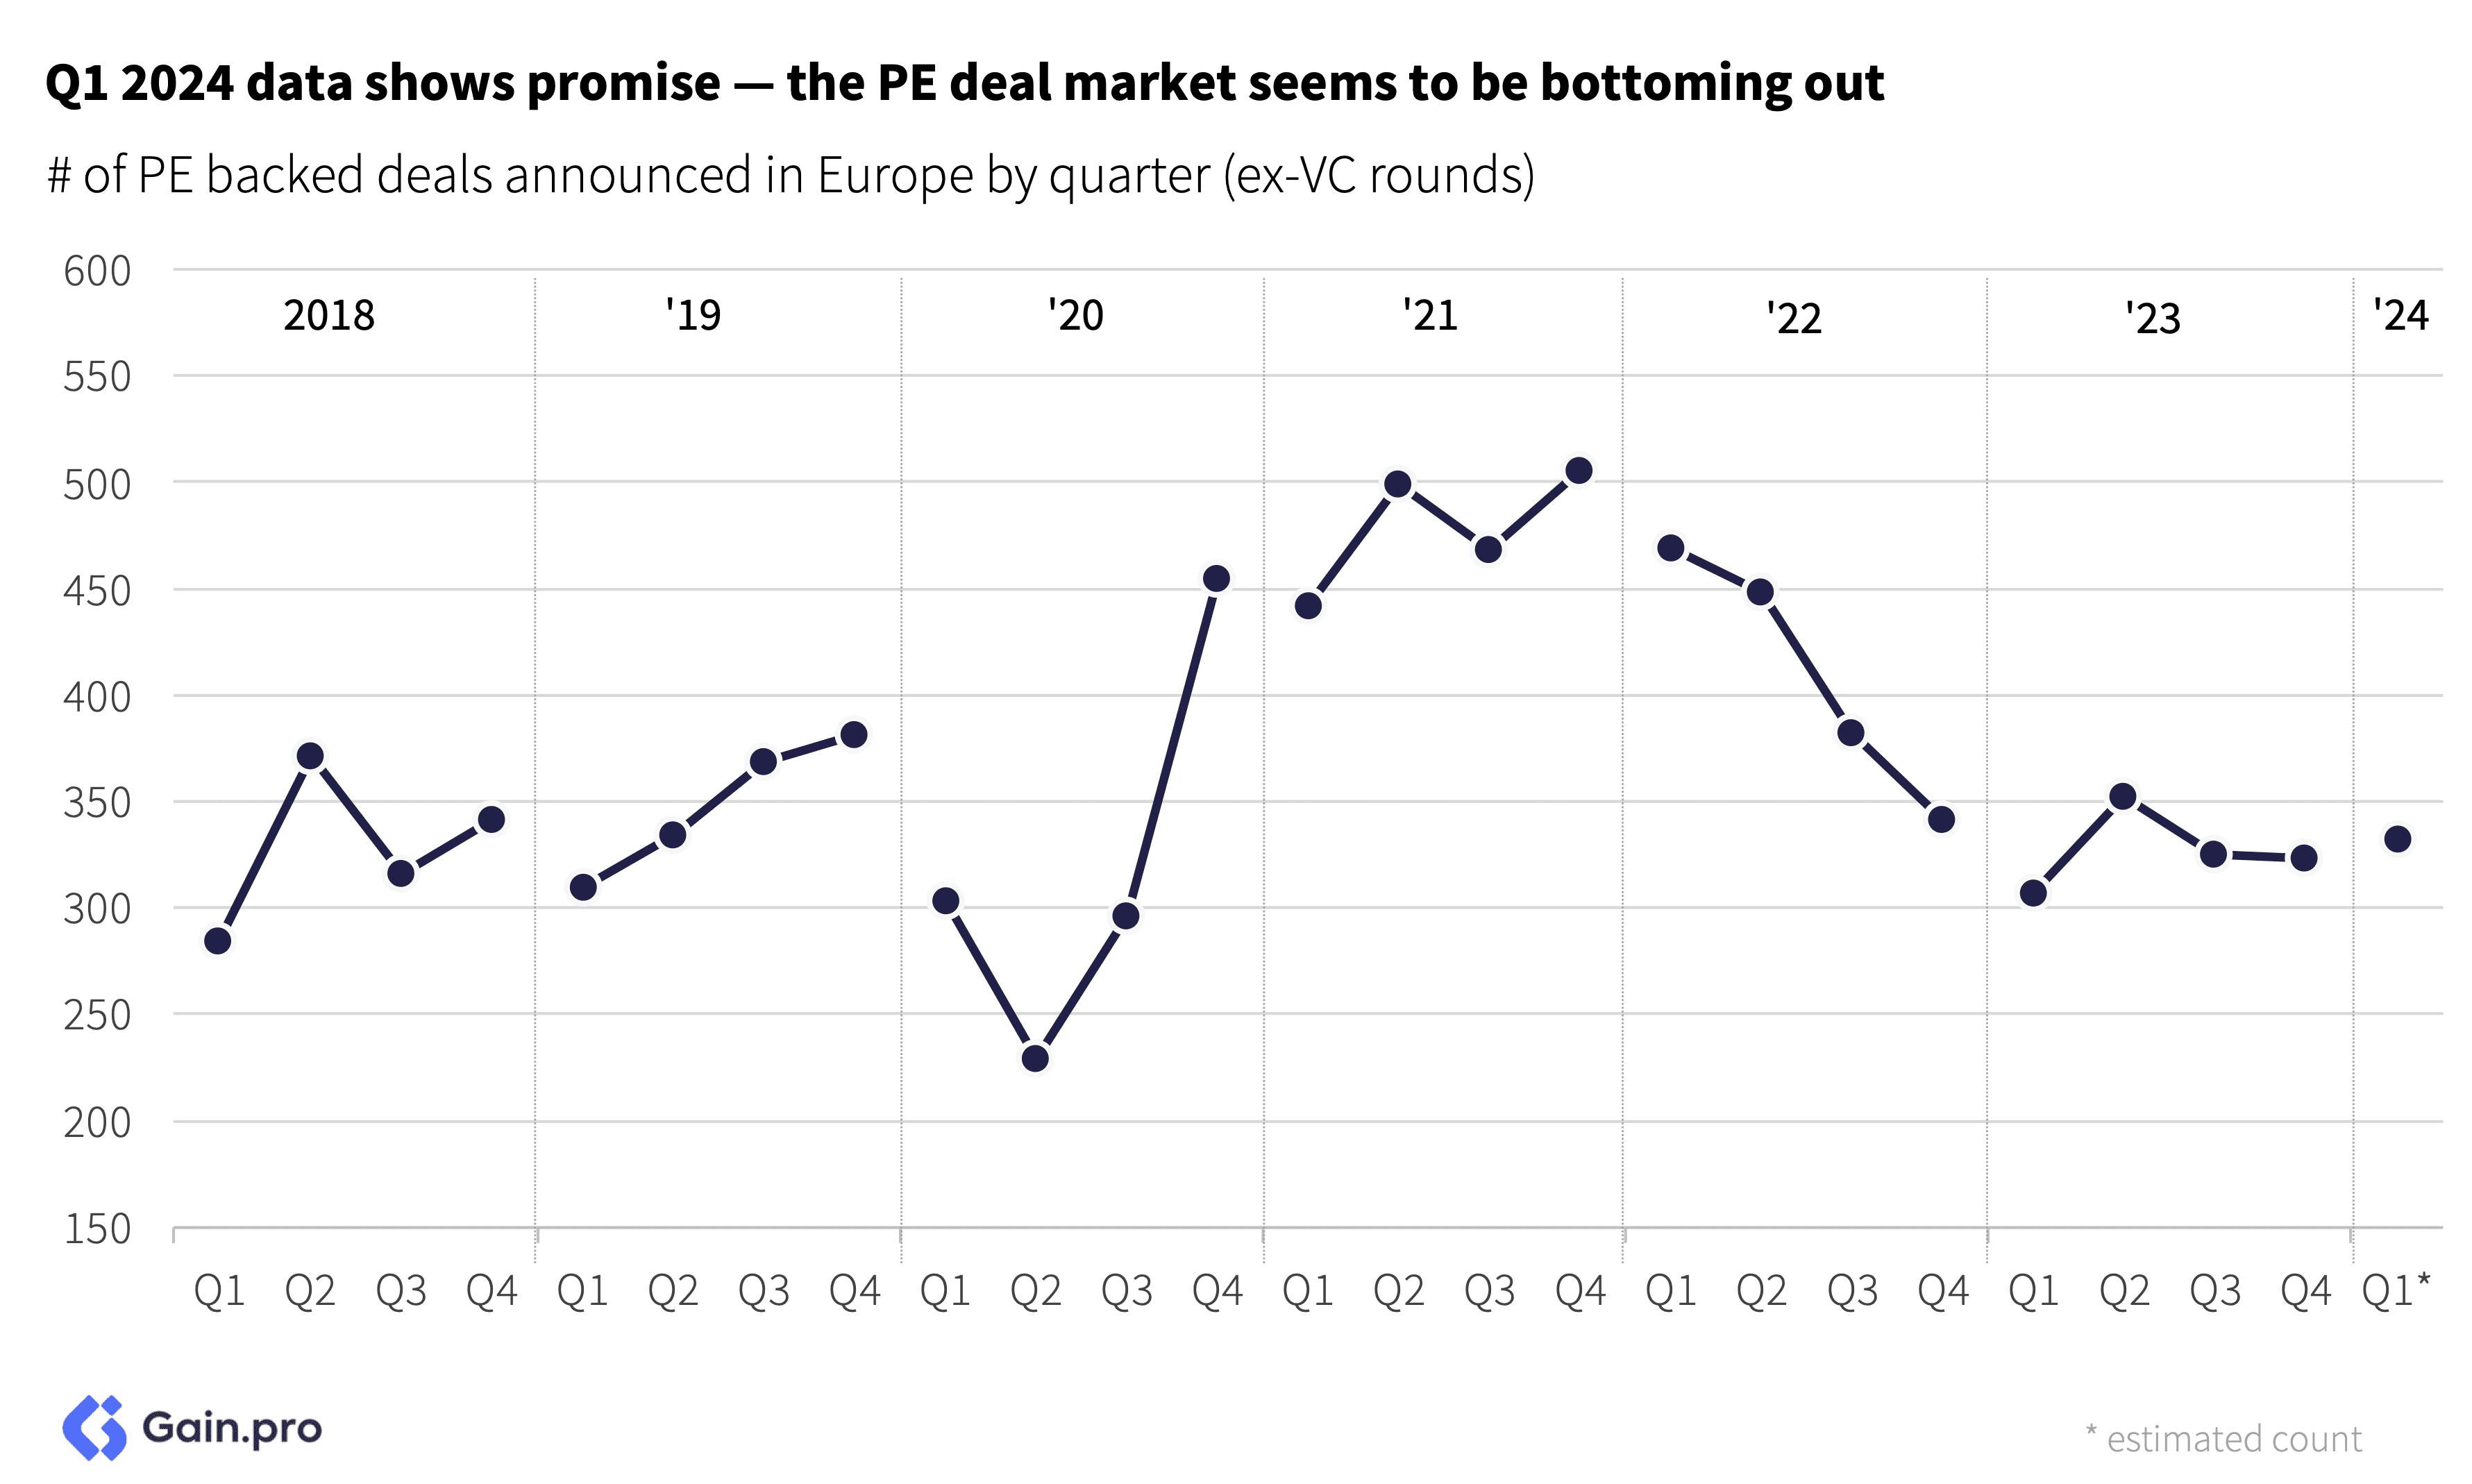
The estimated buyout deal count in Q1 2024 exceeded both 2023 and pre-pandemic levels. The market seems to be bottoming out. The 2023 deal count was stable across quarters (unlike the fall in 2022) and entries in 2024 seem to have continued at a similar pace.
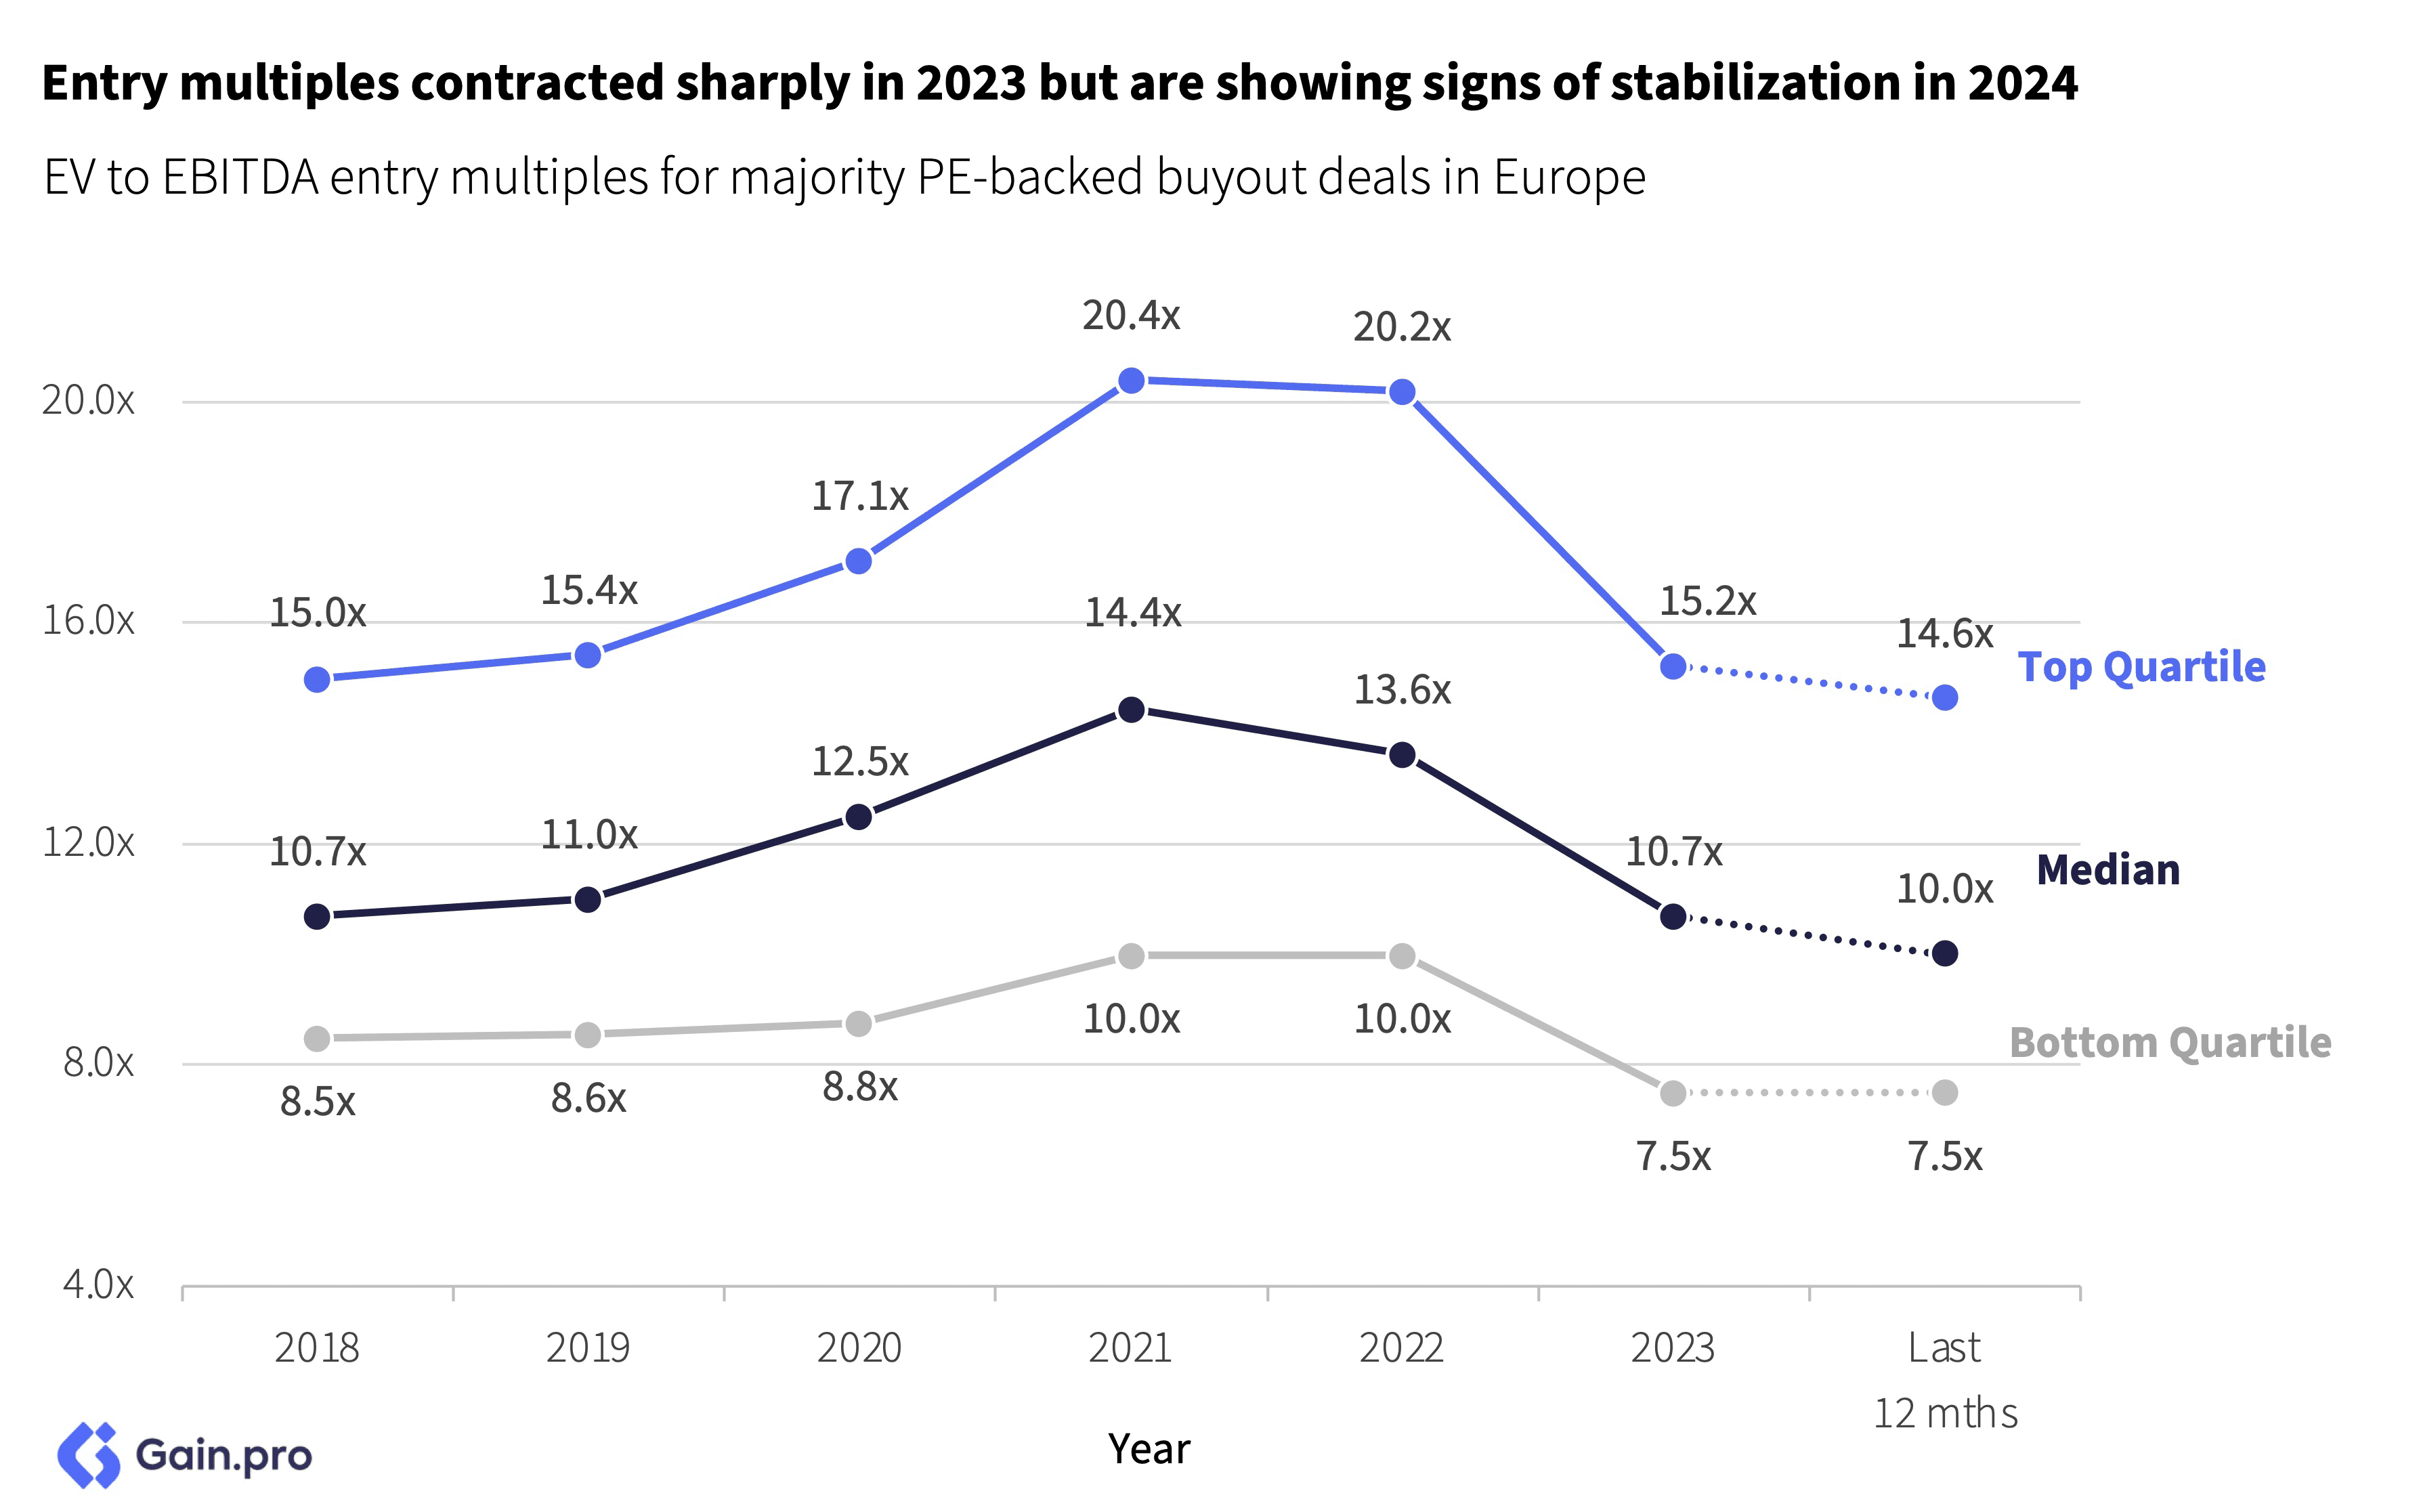
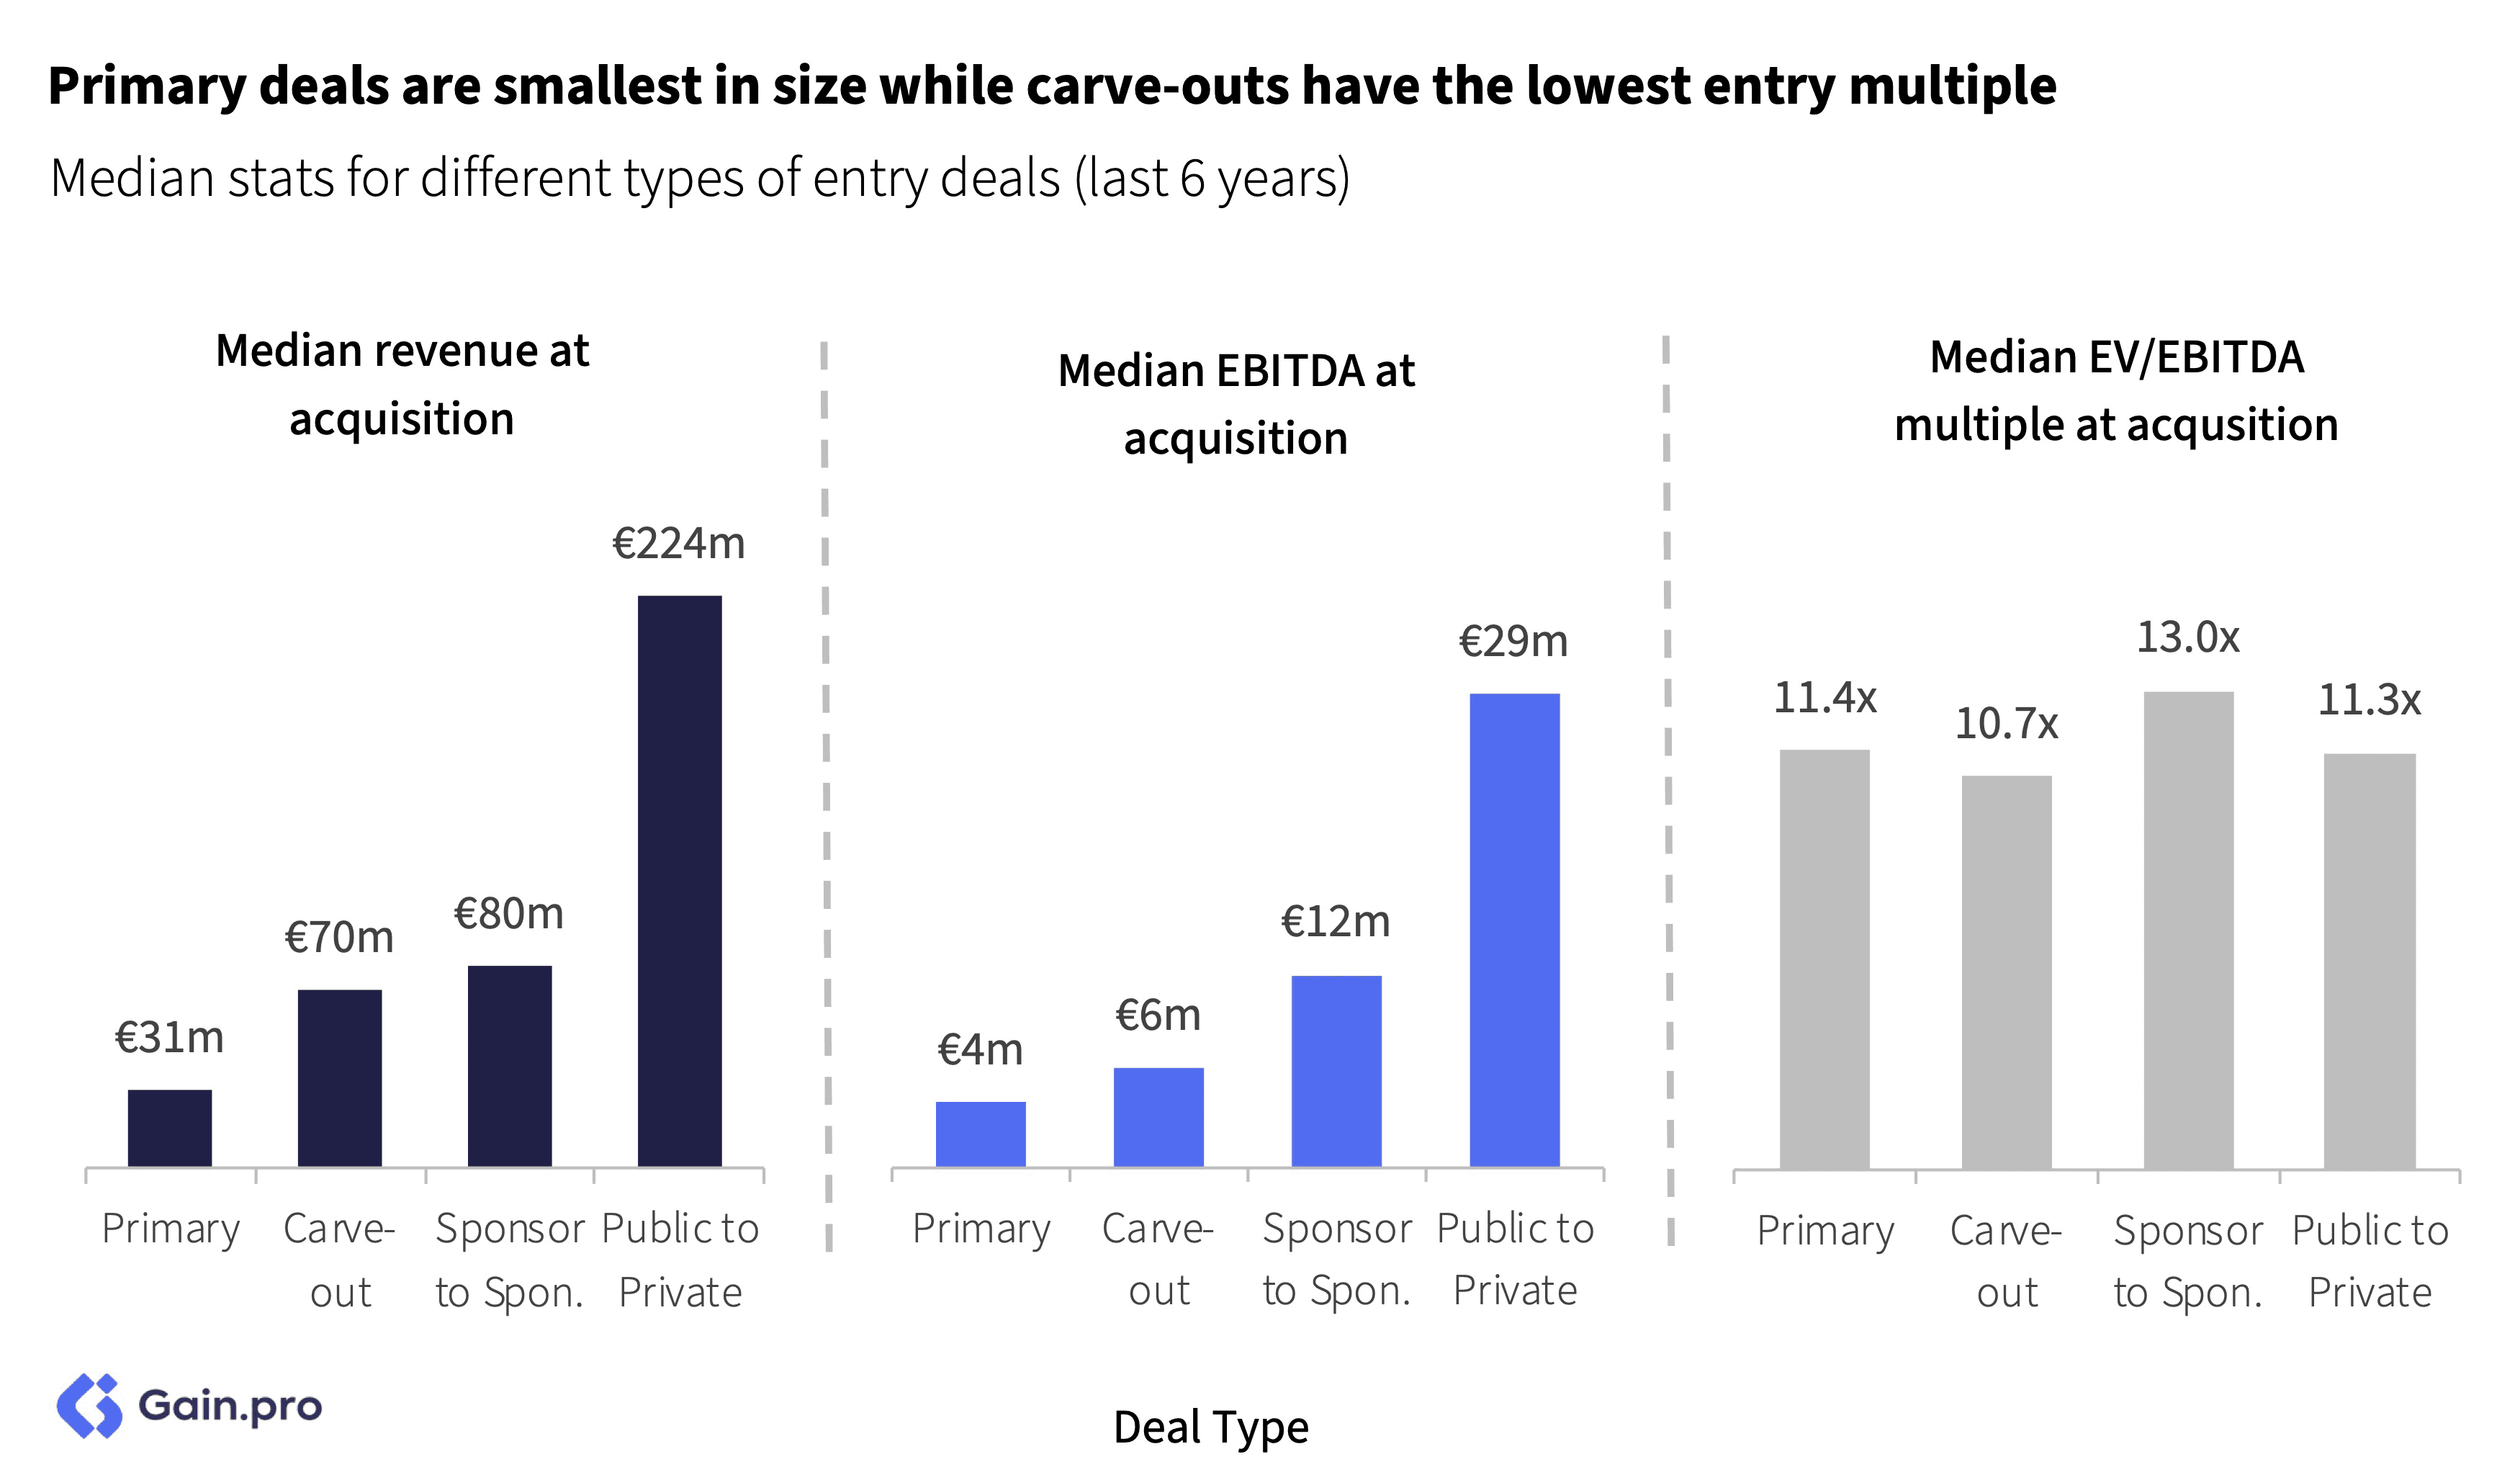
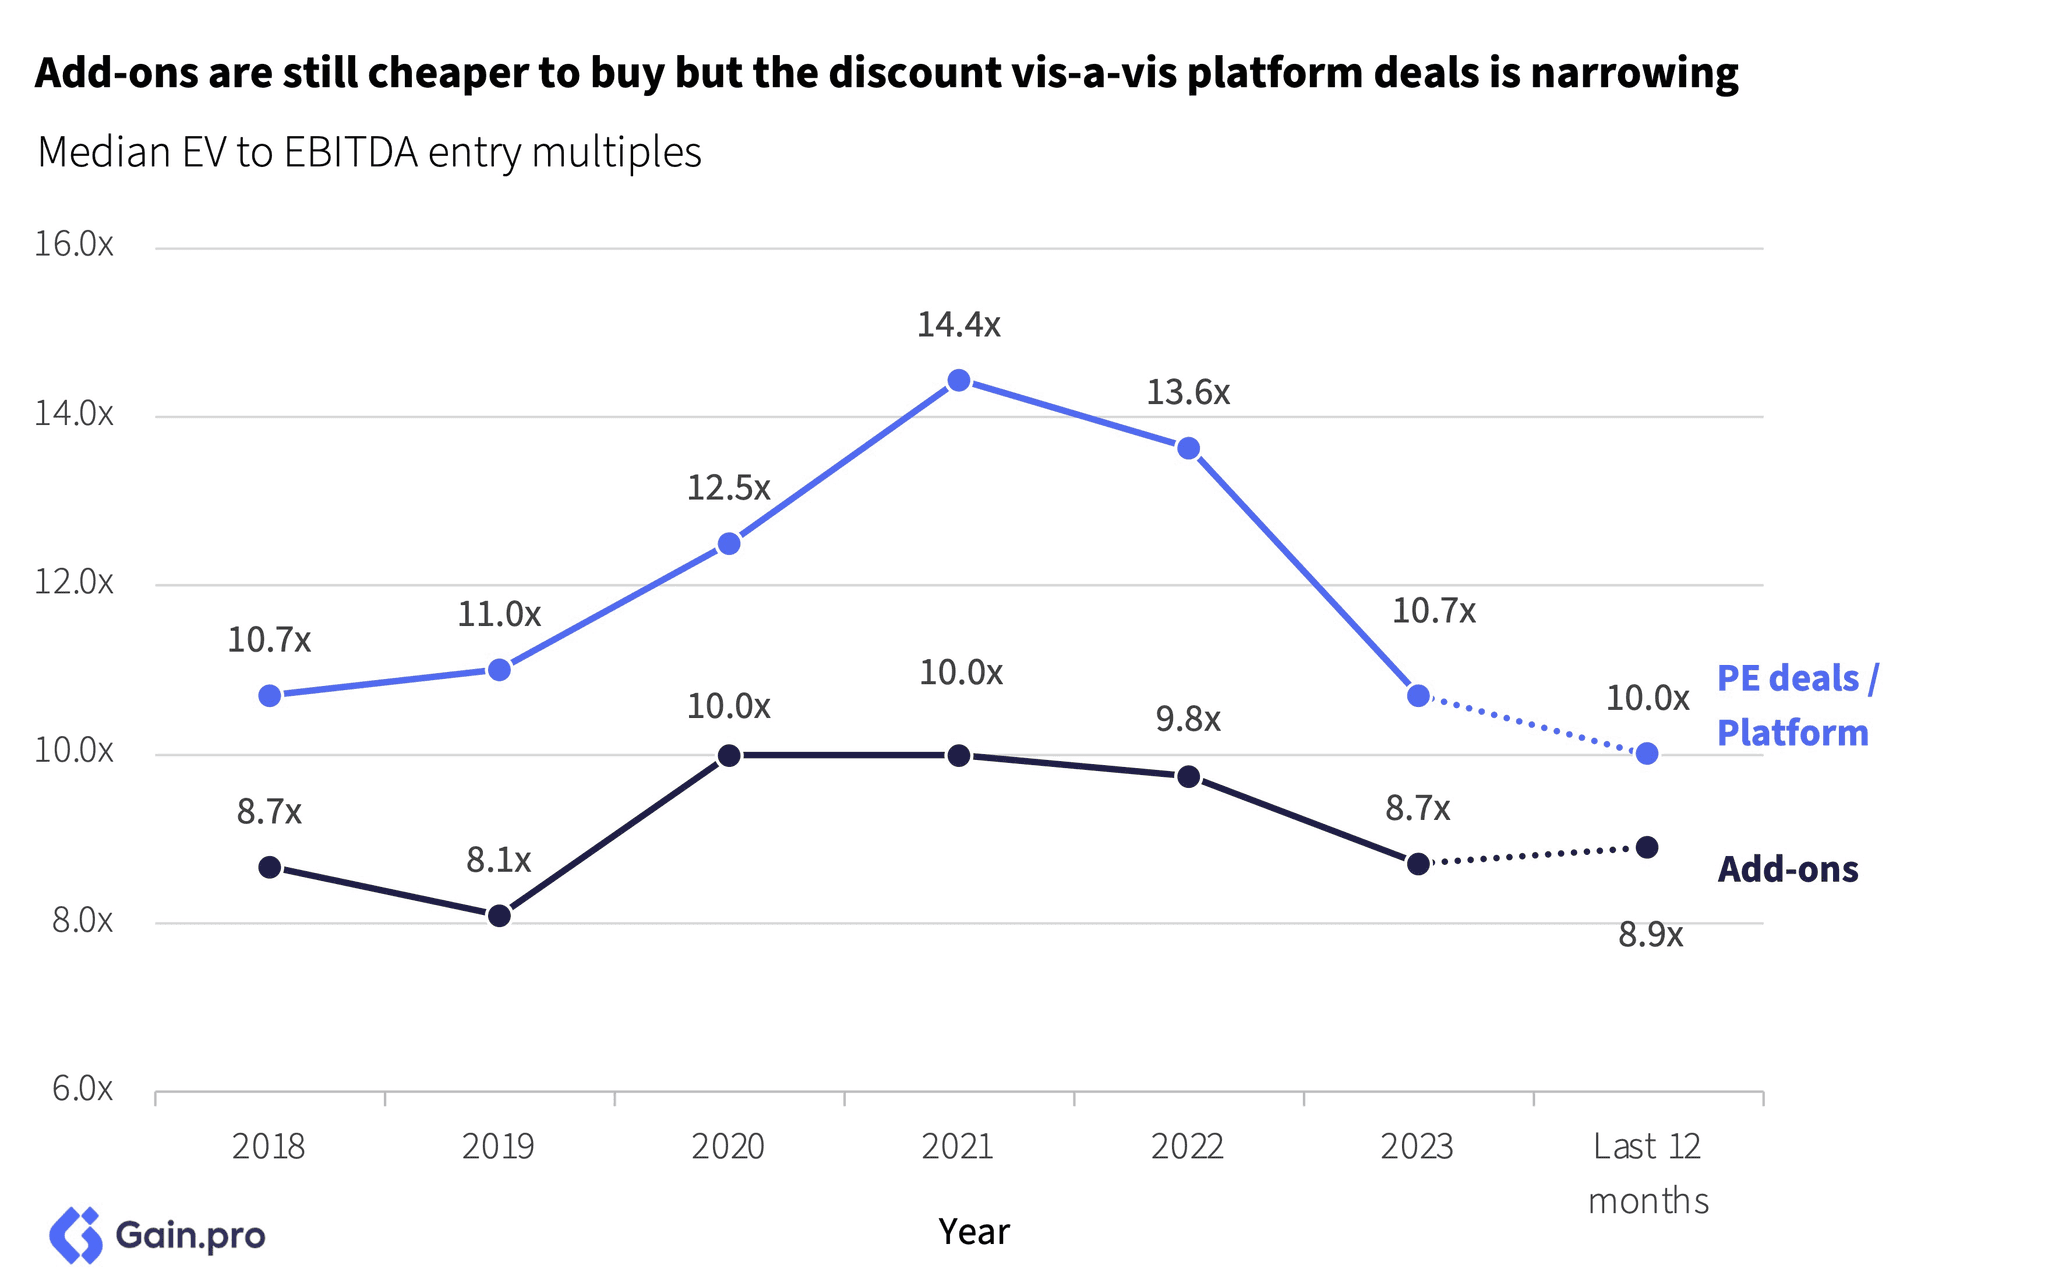
Entry multiples contracted sharply in 2023. The median entry multiple came down from 14.4x in 2021 (peak) to 10.7x in 2023. Macroeconomic headwinds, tighter financing conditions and less competition meant PE sponsors no longer needed to pay top dollar.
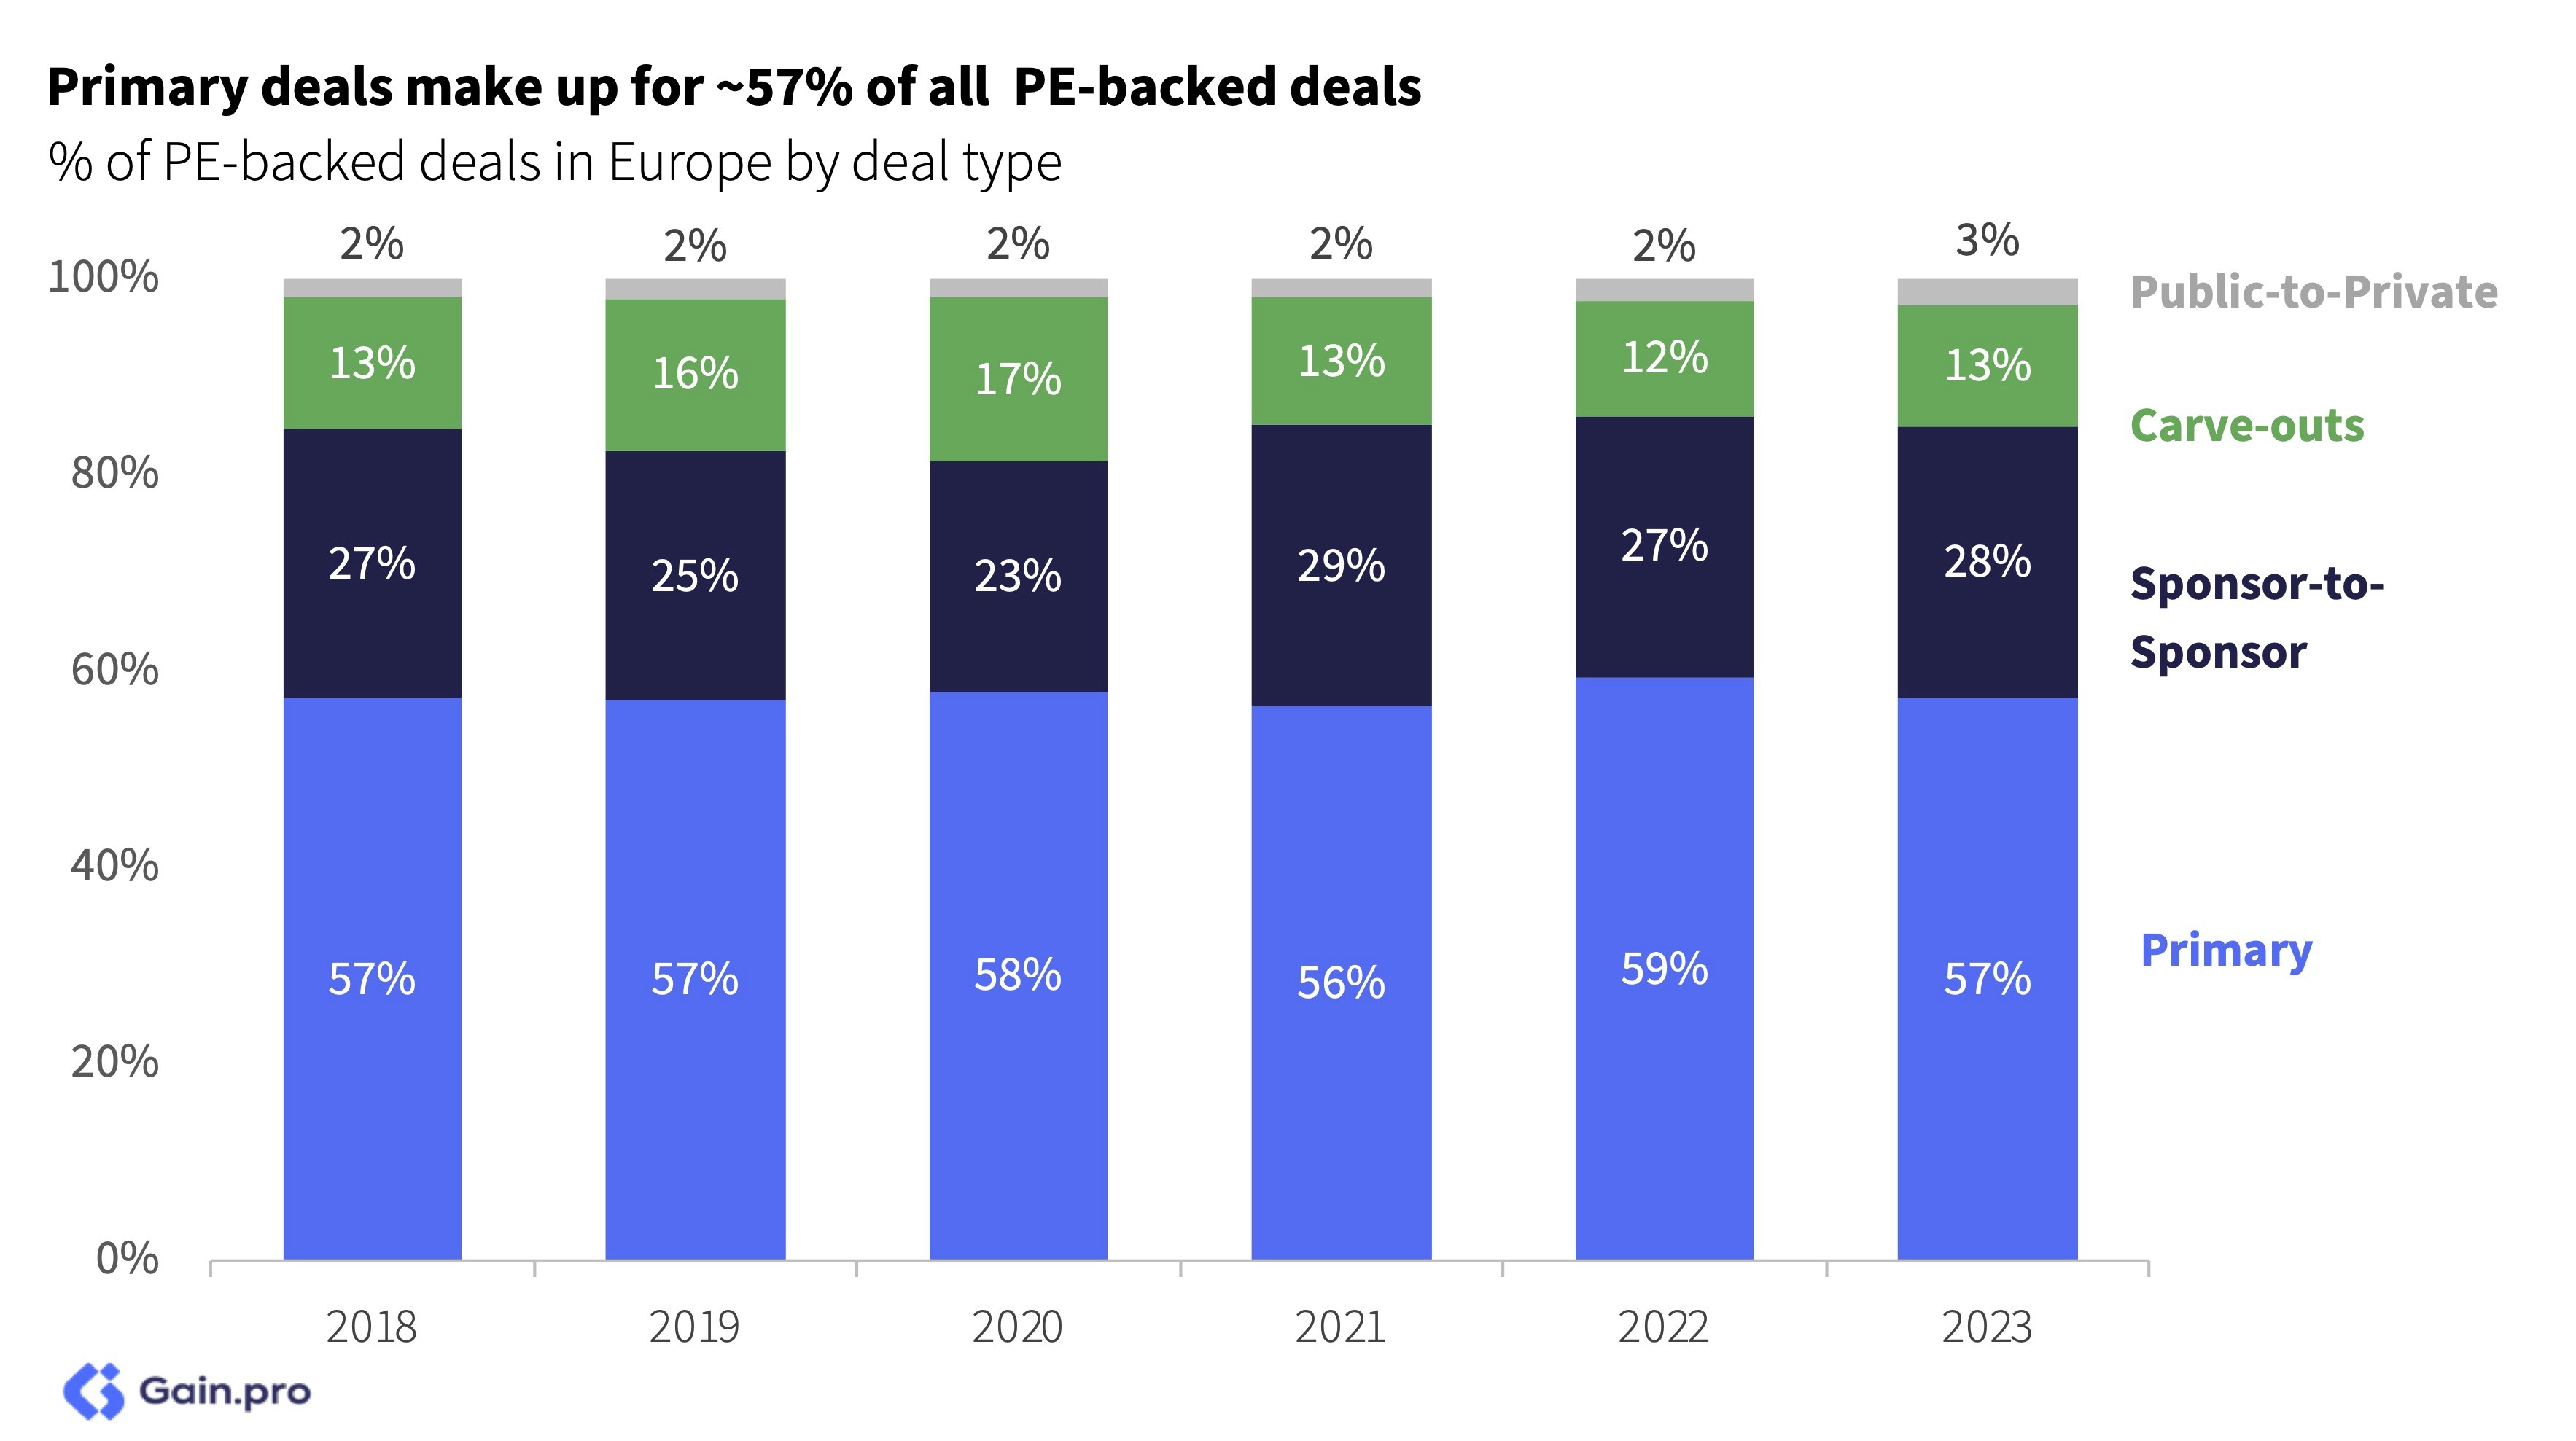
By deal type, primary deals i.e. sponsors buying independently held businesses accounted for the largest share of deals (57% of entries), followed by sponsor-to-sponsor deals (28%), carve-outs (13%) and public-to-private transactions (3%). It is worth noting the share of each type of transaction has remained remarkably consistent over the last 6 years.
Primary targets usually have the lowest median revenue (€31m) and EBITDA (€4m) at entry. In contrast, public-to-private transactions understandably have the highest median revenue (€224m) and EBITDA (€29m). Carve-outs usually have lower multiples as these divisions tend to be underperforming and they need a lot of investment to build up all support functions post-acquisition.
Entries by Sector
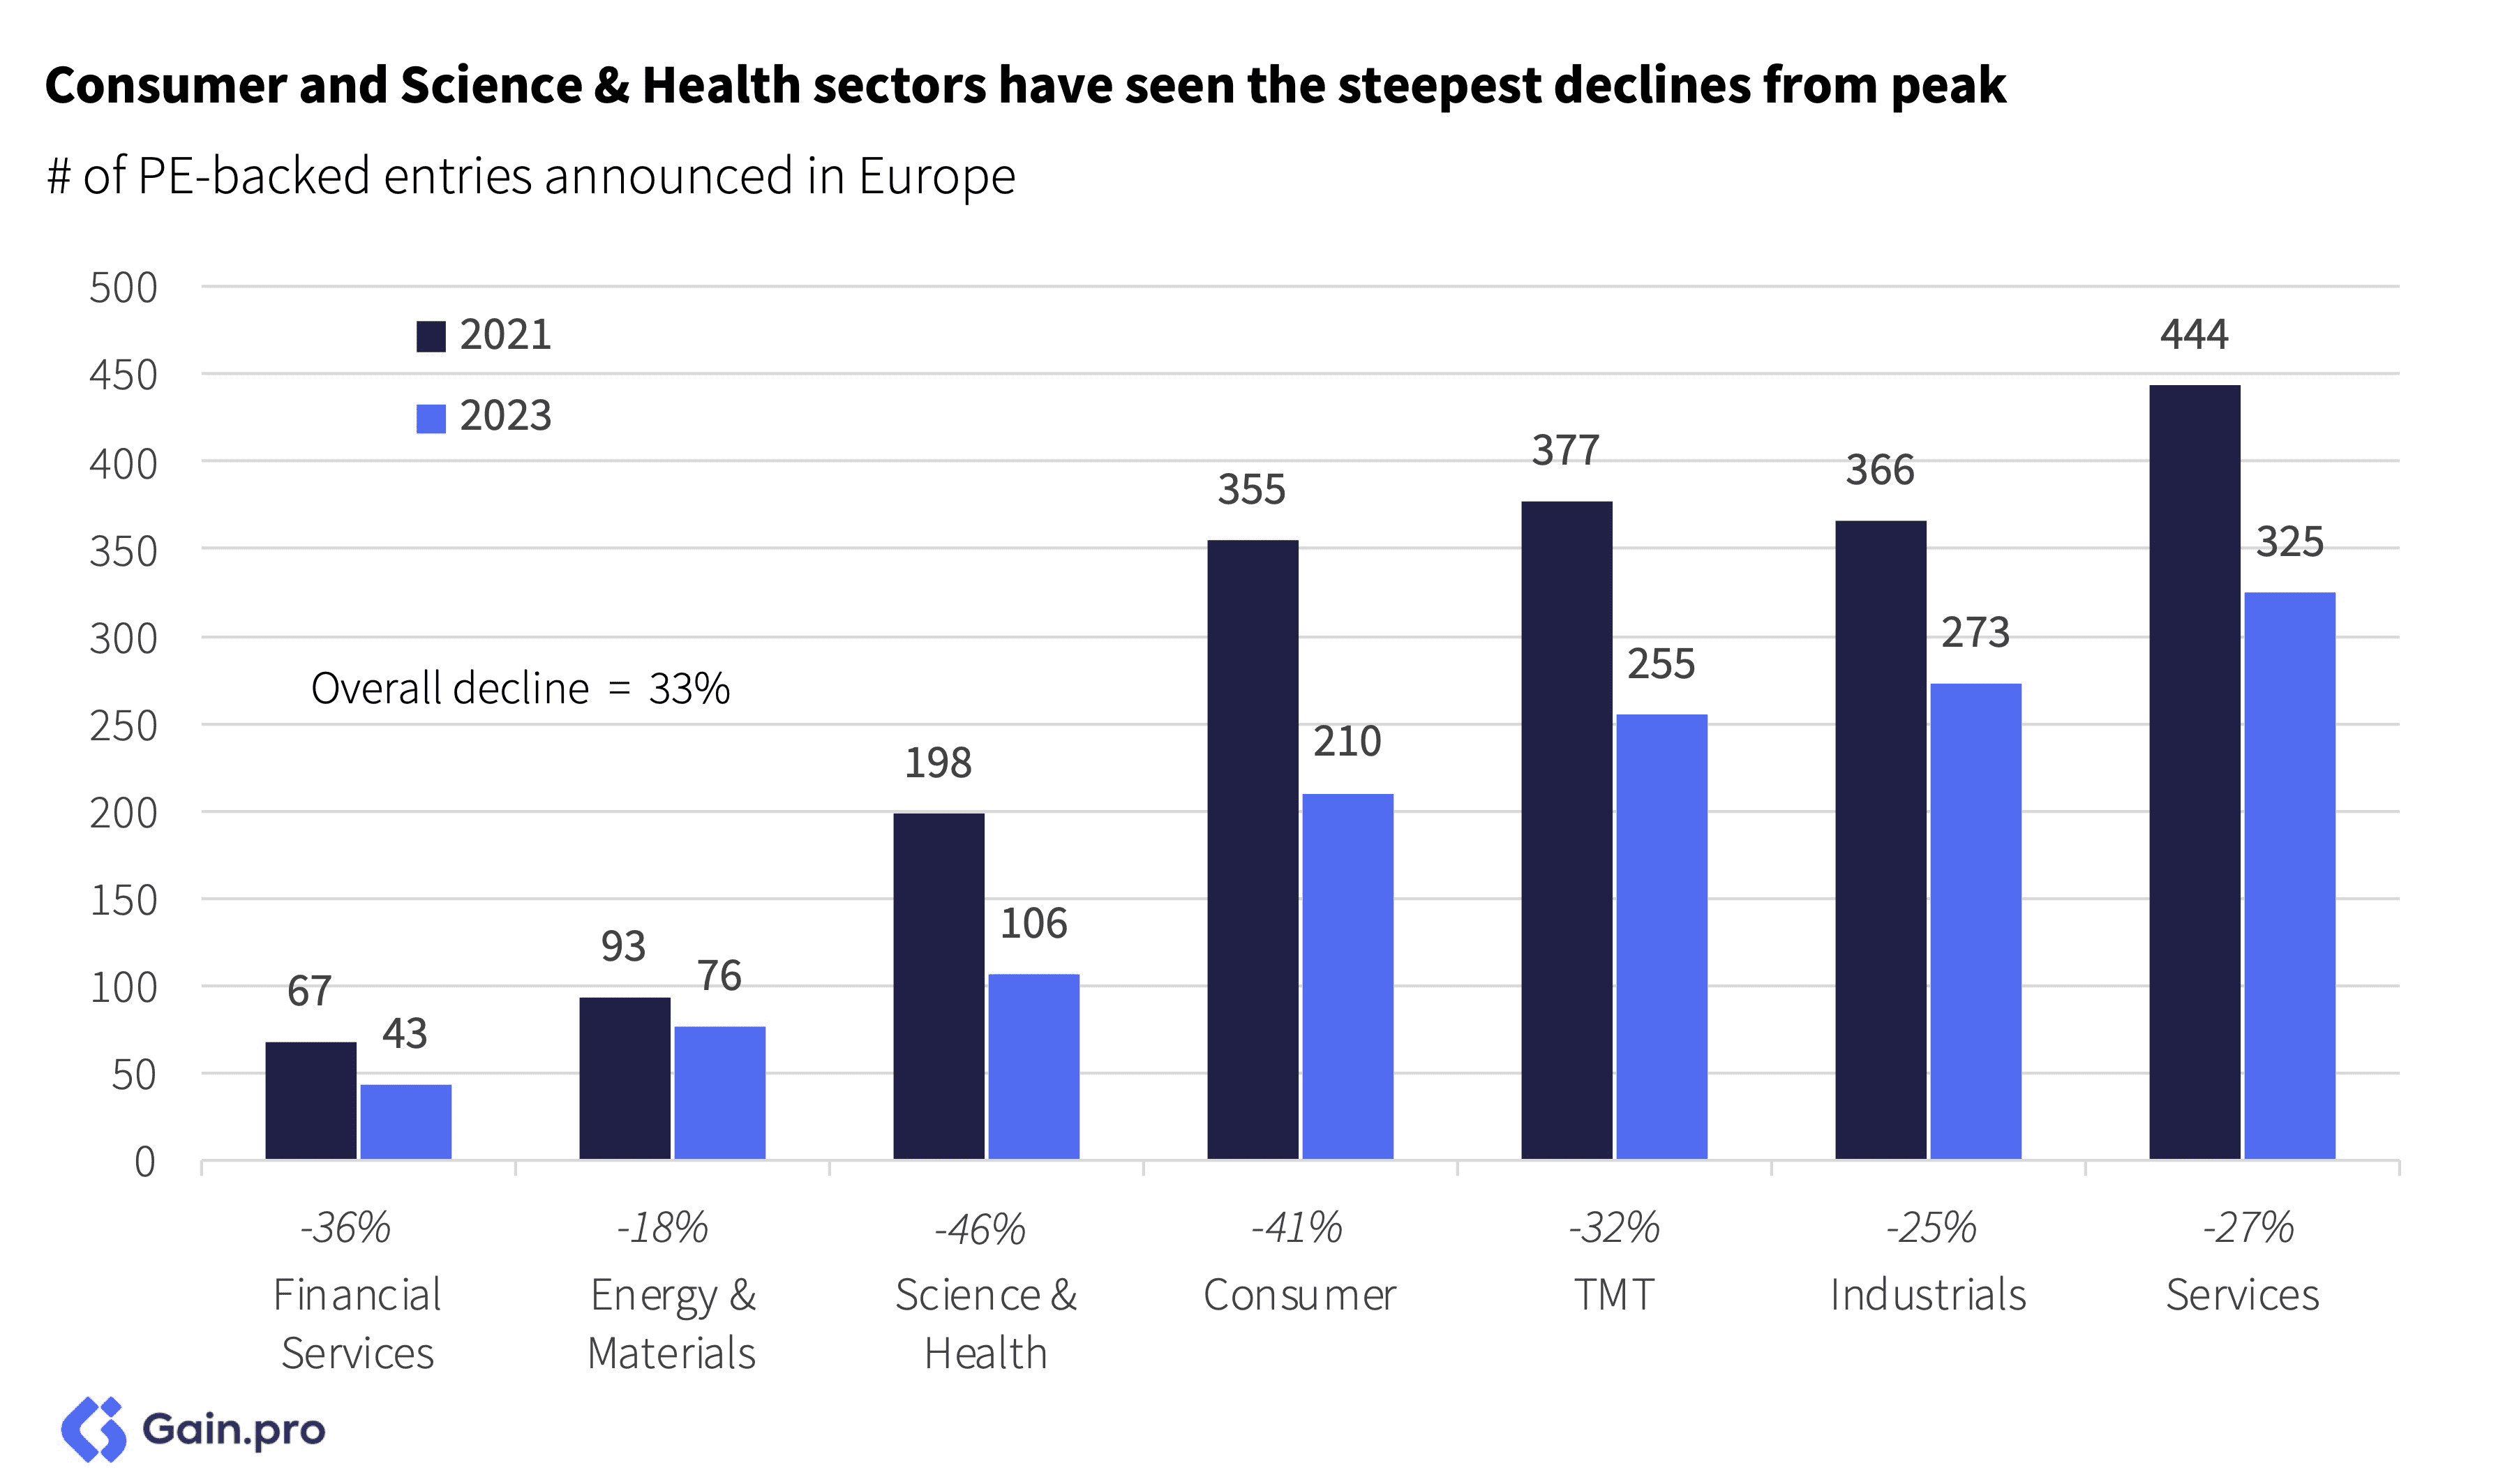
Entries were down across all sectors from the 2021 peak. However, Energy & Materials (-18%), Services (-27%) and Industrials (-25%) have proven to be more resilient while Consumer (-41%) and Science & Health (-46%) have seen the largest declines.
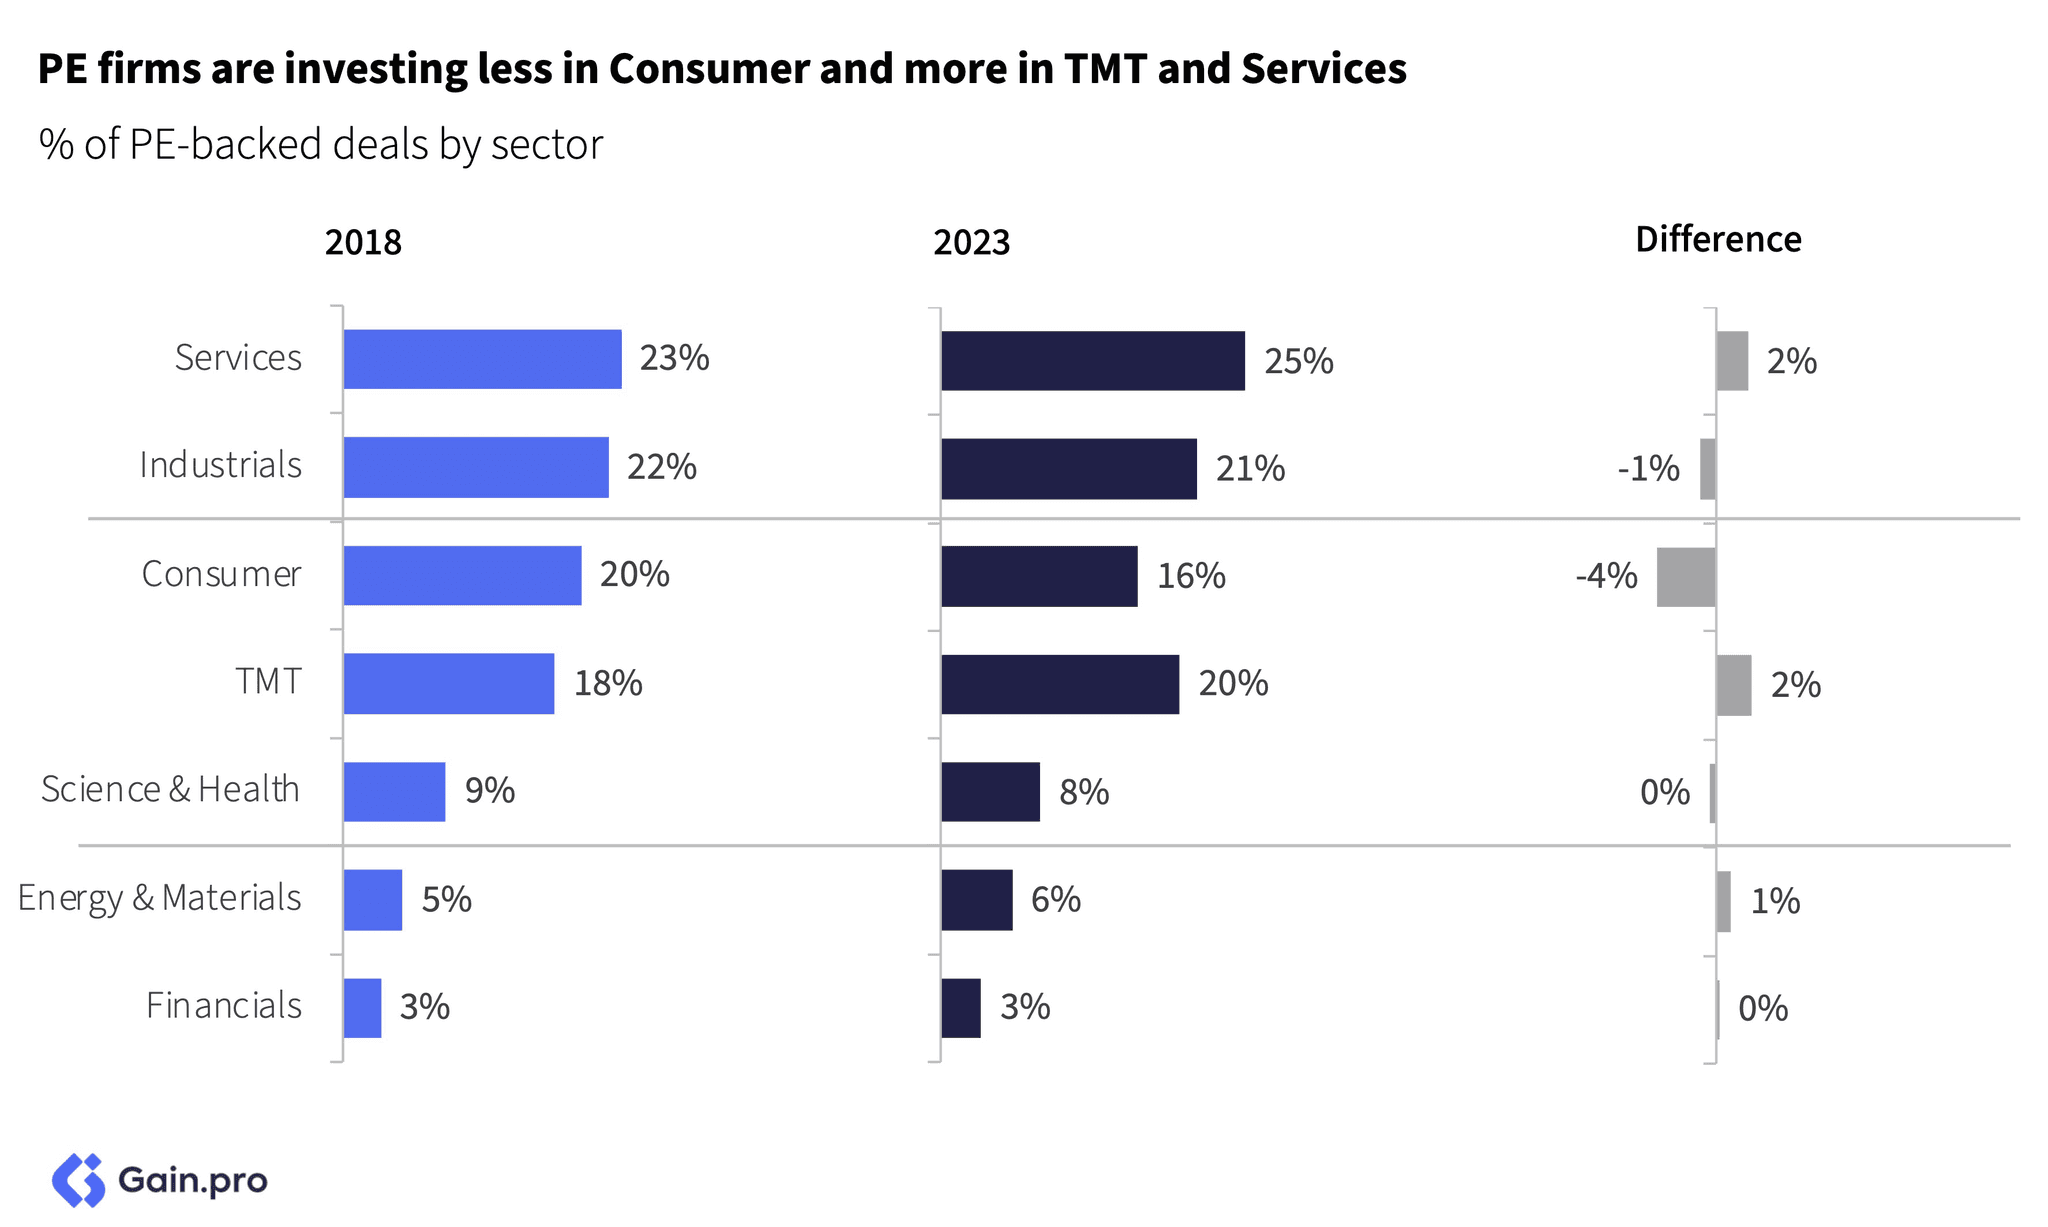
Over the longer term, the sector mix for PE entries has changed. The share of Services and TMT has risen as investors prefer asset-light, innovative and fast-growing businesses. The share of Consumer has shrunk, mainly driven by a COVID-fueled decrease in investor interest in the Retail and Leisure subsectors.
As for multiples, TMT and Science & Health command a healthy premium over other sectors driven by their high growth rates, attractive margins and resilience. On the other side, multiples are significantly lower for slower-growth sectors such as Industrials and Consumer.
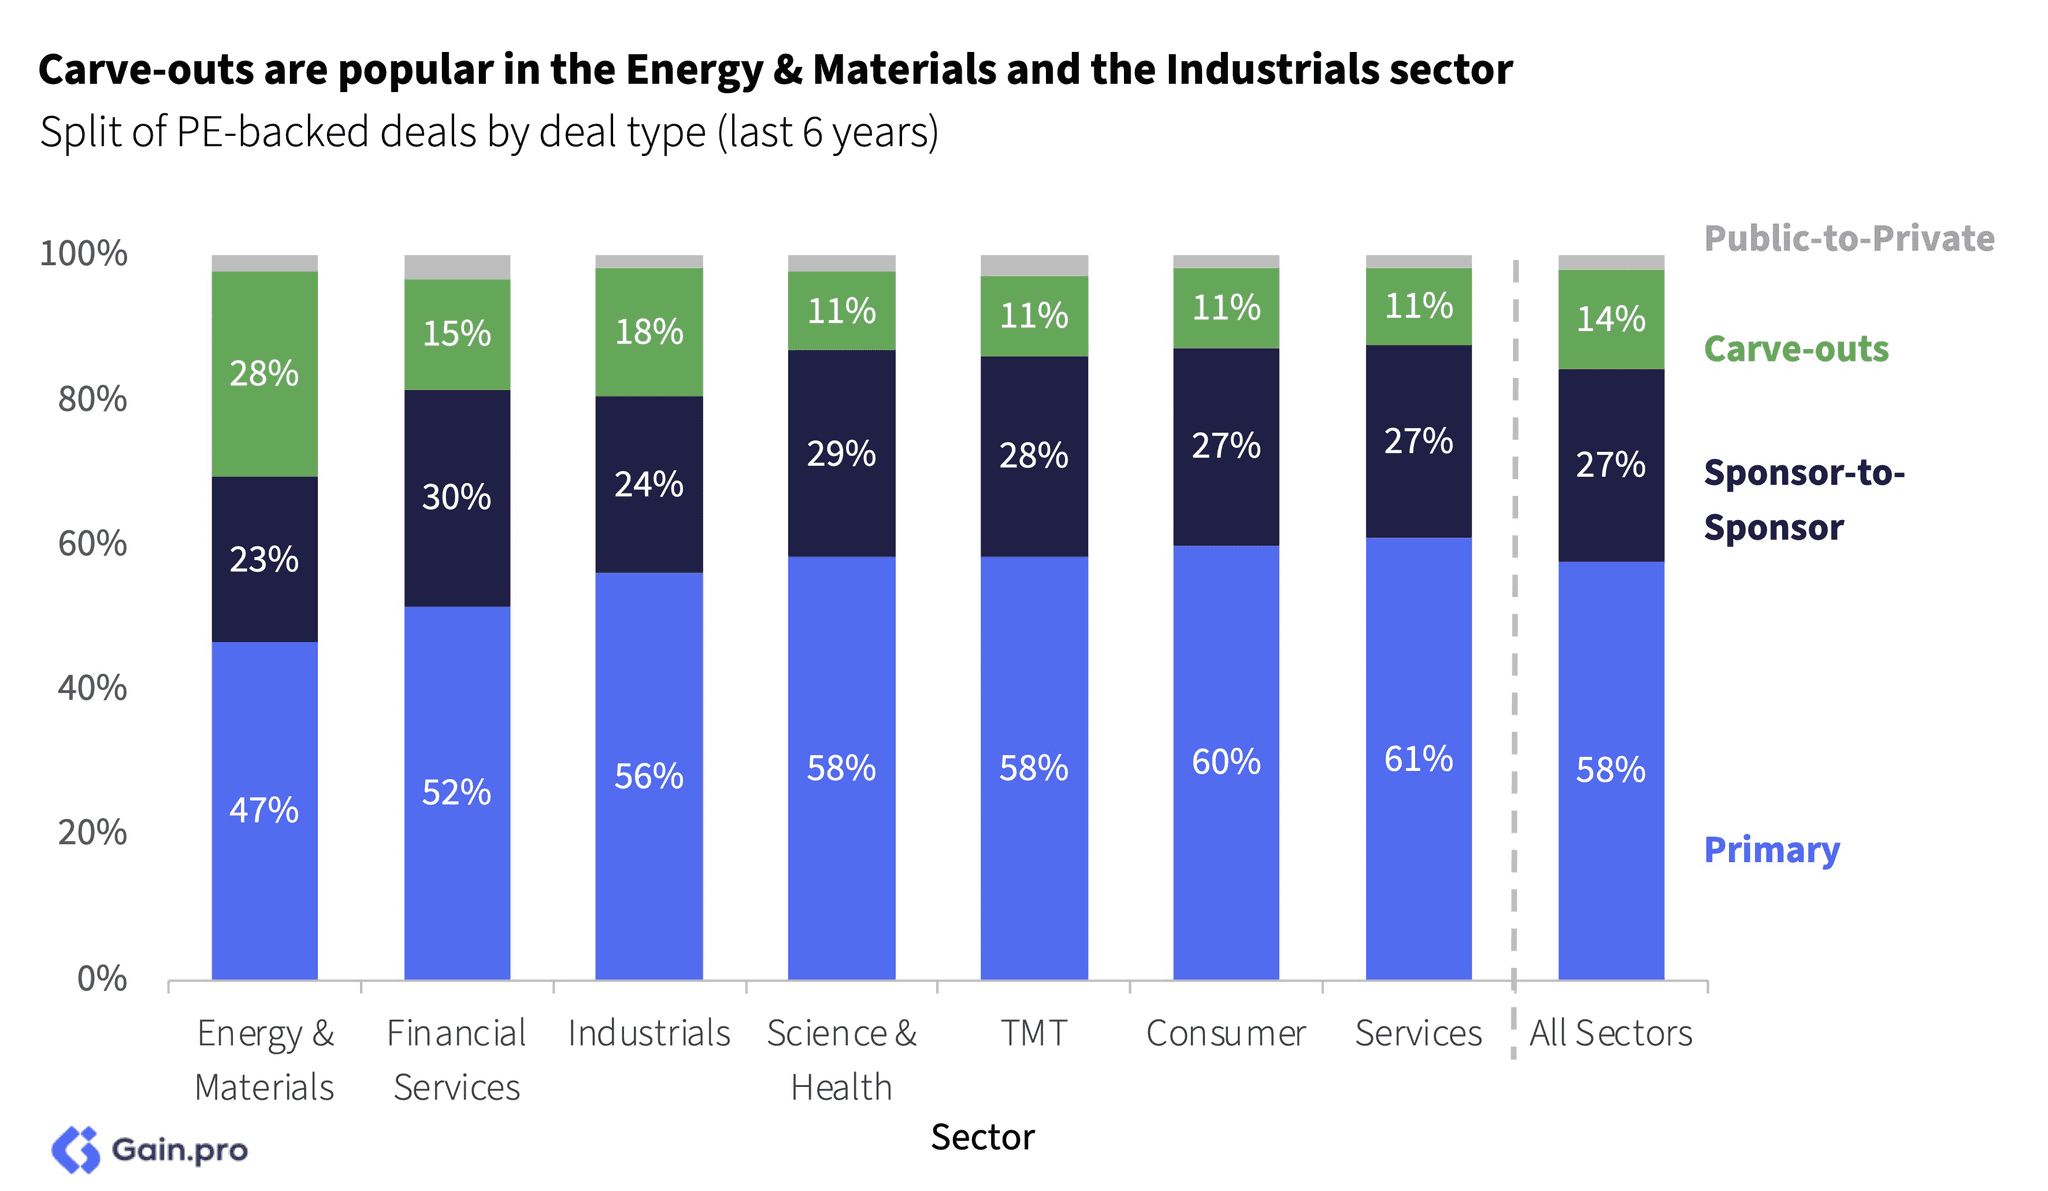
Although primary deals are the #1 entry type across sectors, we noticed some sectoral differences for other entry types. For example, carve-outs are more popular in Energy & Materials and Industrials. This is primarily due to a surge in large-scale conglomerates realigning their strategic focus by divesting certain assets.
Entries by Region
Italy (-8%), France (-8%), CEE (-16%) and Iberia (-16%) were the least impacted by the dealmaking downturn. In contrast, DACH (-44%), UK&I (-46%) and Nordics (-46%) have seen the steepest declines. As highlighted in our Europe 250 report, North American investors have taken a keen interest in Southern Europe regions such as Italy and Spain and are now investing more in these regions compared to their European counterparts.
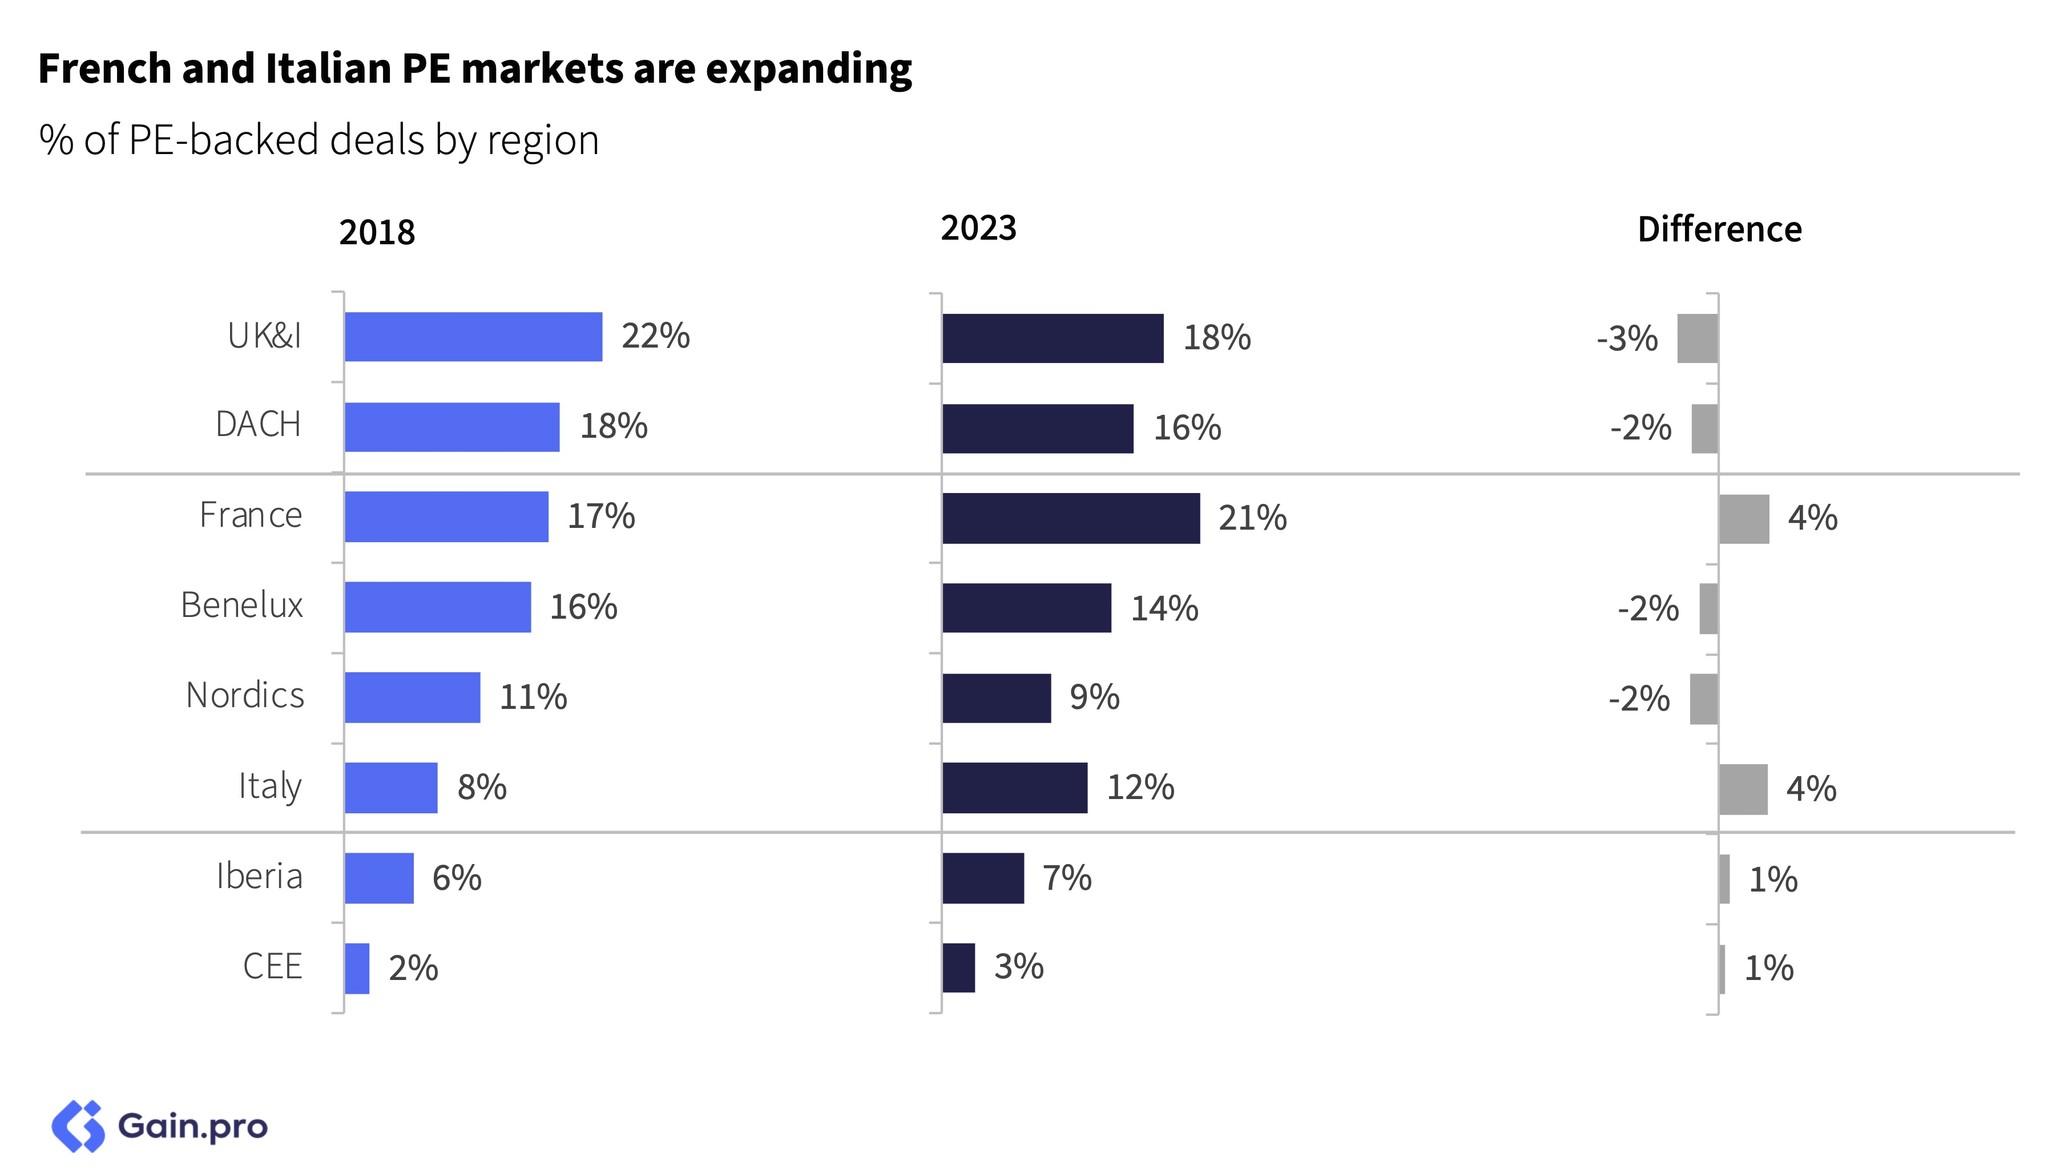
As for the deal count share, UK&I is declining (-3%) while France and Italy are gaining market share (+4%). As a region, France sees a lot more minority investments which drives up both the entry and exit count. Further, the French government is PE-friendly and continues to take active steps to lower barriers to PE entries in the region.

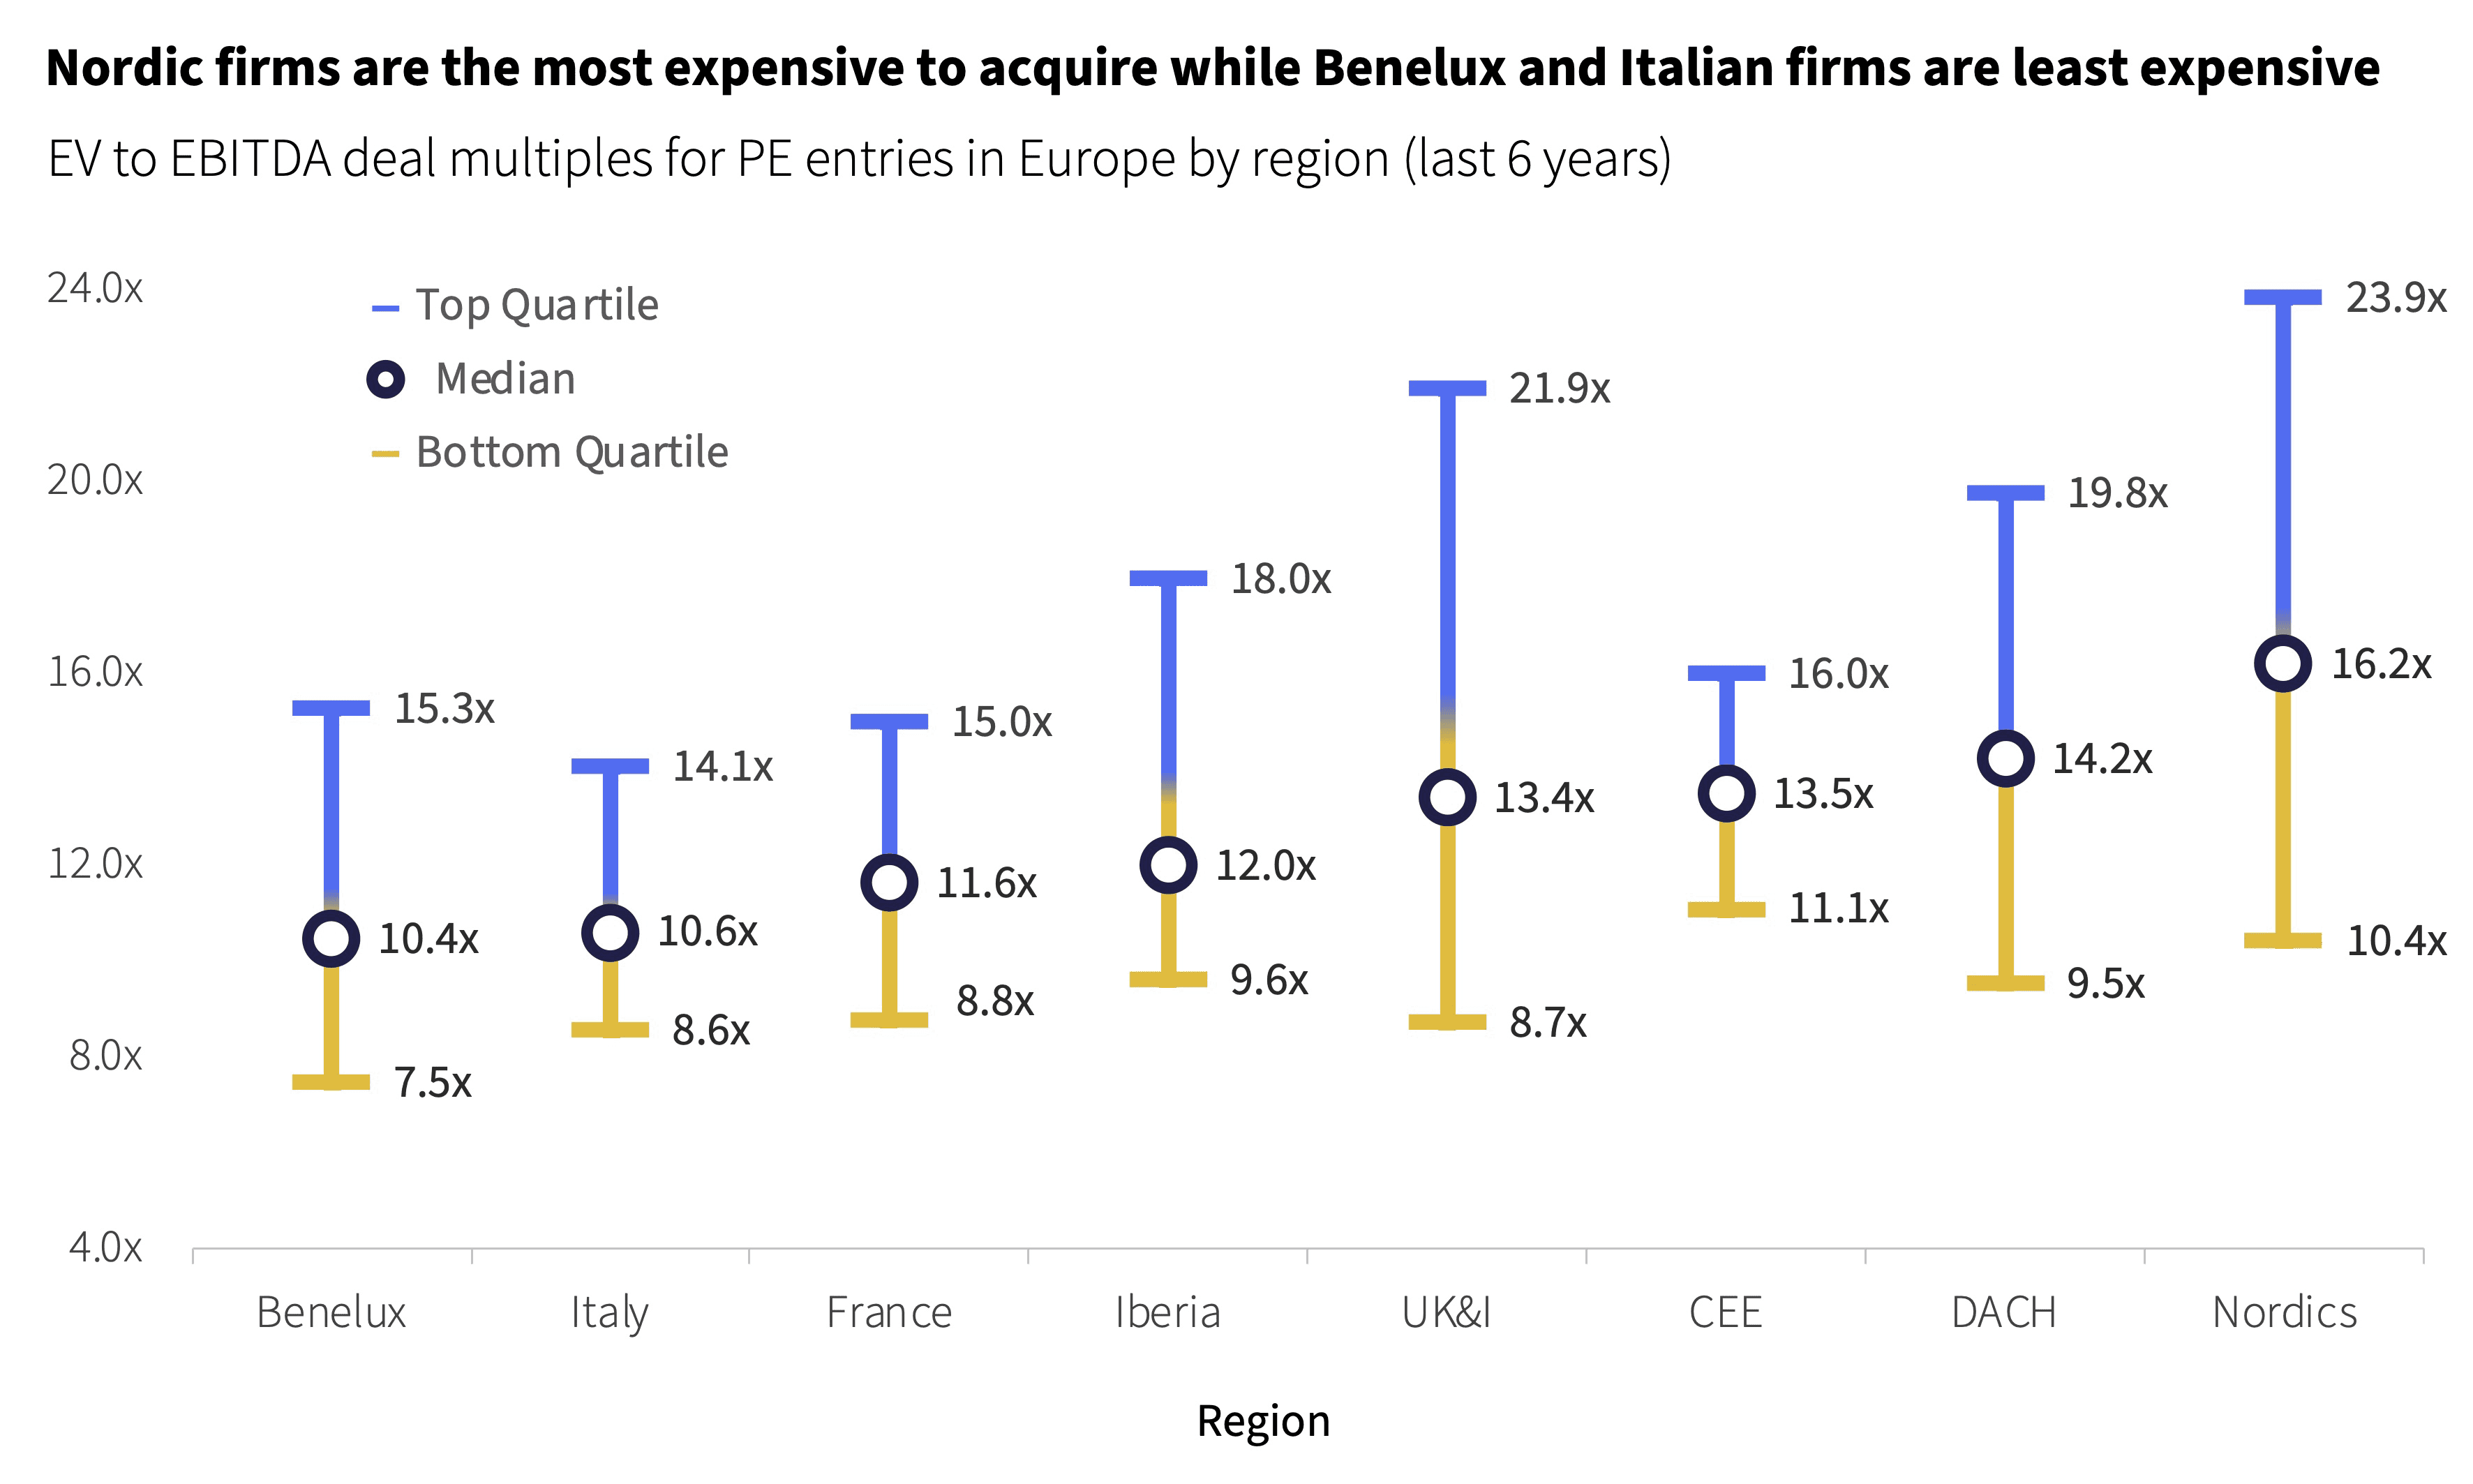
Entry multiples are highest in the Nordic region. Nordics is home to some of the fastest-growing assets and has a sector tilt towards high-growth and high-margin TMT and Services sectors which have higher multiples. On the other side, entry multiples are the lowest in Benelux and Italy which have a high share of Industrials and Consumer assets.
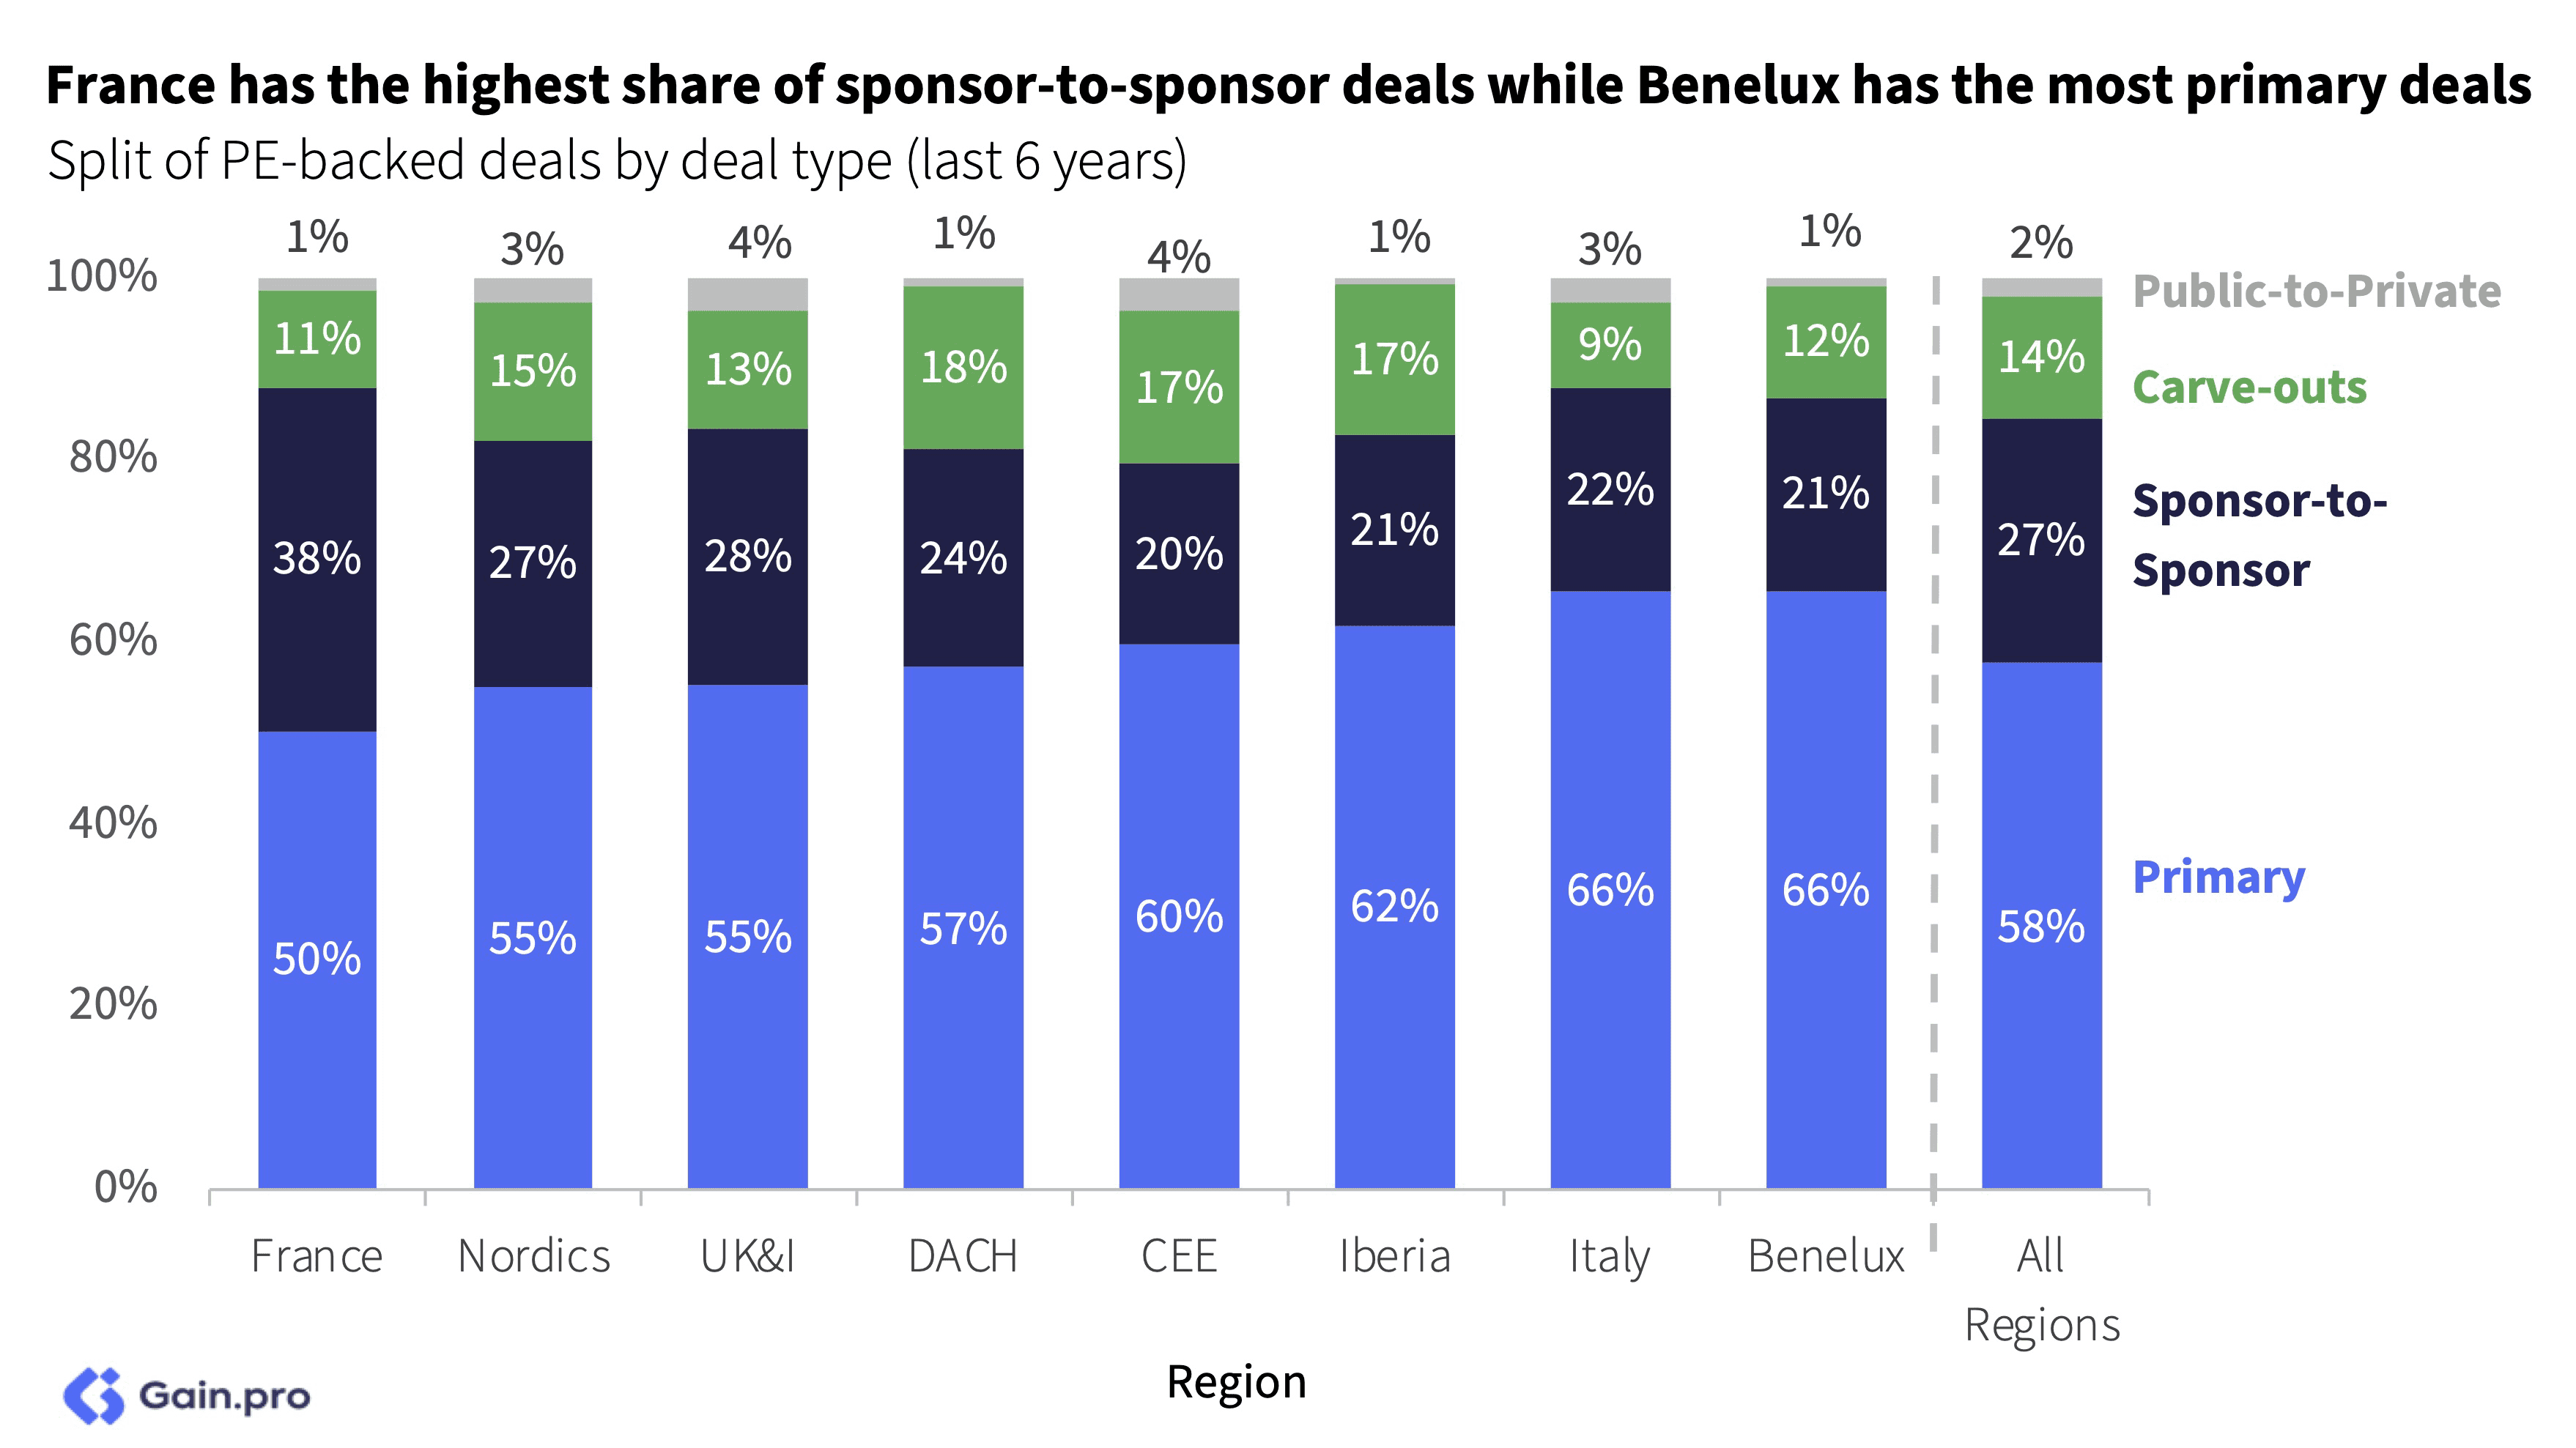
By entry type, France stands out with 38% of all entries being sponsor-to-sponsor (vs. 27% across Europe). France is characterized by especially high PE penetration rates so it is understandable that the share of investor-to-investor deals is larger. As for carve-outs, they are more popular in DACH given the strong presence of large industrial conglomerates.
Chapter 02: Buy-and-Build
Add-on Activity
In line with the overall market, add-on activity in 2023 also took a hit. Deals were down 31% YoY though they still outpaced pre-pandemic levels. By sector, Services accounted for the largest share of add-on deals (39%) followed by TMT (21%) and Industrials (13%).
Despite the decline in add-on transaction volumes, the ratio of add-ons to total PE deal activity in Europe remains near the decade-high. Add-ons have become an important tool in the PE value creation toolbox. 73% of all PE deals in 2023 were add-ons (up from 64% in 2018).
Nearly half (47%) of the PE-backed businesses carry out add-on acquisitions, with 8% acquiring 5 or more companies in the last 5 years. Add-on deals are usually smaller in size. The median revenue of all add-on deals in the last 6 years stands at €11.0m while the median EBITDA stands at €2.5m.
Why Buy-and-Build?
Add-ons can drive a lot of value by accelerating revenue growth, cost synergies and multiple arbitrage. Because of their smaller size, add-on targets are often cheaper to buy (~20%) compared to platform deals although recent data suggests that the discount is narrowing.
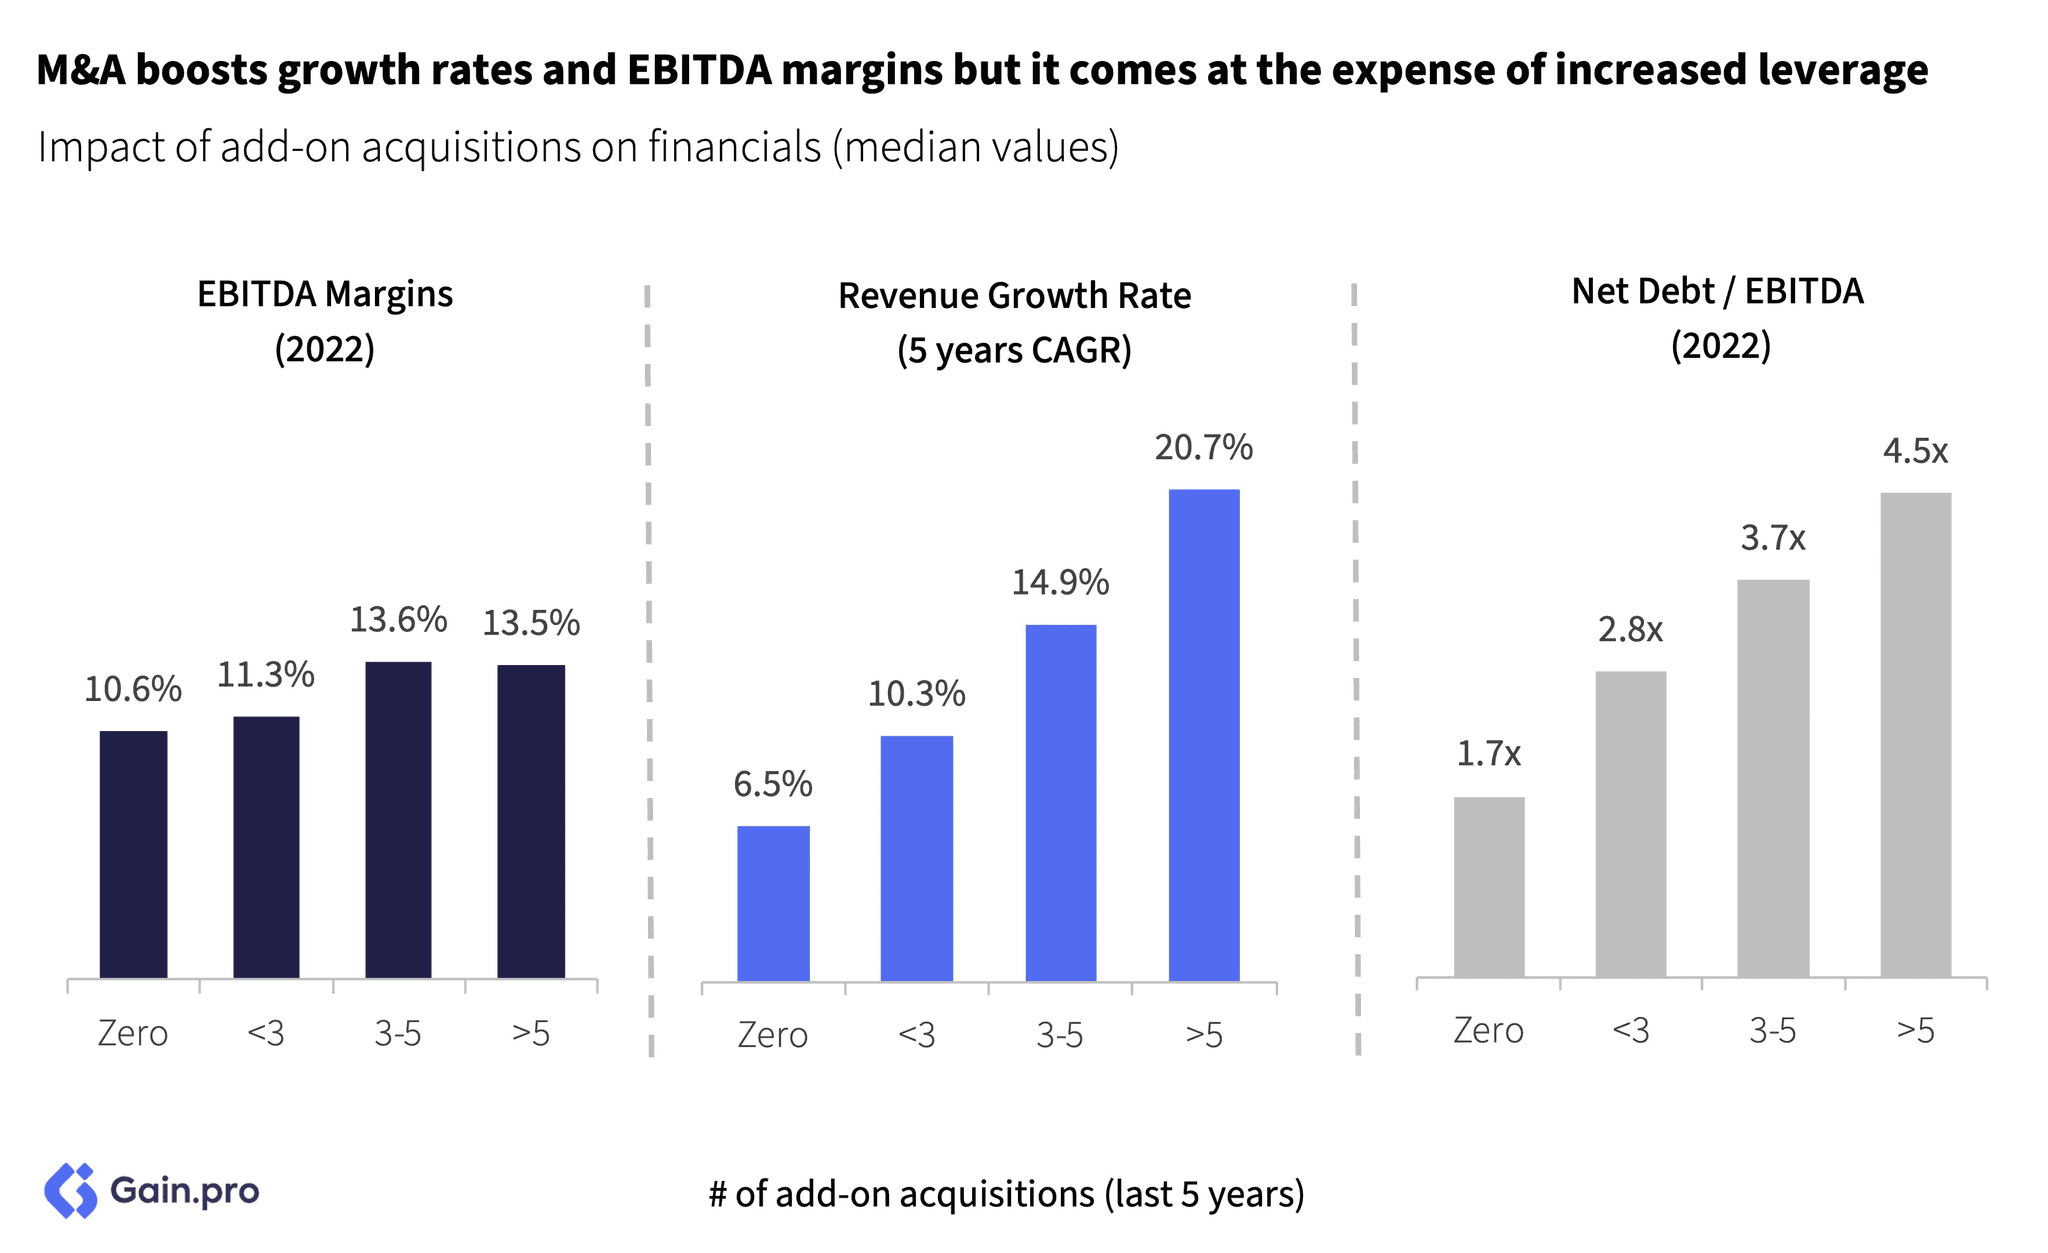
Add-ons help boost growth rates and EBITDA margins. PE-backed businesses with over 5 acquisitions grow at a CAGR of 20.7% compared to 6.5% for businesses with no acquisitions. But with more acquisitions also comes more debt, which increases the overall risk profile of the investment.
Sector and Regional Insights
Financial Services and Services are the most active sectors for add-ons. We see market fragmentation combined with complexities in capturing organic growth as the key reason behind their leading position. In particular, we see many British asset managers and insurers doing M&A to shore up their AUM and market share. For Services, the biggest consolidators are operating in the Technical and Professional Services subsectors across Europe.
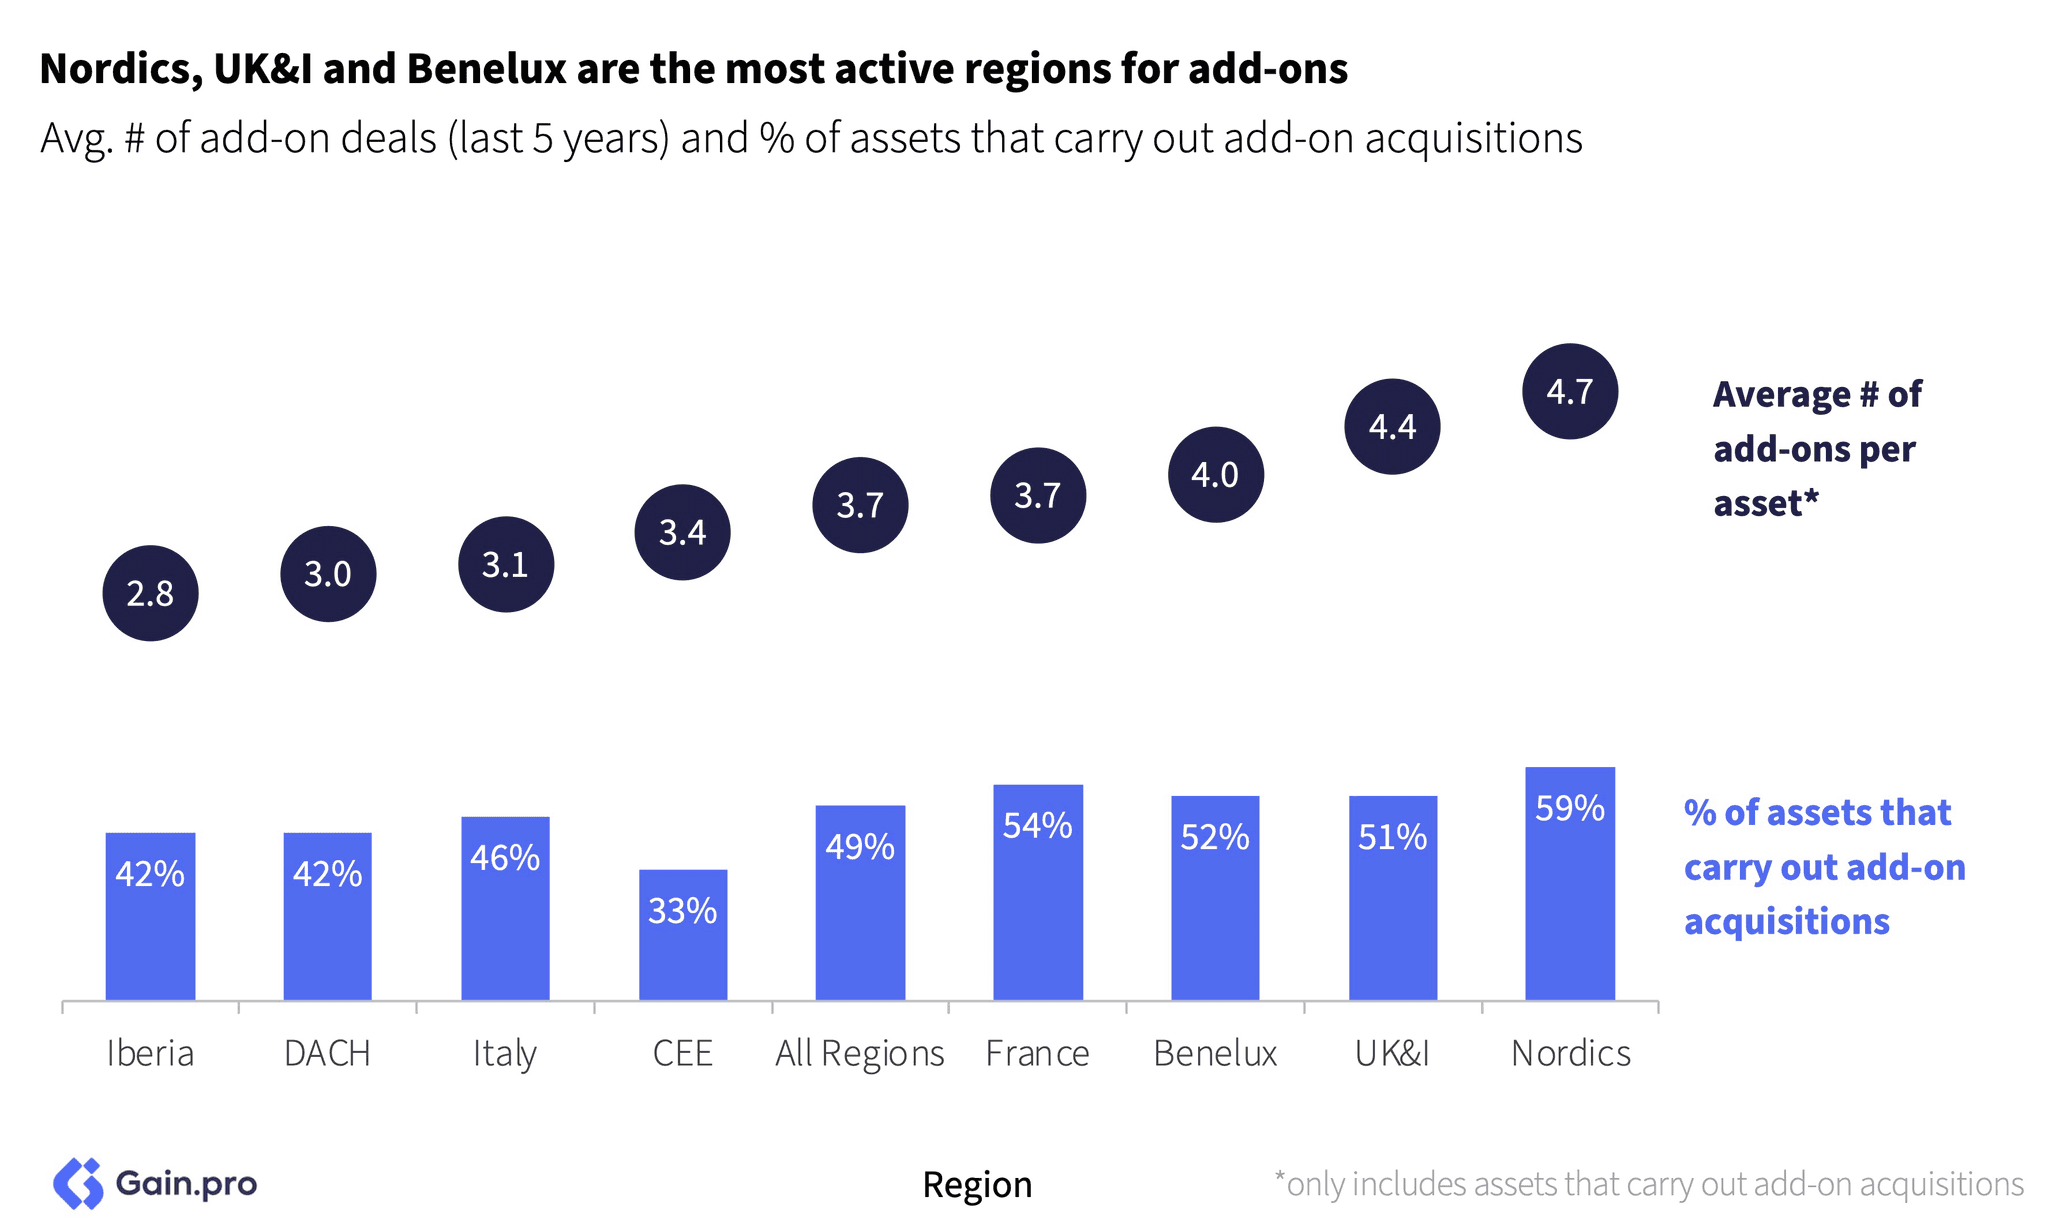
Nordics is the most add-on heavy region in Europe with 59% of assets there pursuing a buy-and-build strategy. Besides being Services-heavy, the small scale of local markets and the shared understanding of language among Sweden, Denmark and Norway makes bolt-on acquisitions effective.
Chapter 03: Exits
Overall Trend
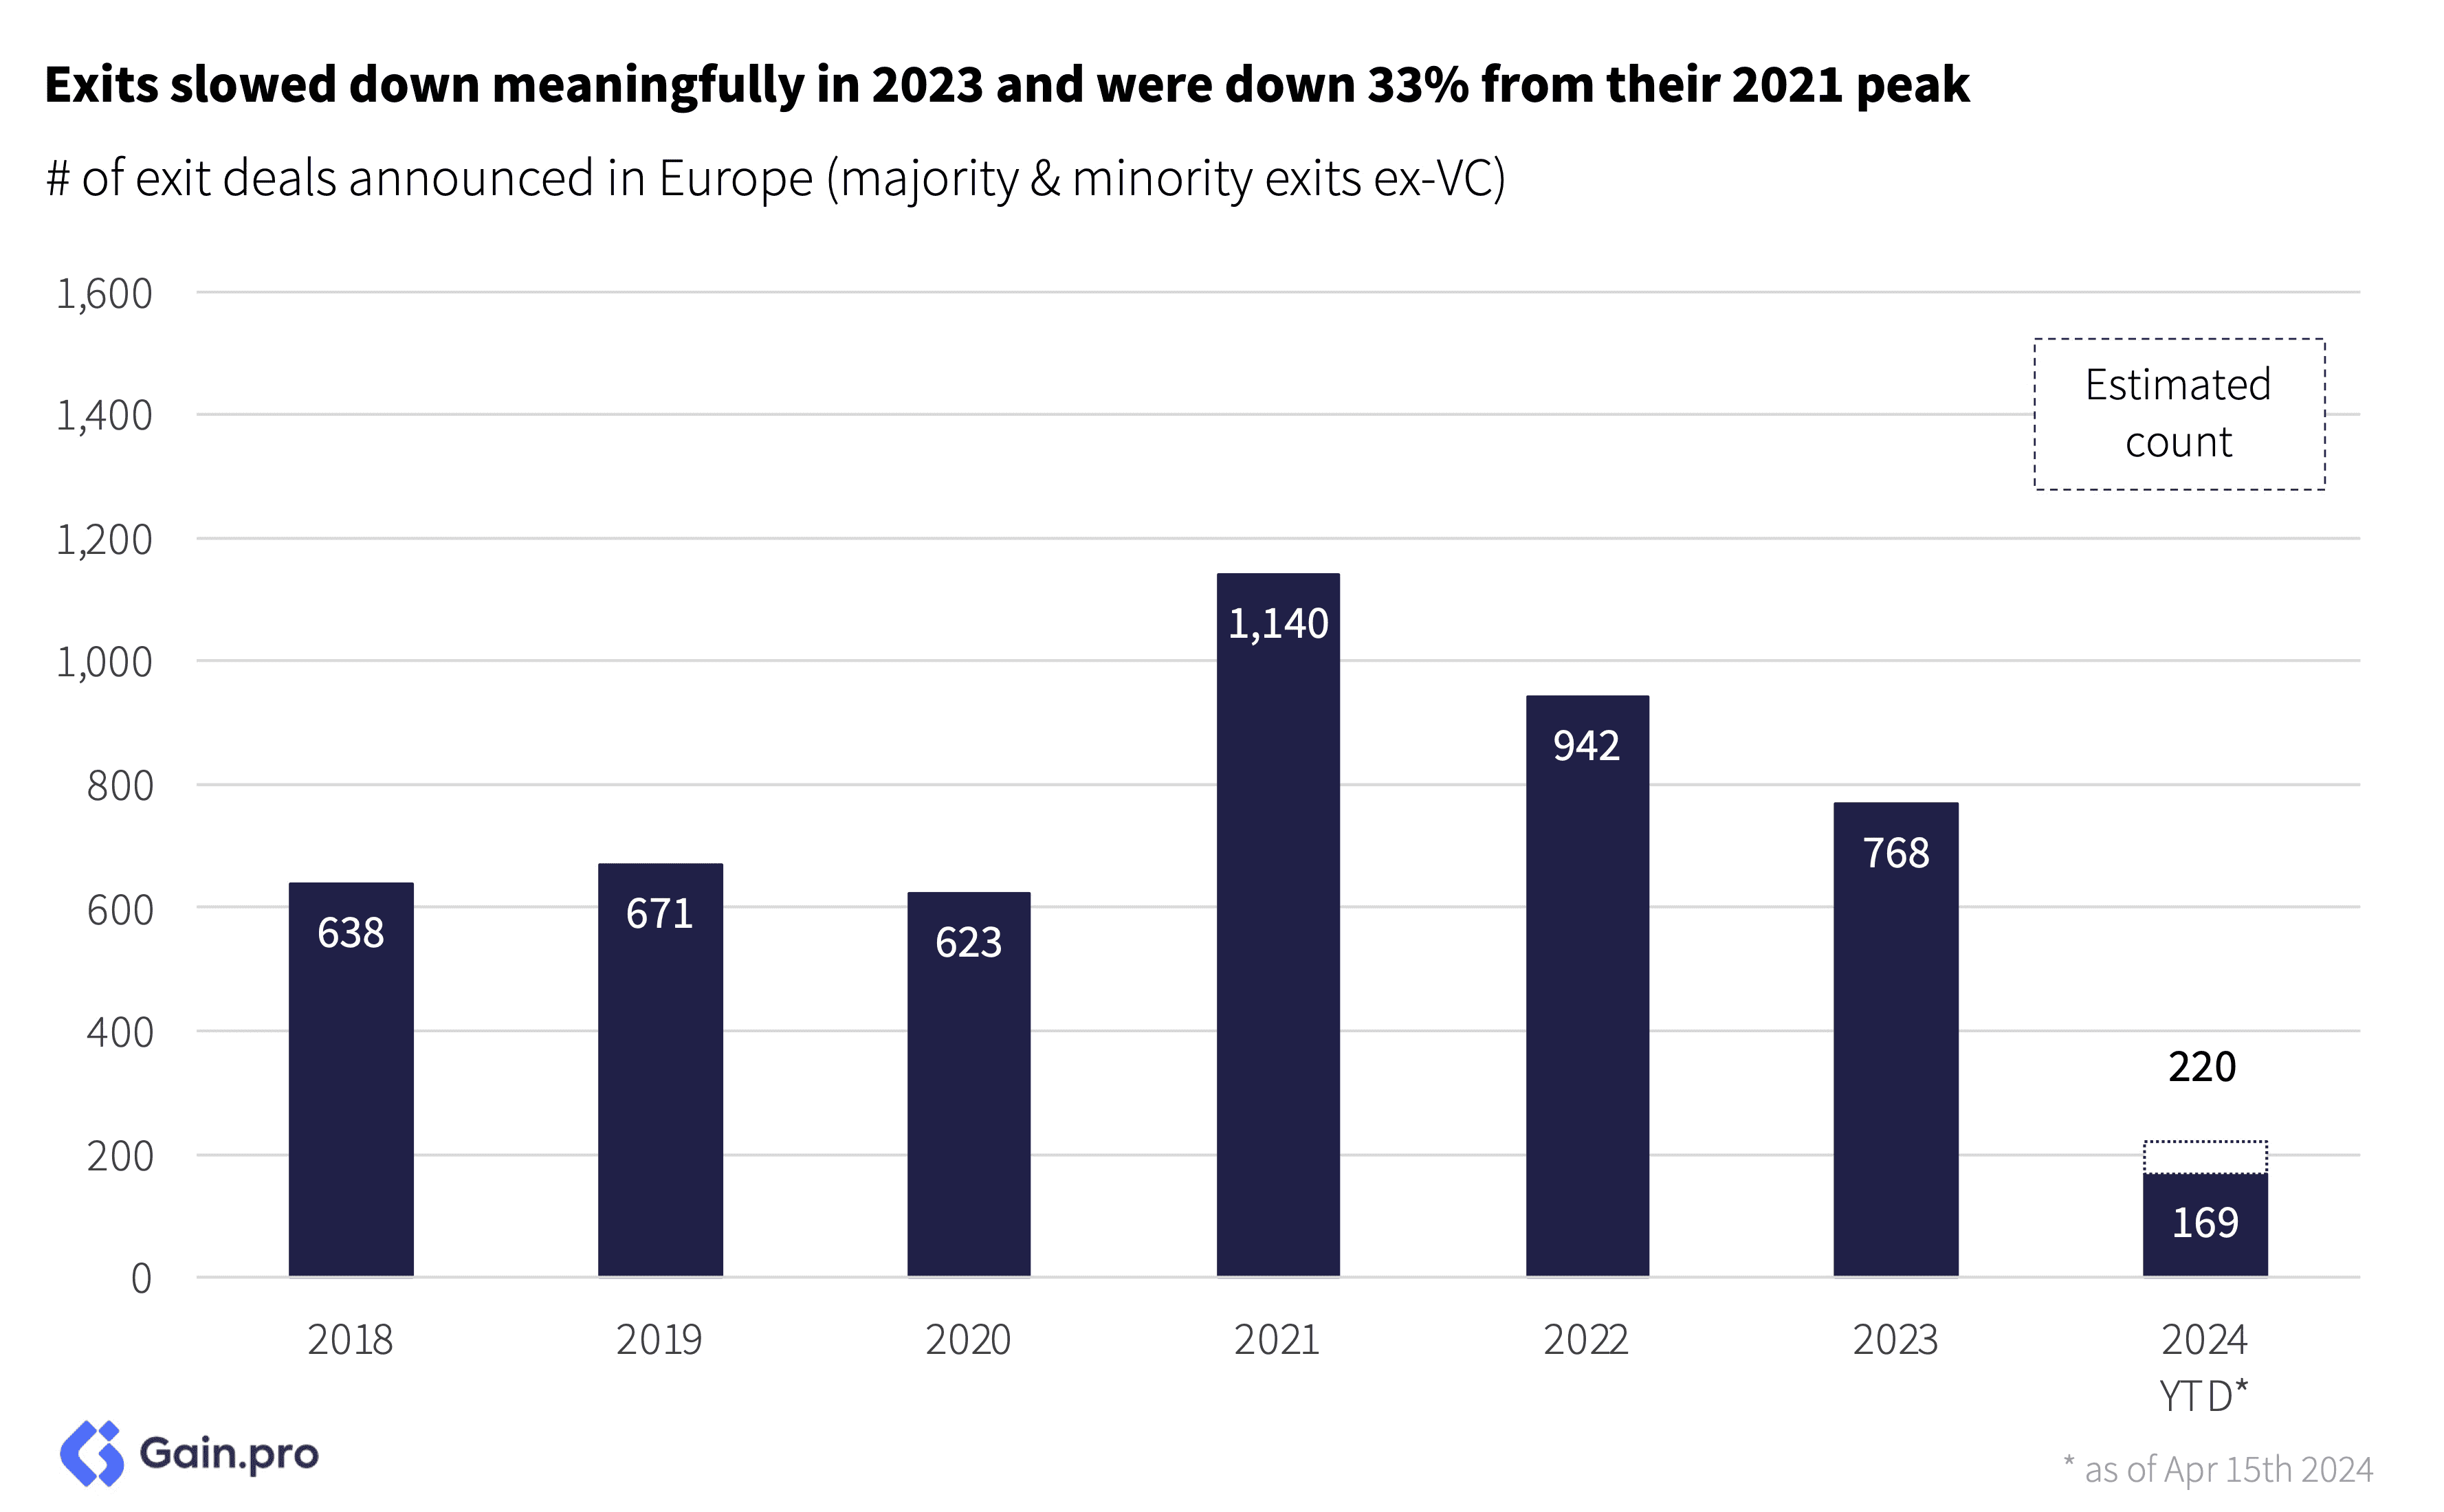
Exits slowed down meaningfully in 2023 and were down 33% from their 2021 peak. Higher interest rates, macro uncertainty, lower valuations and dormant IPO markets all contributed to this slowdown.
More recently, exit activity has stabilized with deal volumes flat for the last 5 quarters. Investors and companies are returning to the market and adjusting to the new normal of higher interest rates.
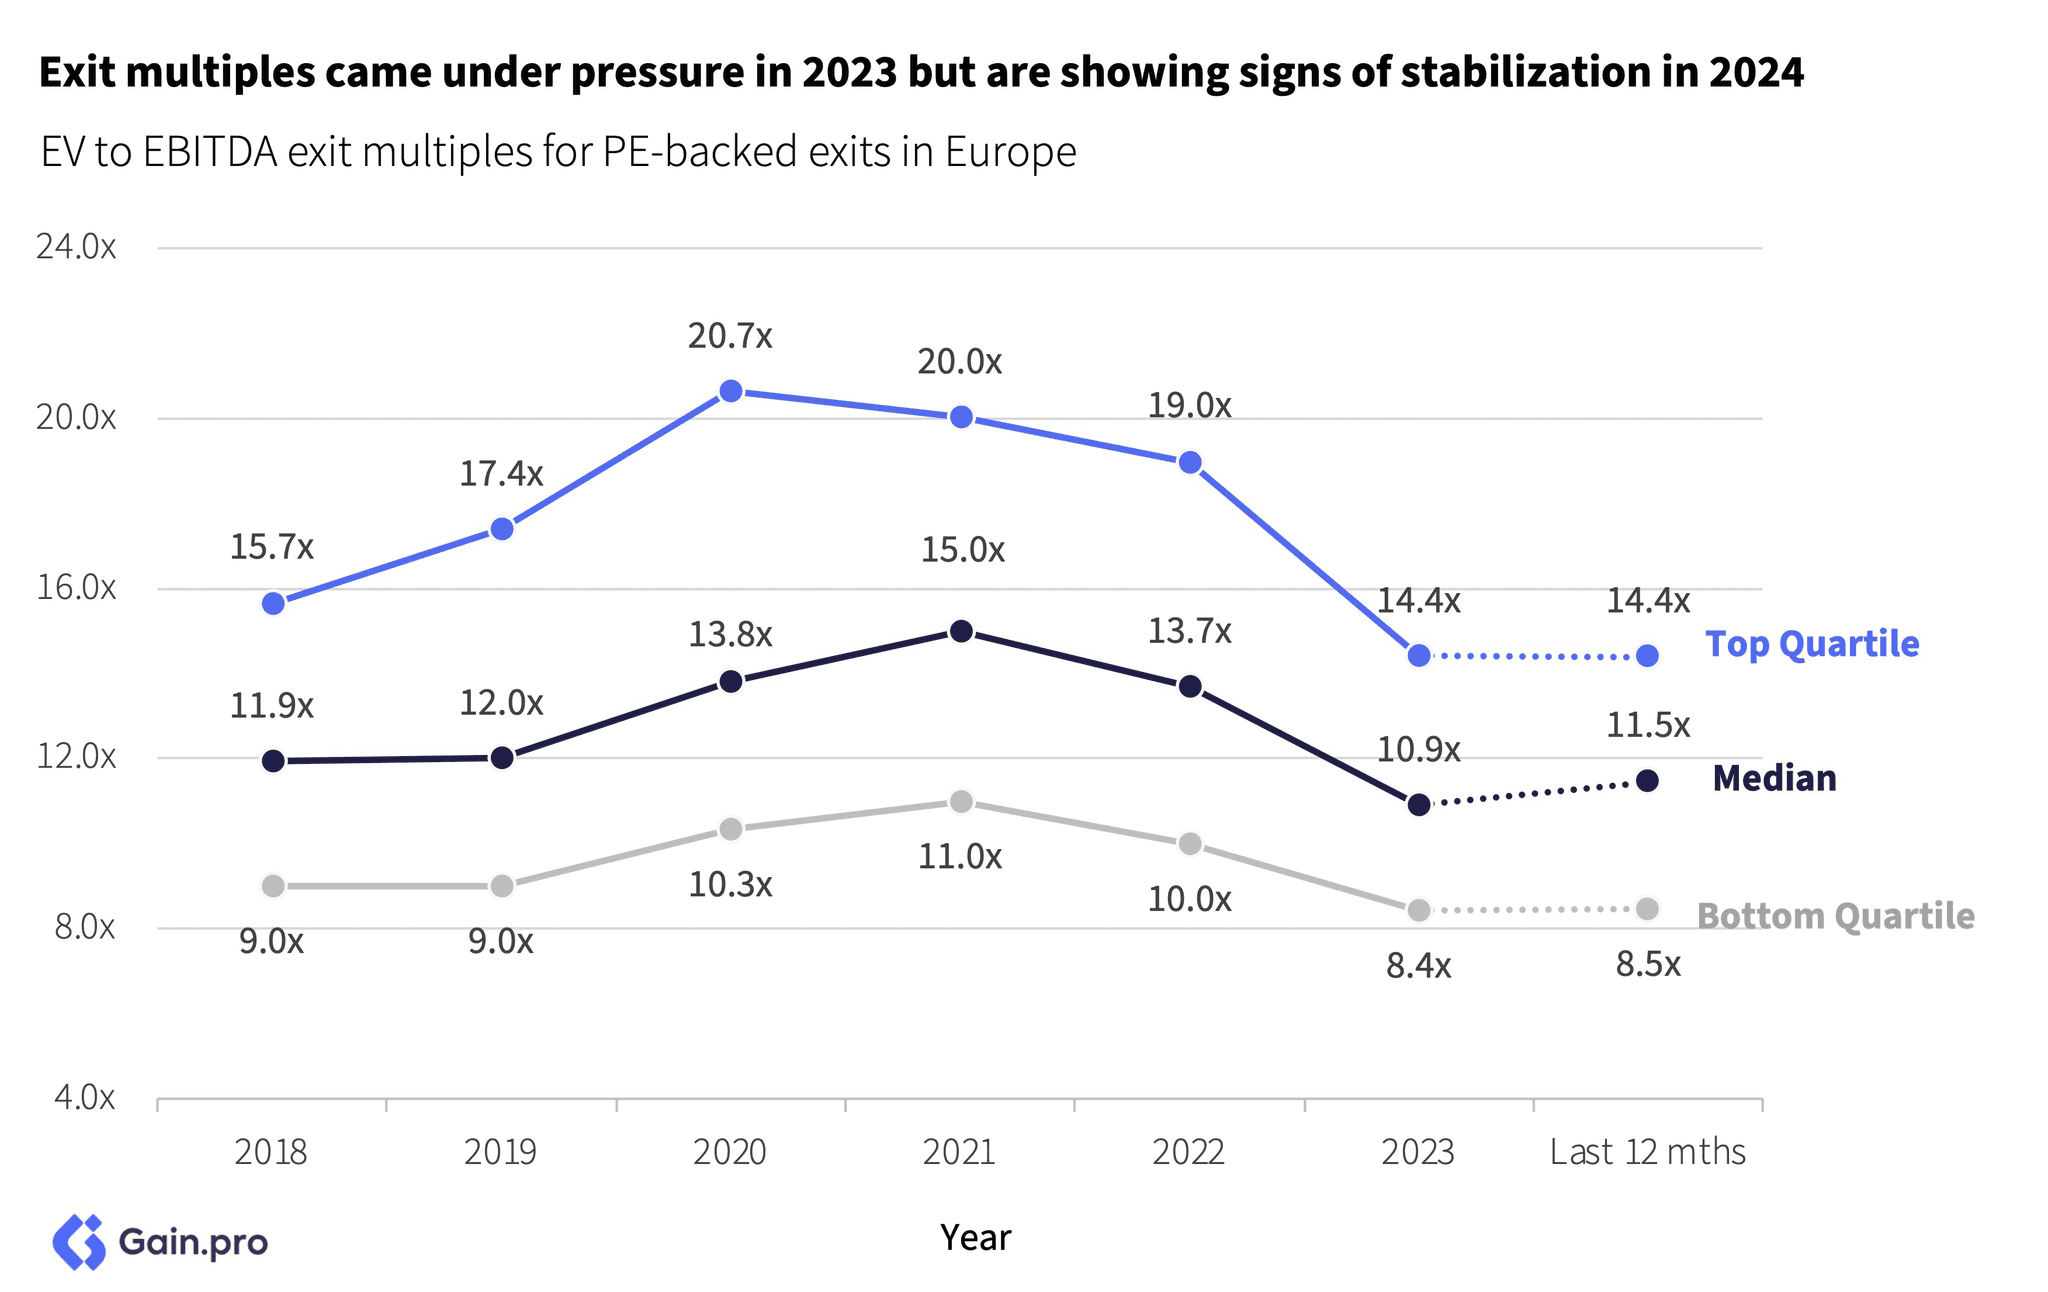
Exit multiples contracted sharply in 2023, down 20-30% from their peaks. The top quartile multiple saw greater variability compared to the median and bottom quartile. It seems like the market is hesitant to pay top dollar for even superior-quality assets.
Holding periods for assets that exited remain elevated and are at all-time highs. The average company that exited in 2024 spent 5.8 years in the portfolio compared to 4.9 years in 2020.
Roughly 55% of assets that exited in 2023/24 stayed longer than 5 years in the portfolio. Sellers remain reluctant to sell assets at lower prices. Longer holding periods also have a meaningful impact on performance metrics such as IRR and DPI.
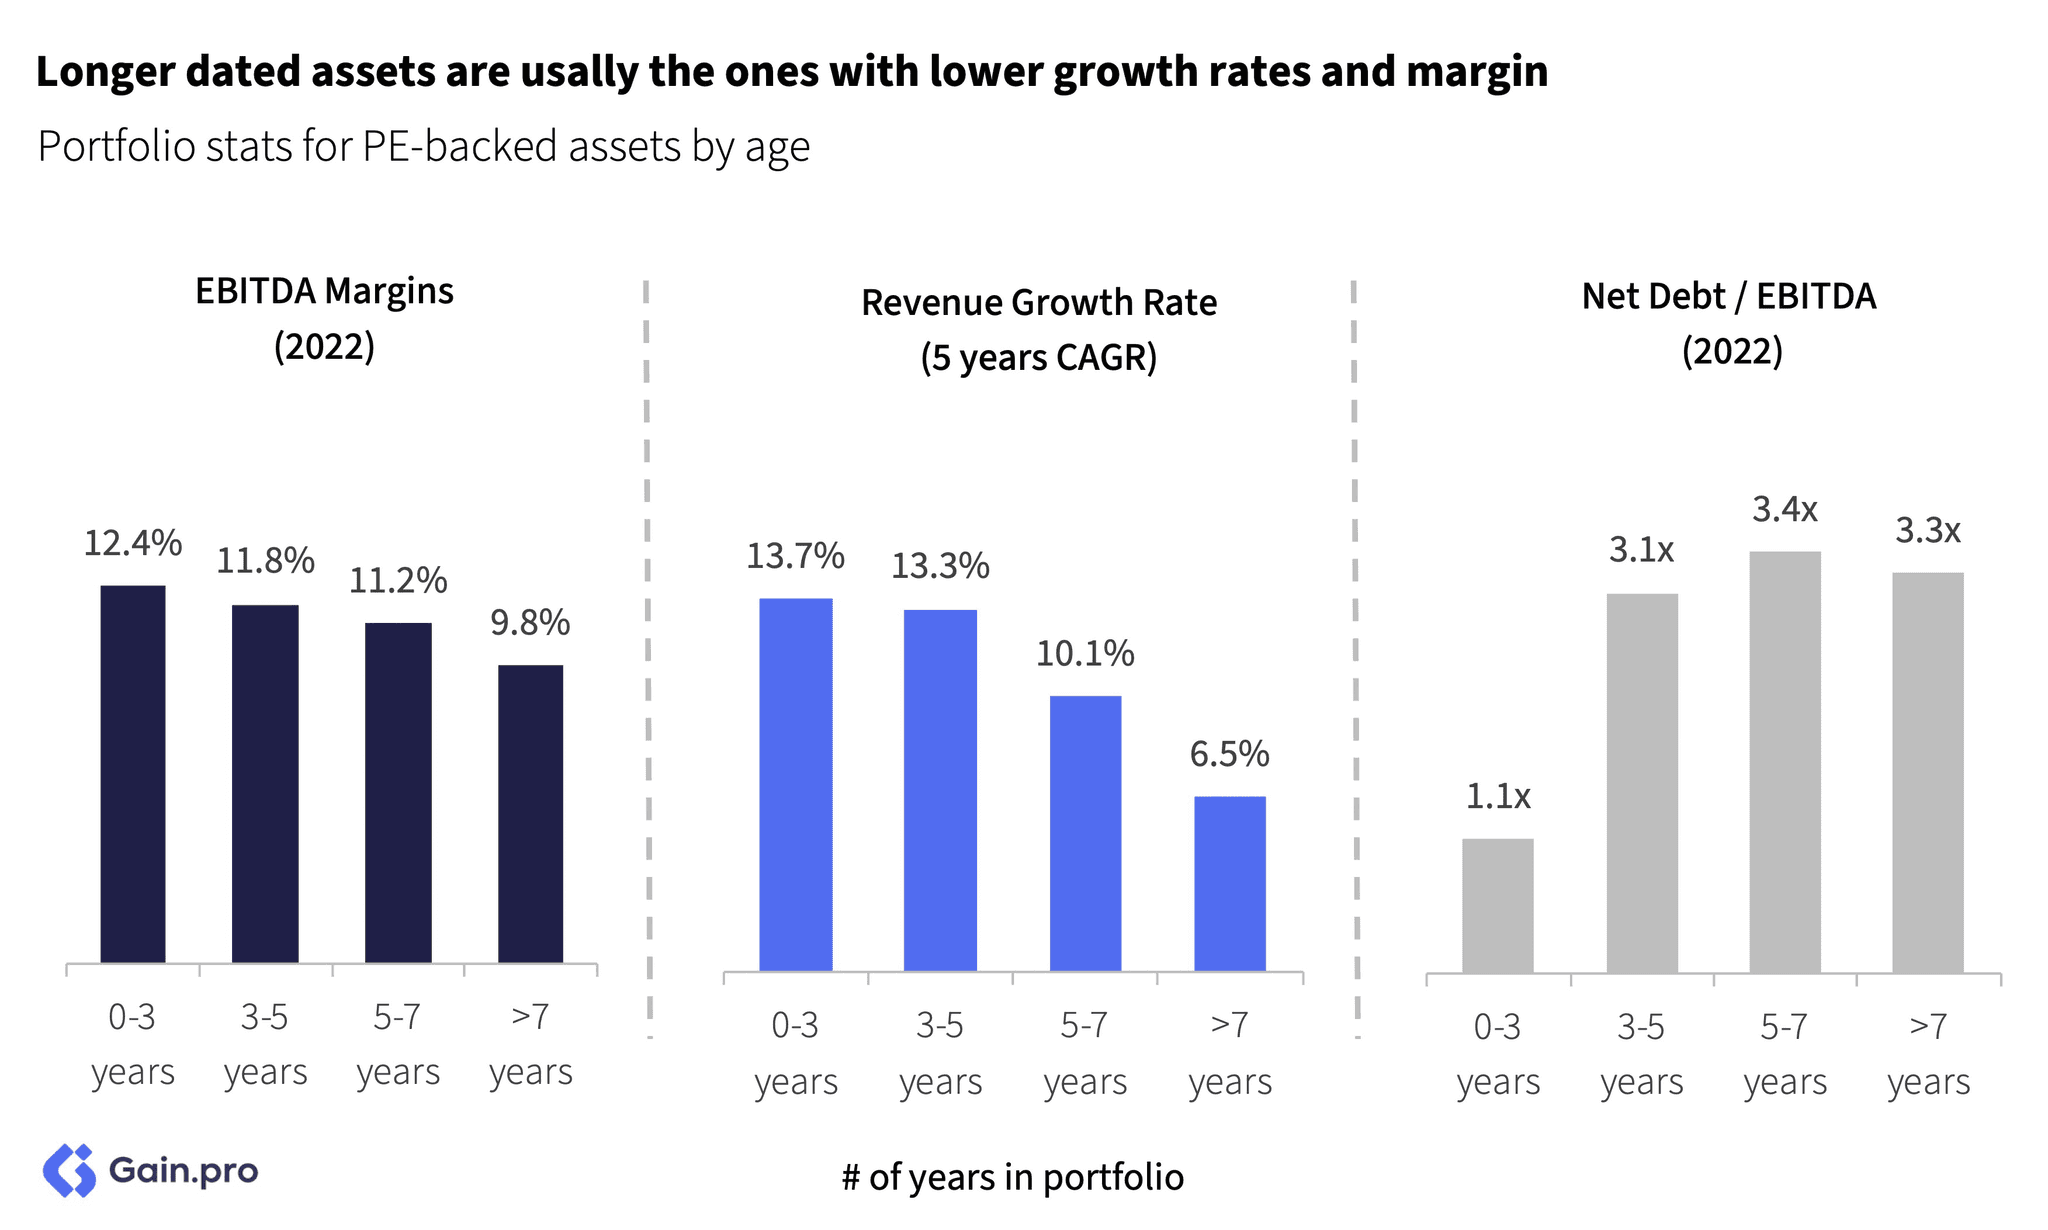
Selling some of those longer-dated assets might pose a challenge. These assets tend to remain unsold because of their slower growth rates and lower margins. Sponsors face a tough choice, whether to inject more capital to revive these businesses, sell them at a discount or potentially roll them over into a continuation vehicle if they see a lot of unrealized value.
If we look at exits by type, the share of strategic exits is rising. They now make up for 48% of all exits, up from 33% in 2018. The current environment favors strategic buyers. They finance acquisitions mostly via their balance sheet and are therefore less dependent on debt markets. Lastly, note how we are still in an IPO winter as we saw limited activity in 2022 and 2023.
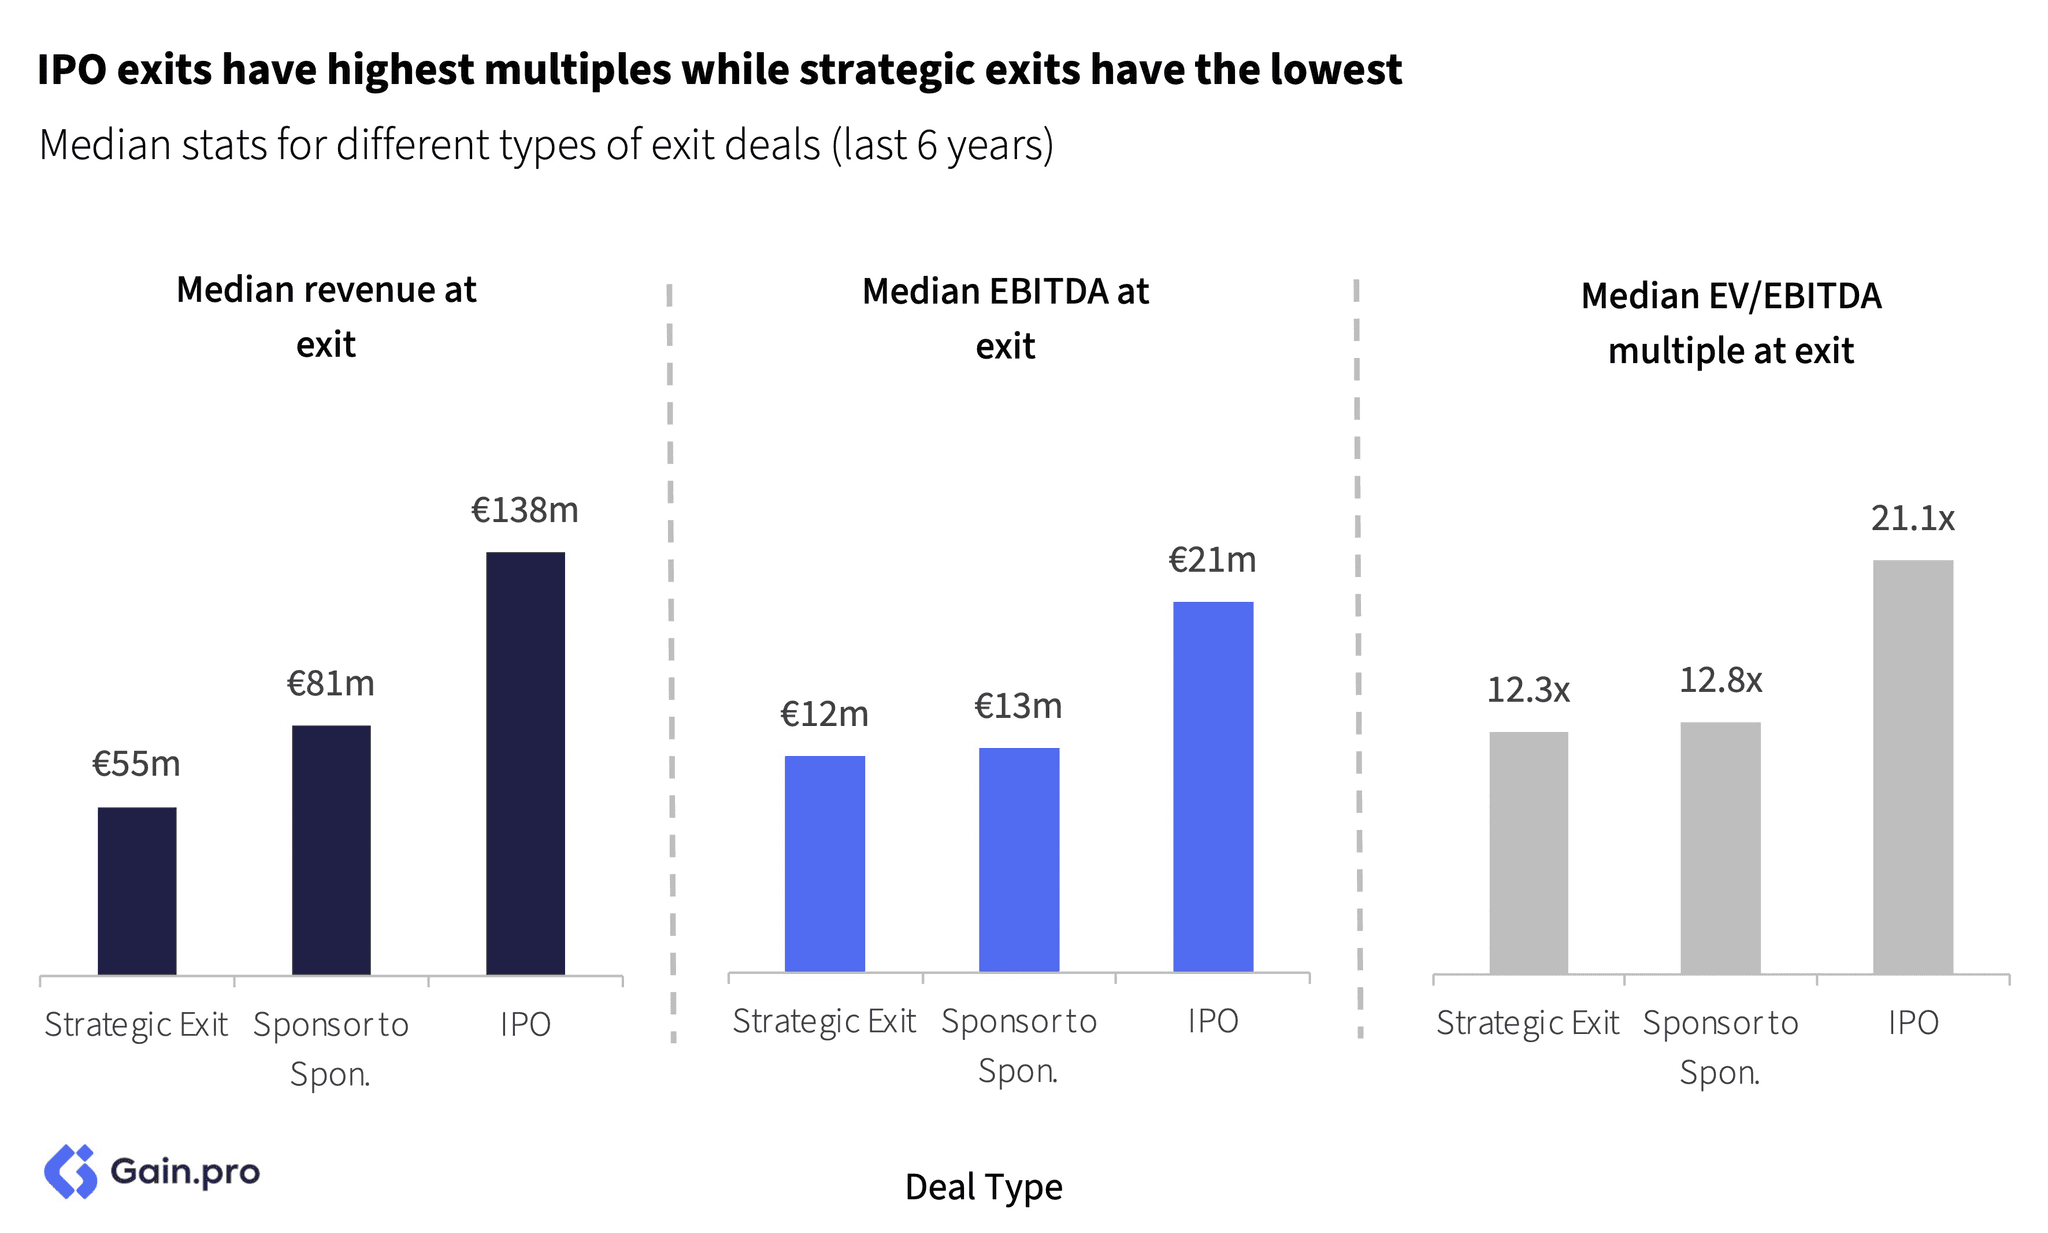
IPO exits are often characterized by high multiples. They are the most suitable choice for large exits, with median revenue at exit being €138m. Both strategic exits and sponsors-to-sponsor exits are roughly similar in size and multiple.
Exits by Sector
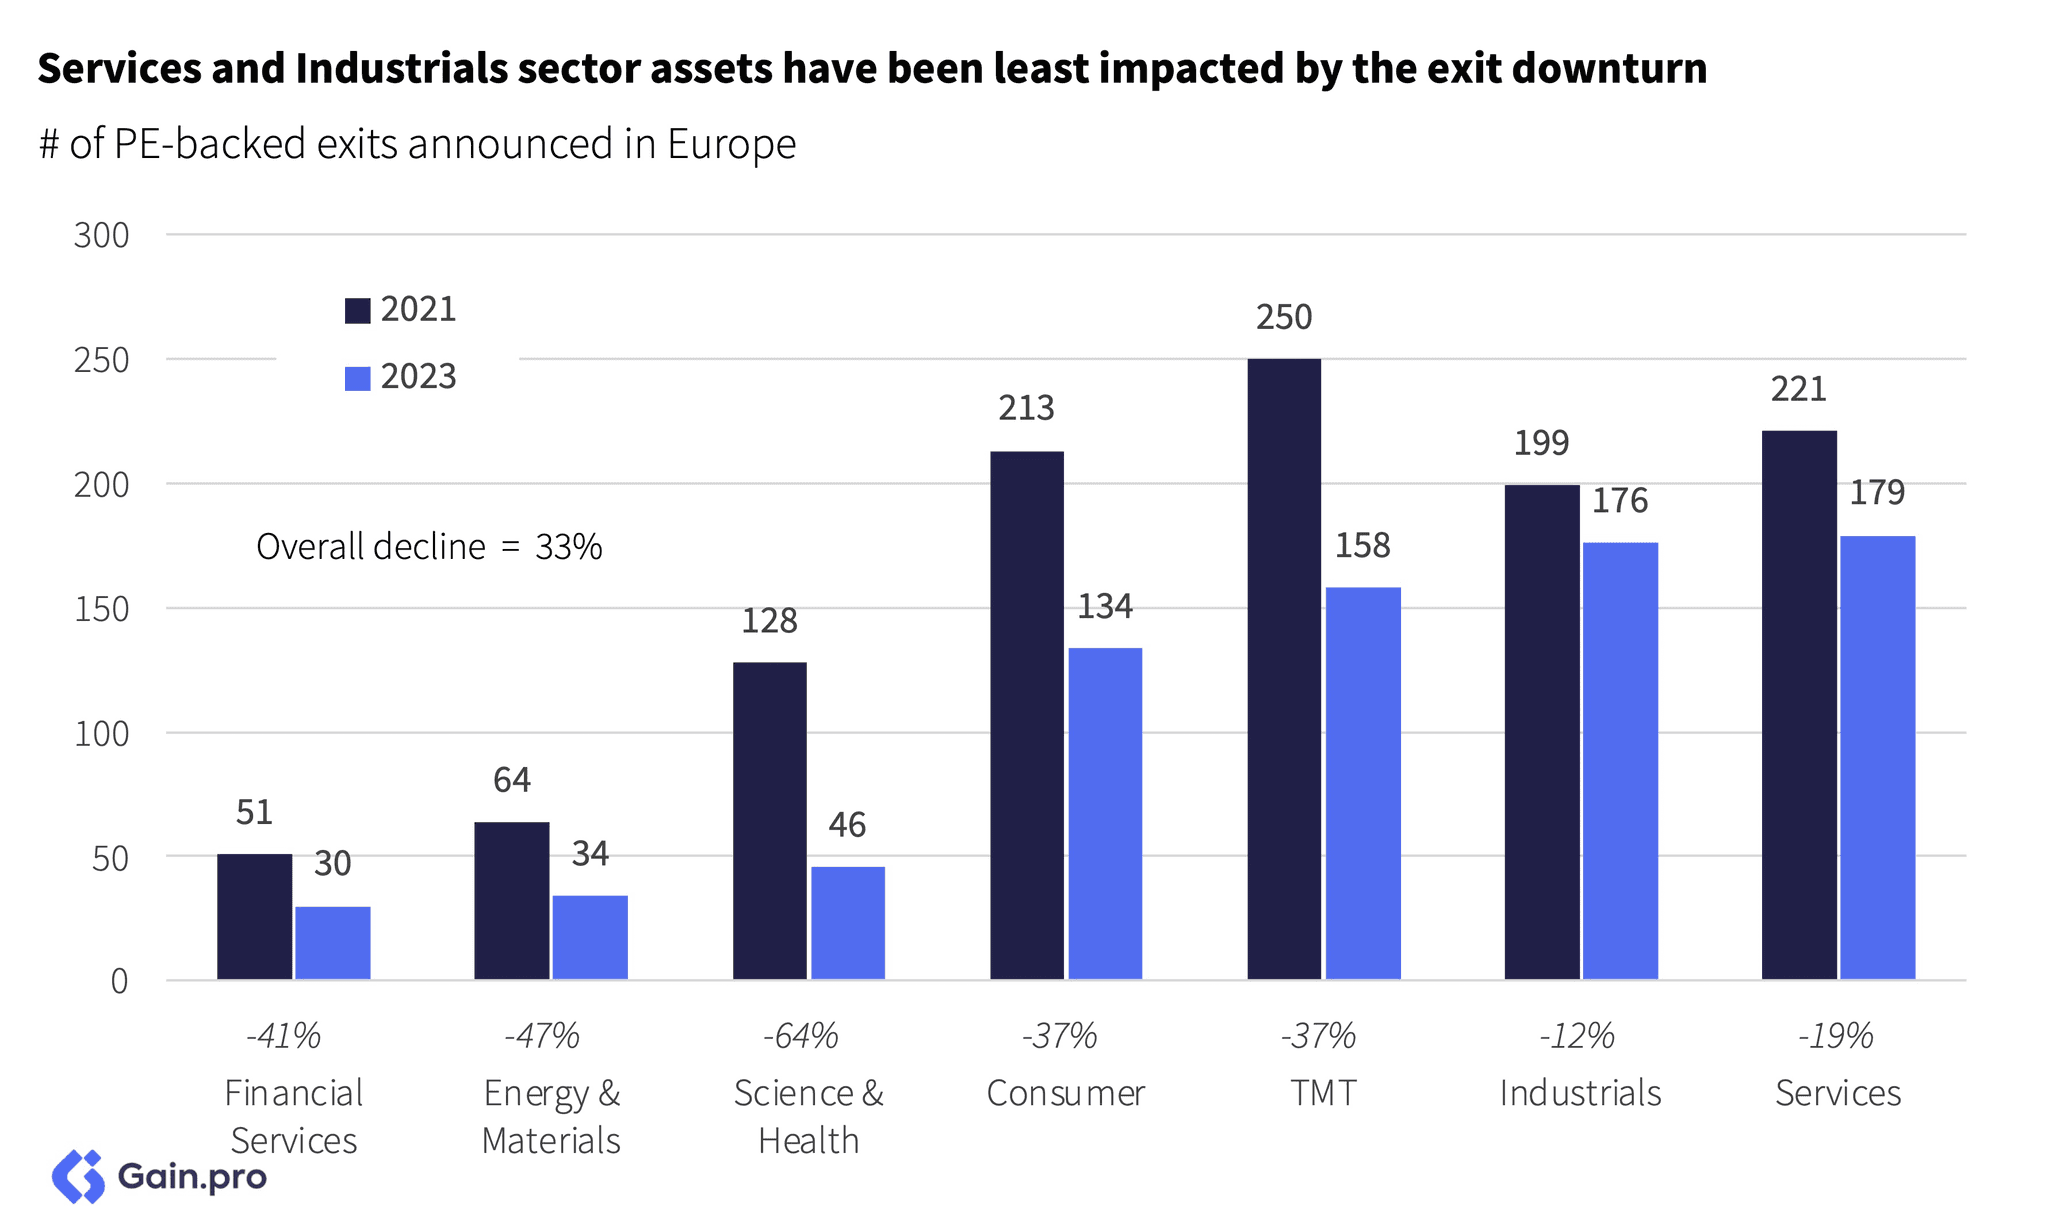
Services and Industrial assets have been least impacted by the exit downturn. Investors looked for stability in traditional sectors as the market remained uncertain.
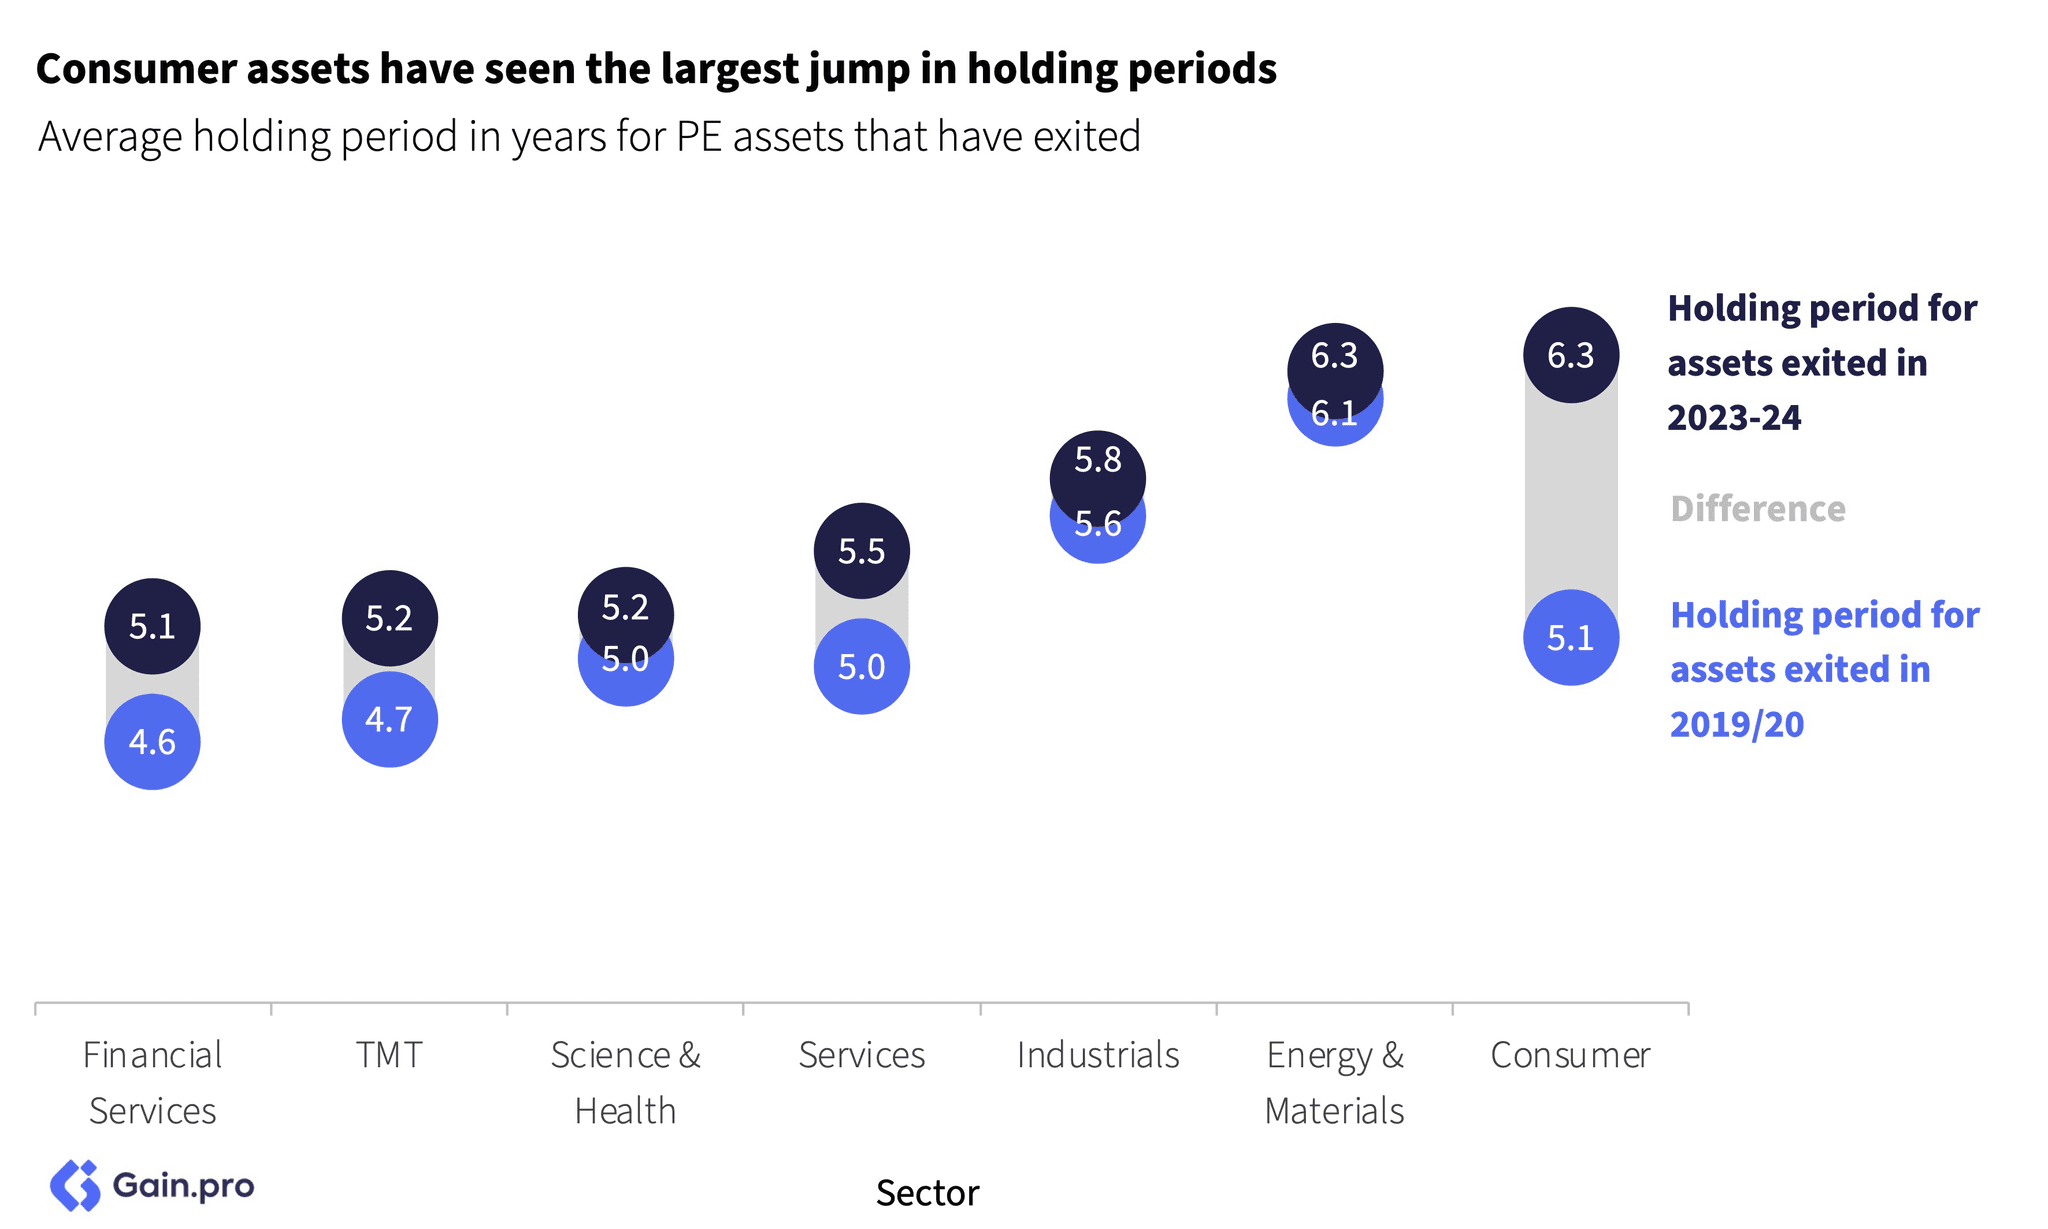
Consumer assets have seen the largest jump in holding periods. On average it takes a Consumer asset 6.3 years to exit. Assets in Energy & Materials (6.3 years) and Industrials (5.8 years) are also characterized by long holding periods. These sectors were among the hardest hit from pandemic-driven supply chain disruptions. On the other side, Financial Services and TMT assets have the lowest holding periods.
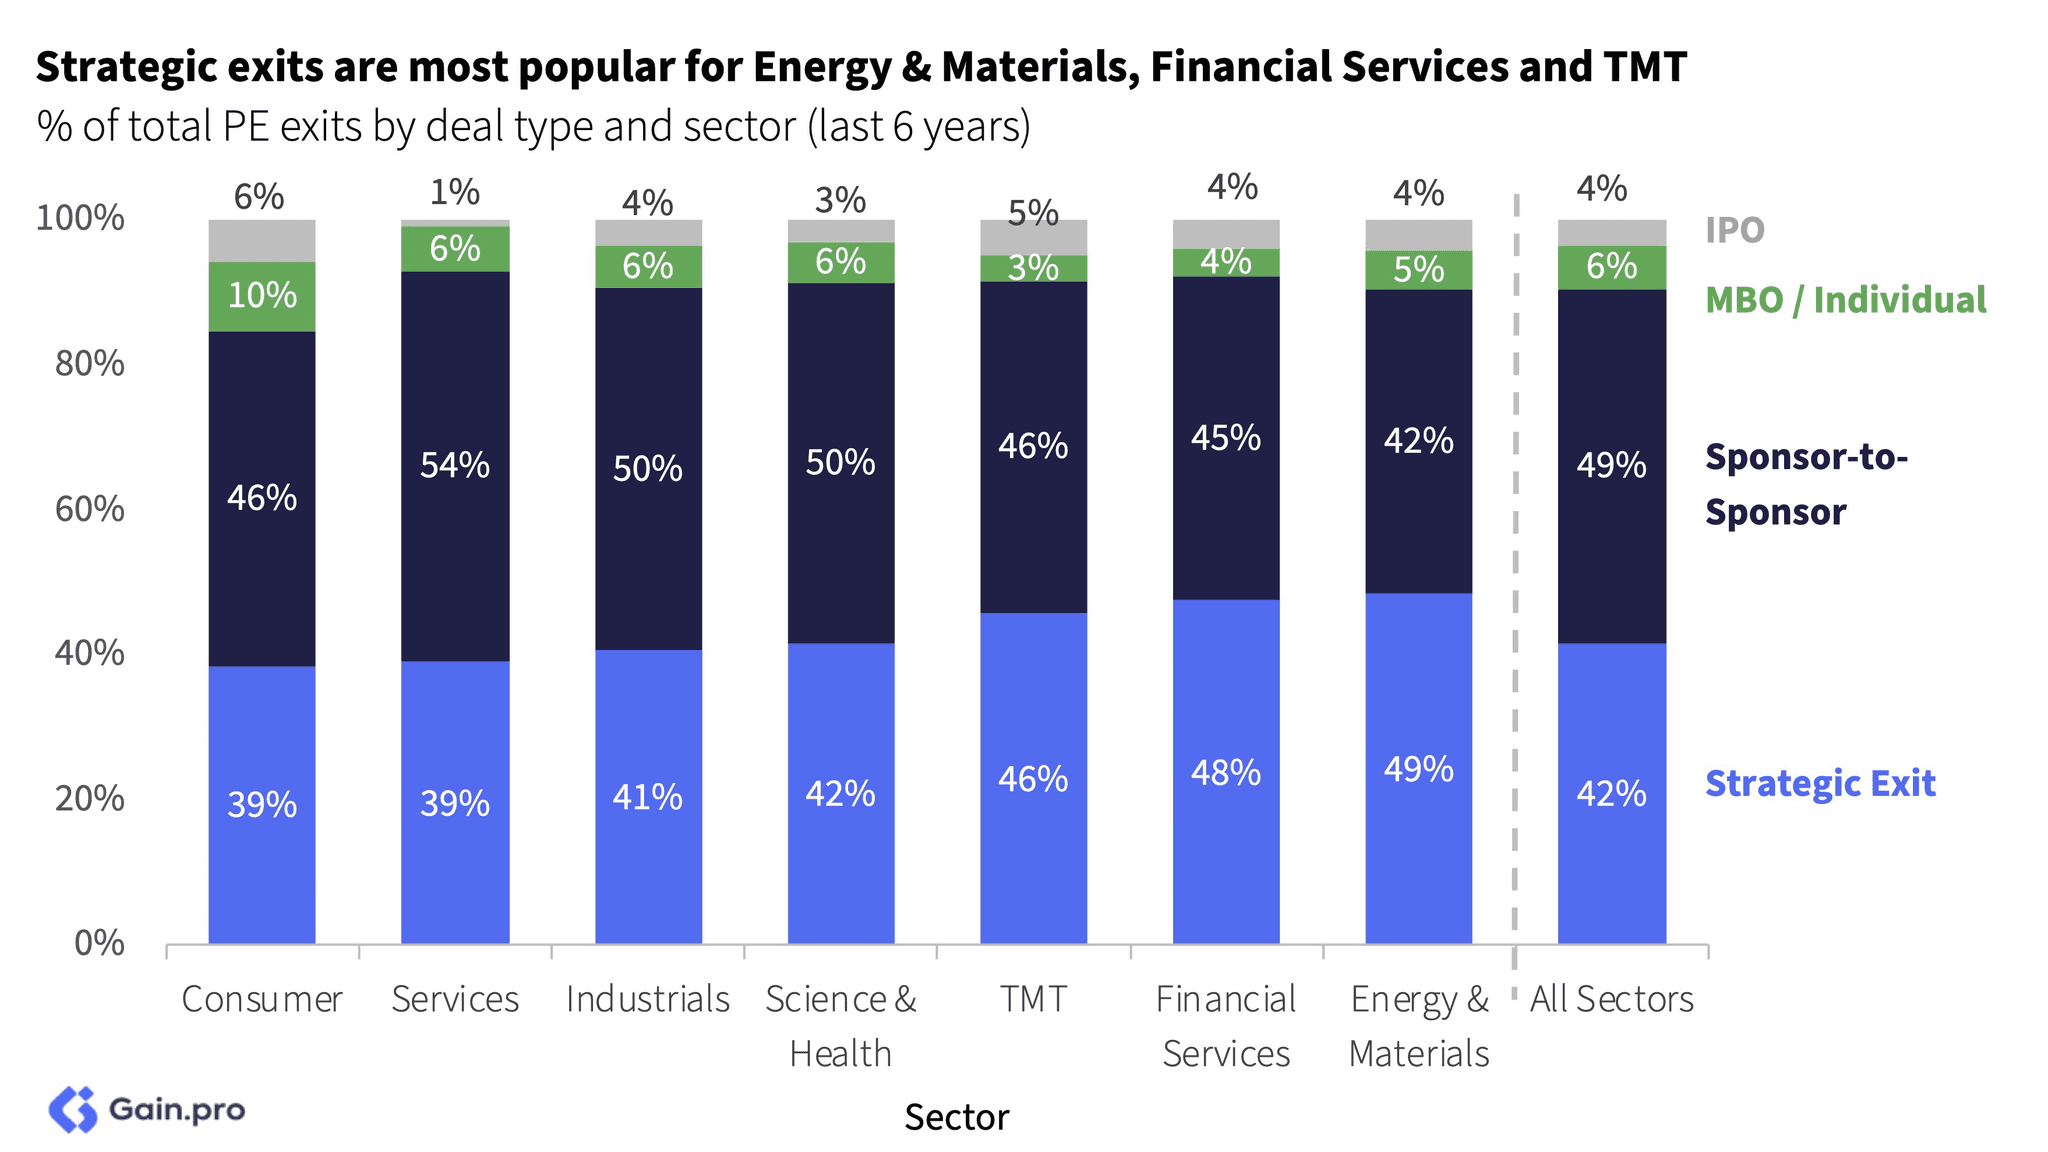
Strategic exits are more common in the Energy & Materials and Financial Services sectors, while sponsor-to-sponsor deals are more prevalent in the Services sector. Consumer and TMT have more IPOs compared to other sectors.
Exit multiples are highest in TMT followed by Science & Health. Both TMT and Science & Health rank among the fastest-growing, most resilient sectors and those with highest EBITDA margin. In contrast, slow-growing and asset-heavy Industrials and Energy & Materials sectors often have lower multiples.
Exits by Region
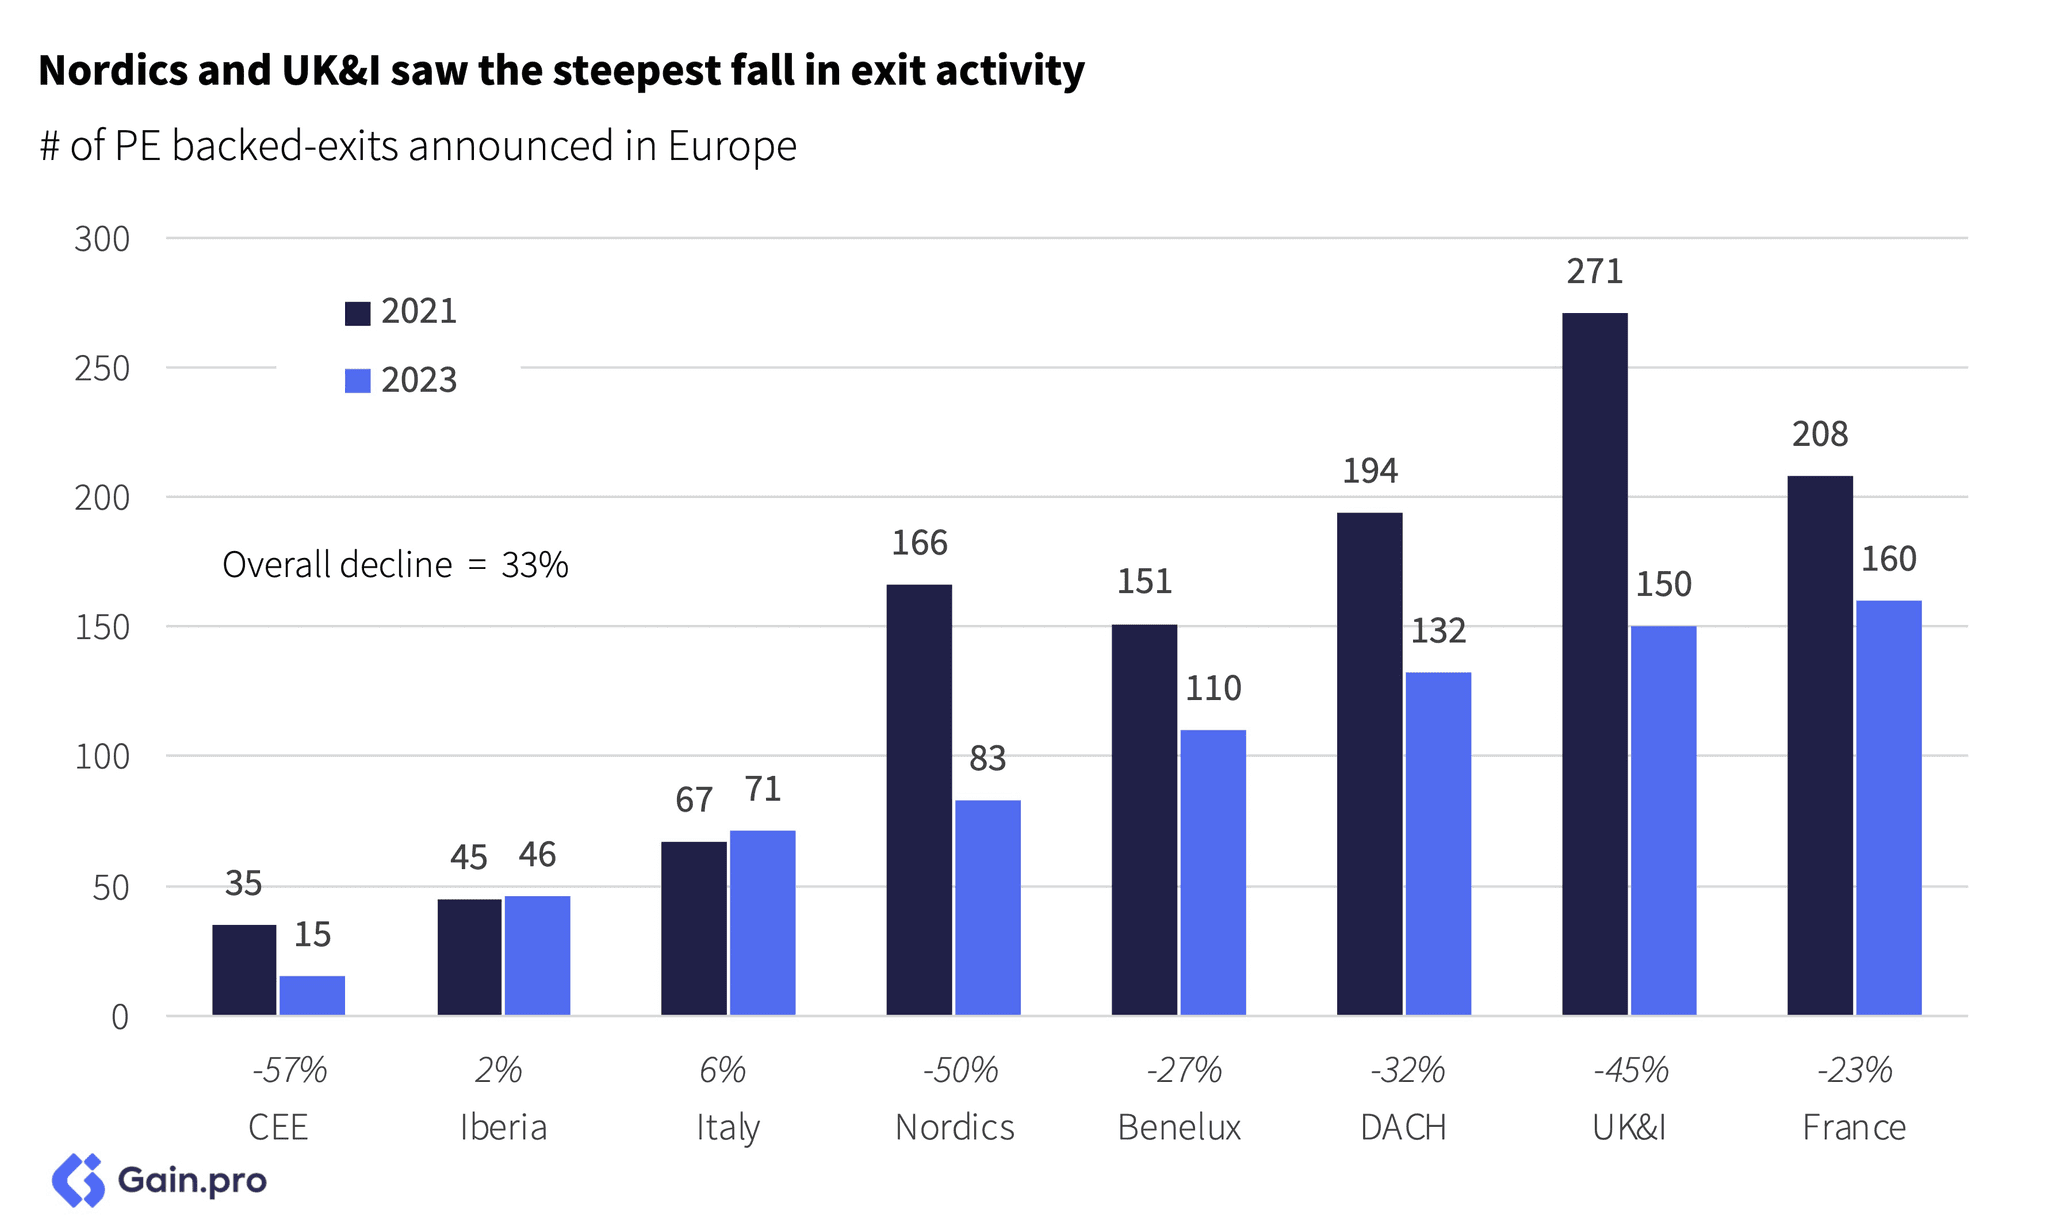
Nordics and UK&I saw the steepest decline in exit activity. They were among the regions that saw the biggest increase in 2021, so, understandably, activity is mean reverting. Exit activity in Italy and Iberia is a bright spot, increasing year-over-year and well above their pre-pandemic highs.
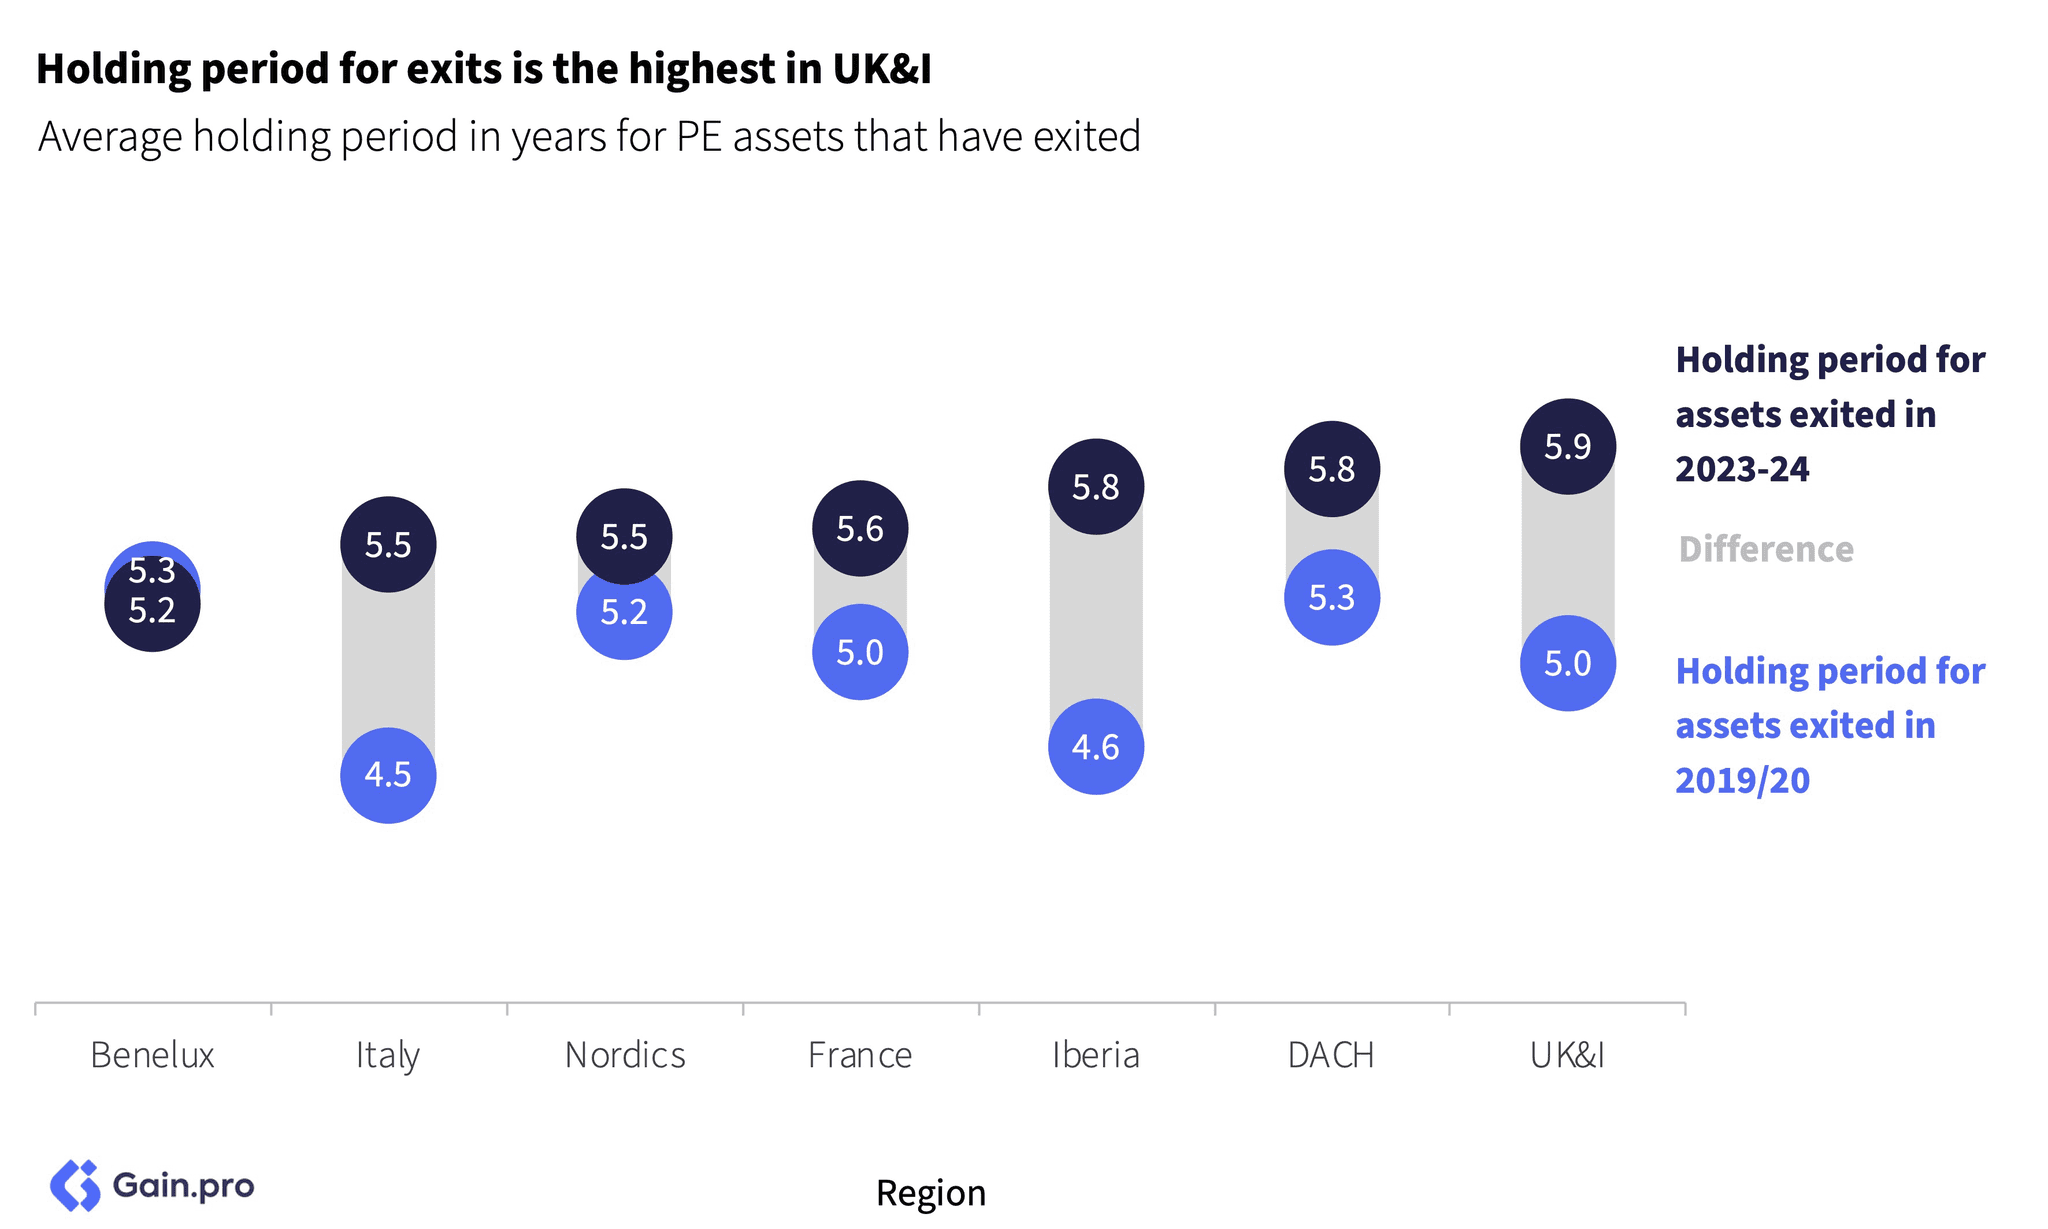
The holding period for exits is the highest in UK&I. On average, it takes 6 years for a business from entry to exit. In comparison, markets like Benelux are slightly faster moving with an average holding period of 5.2 years which remains unchanged compared to pre-pandemic levels.
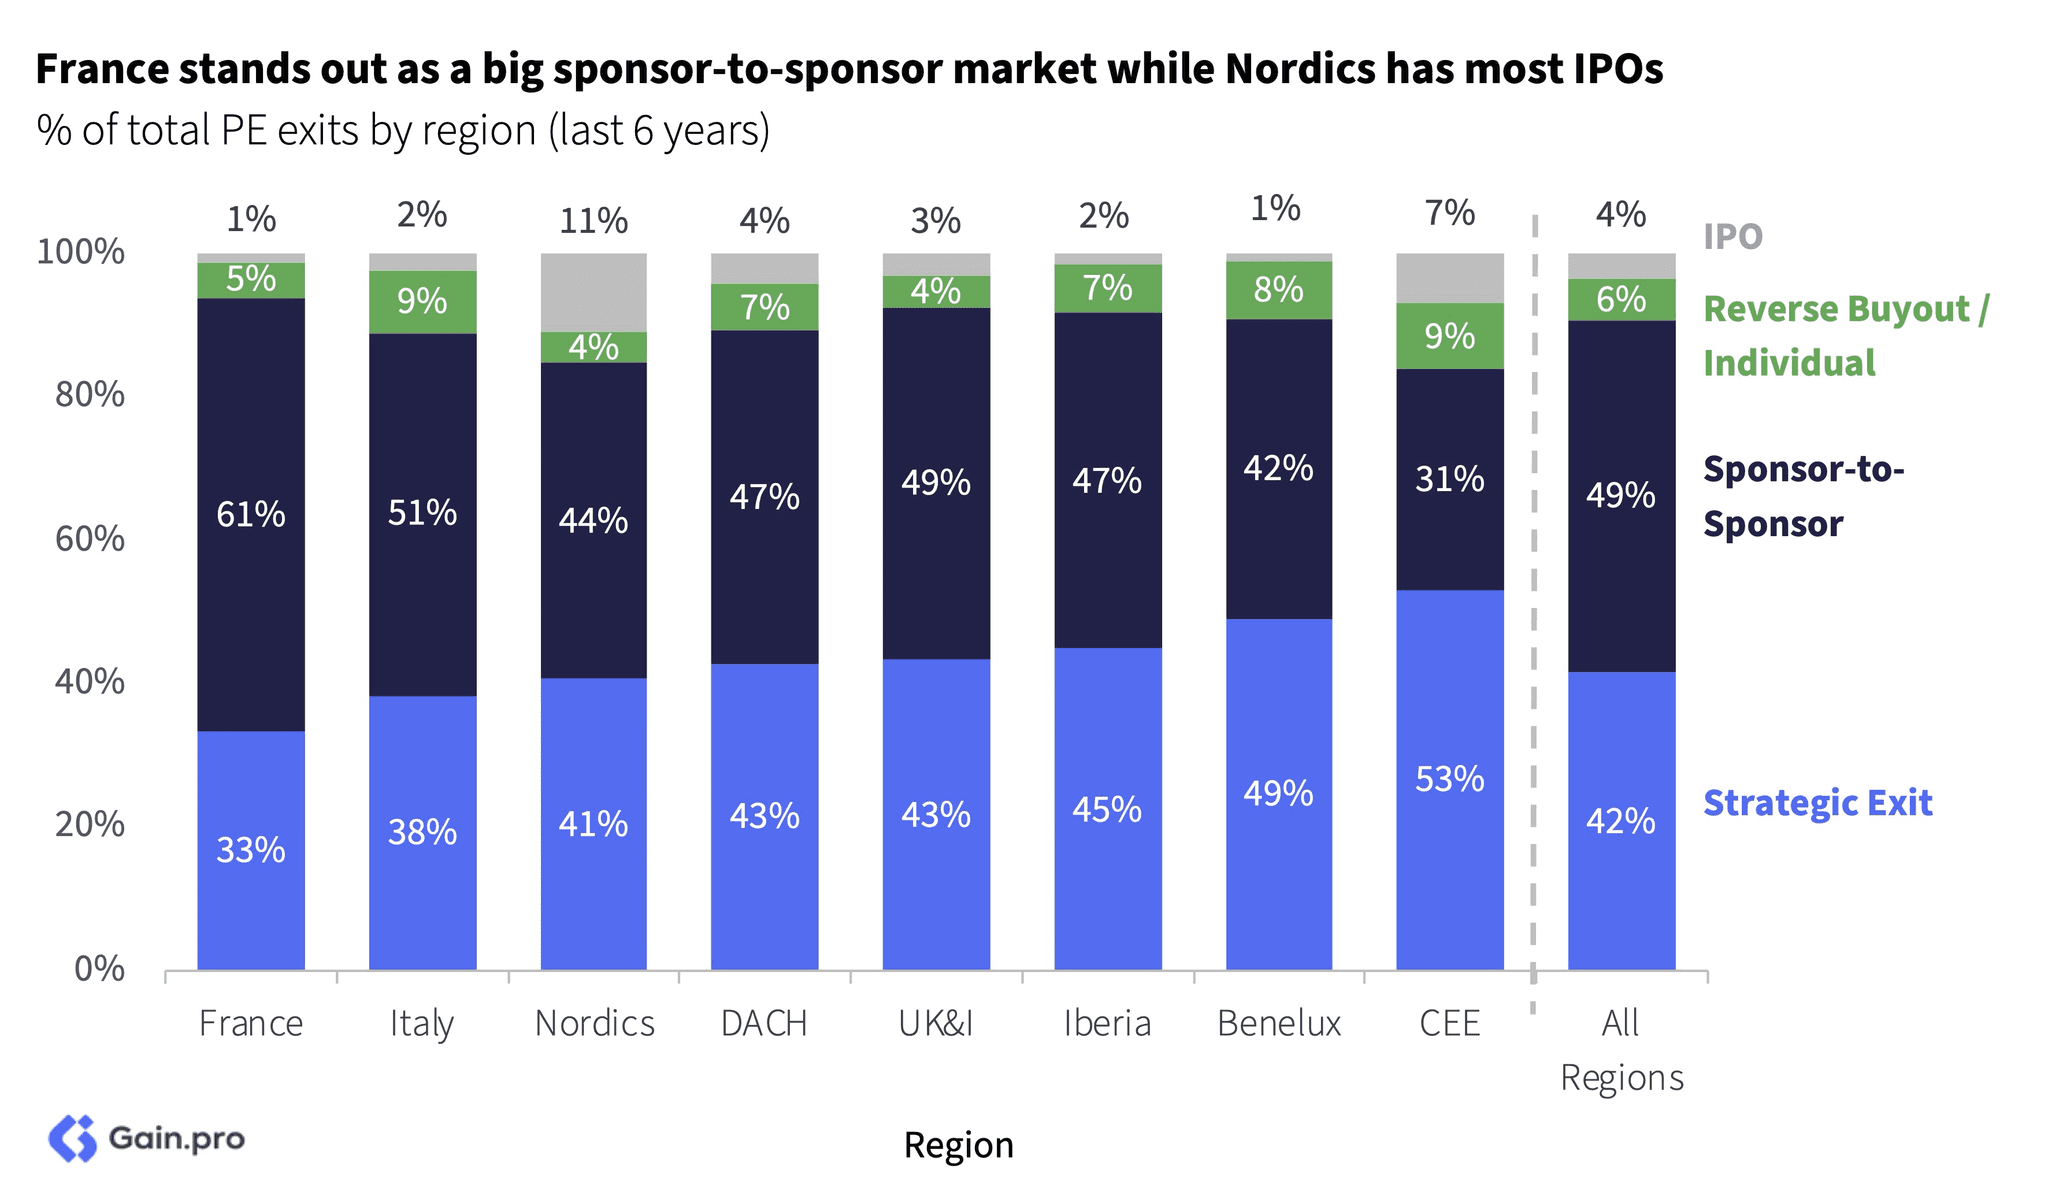
If we look at the exit types by region, France stands out with 61% of exits in the region being sponsor-to-sponsor. France has one of the highest PE penetration rates in Europe and the highest share of minority investors. As a result it sees many investor-to-investor deals. Nordic regions lead Europe in terms of IPOs owing to strong investor demand, favorable floating regulations and a thriving tech sector.
Nordics also boasts the highest multiples at exit. Nordic assets are among the fastest-growing PE assets in the Tech and Services sectors, coupled with a high share of IPOs, no surprise exit multiples are higher. In contrast, more Industrials-heavy markets like France and Italy have lower multiples.
Chapter 04: Portfolio Stats
Revenue Growth
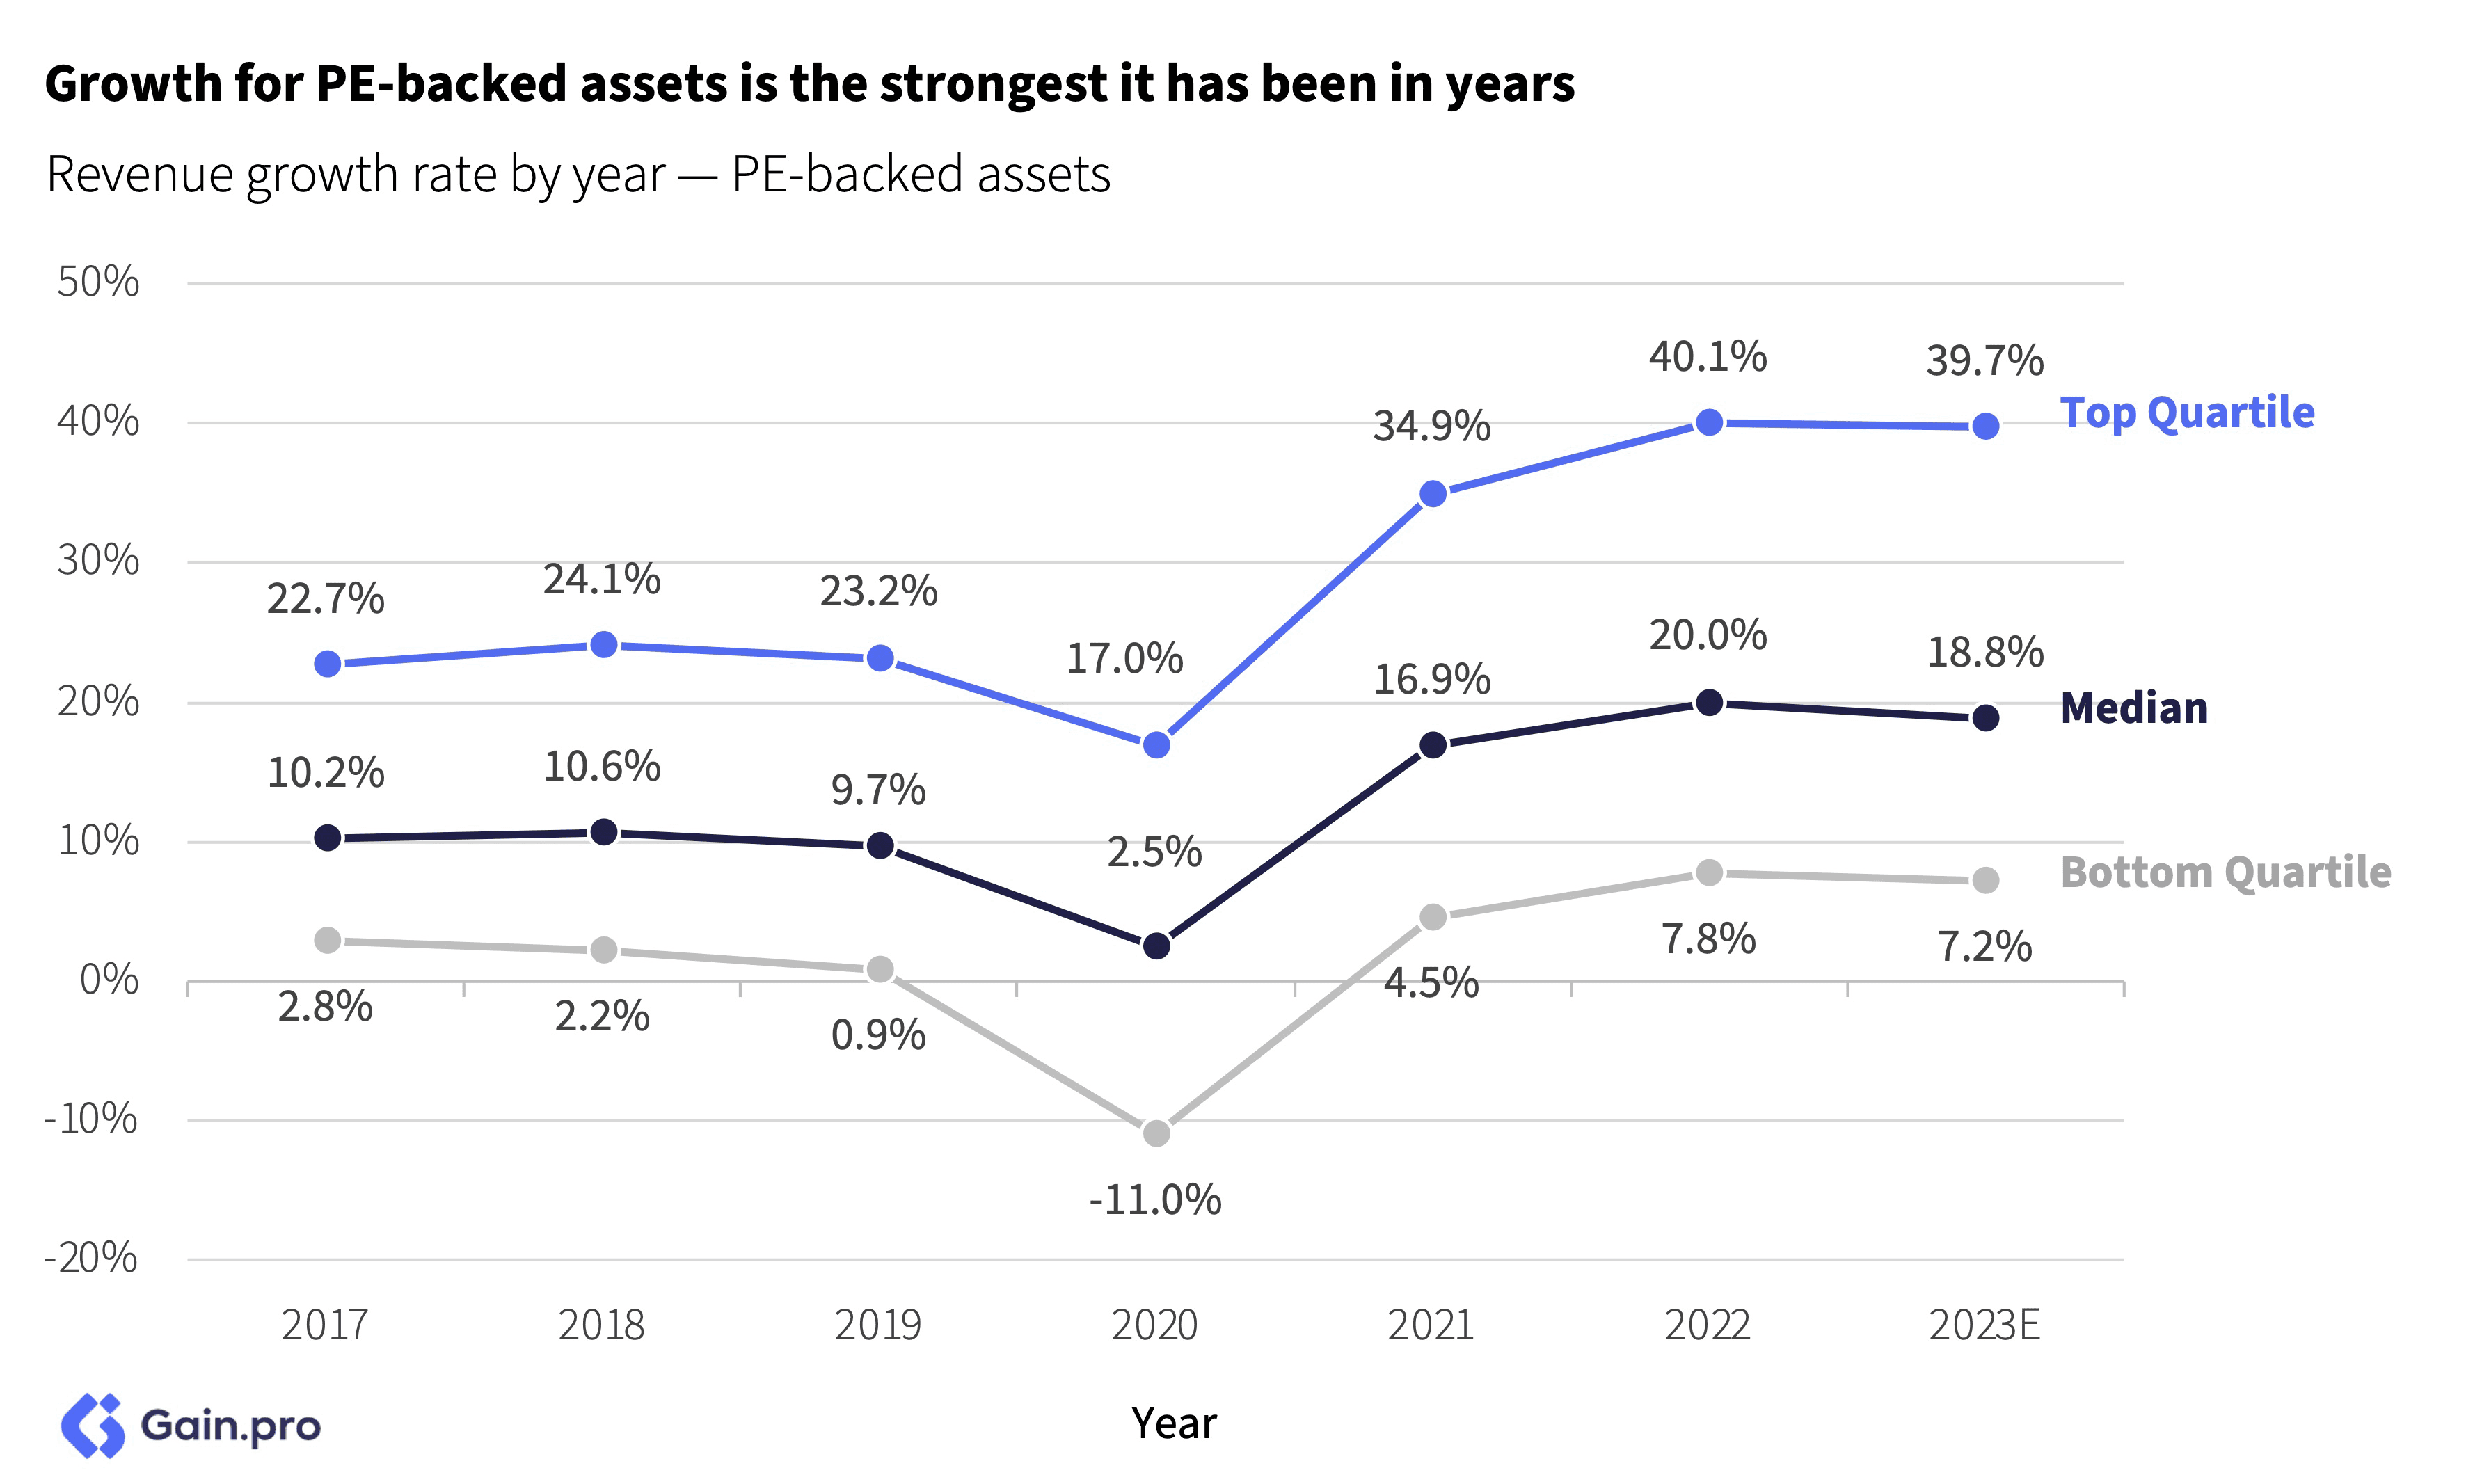
Growth for PE-backed assets is the strongest it has been in years. On average, PE-backed assets grew 18.8% YoY in 2023, well above their pre-pandemic averages. Over the last 5 years, the median PE business had a CAGR of 13.8%.
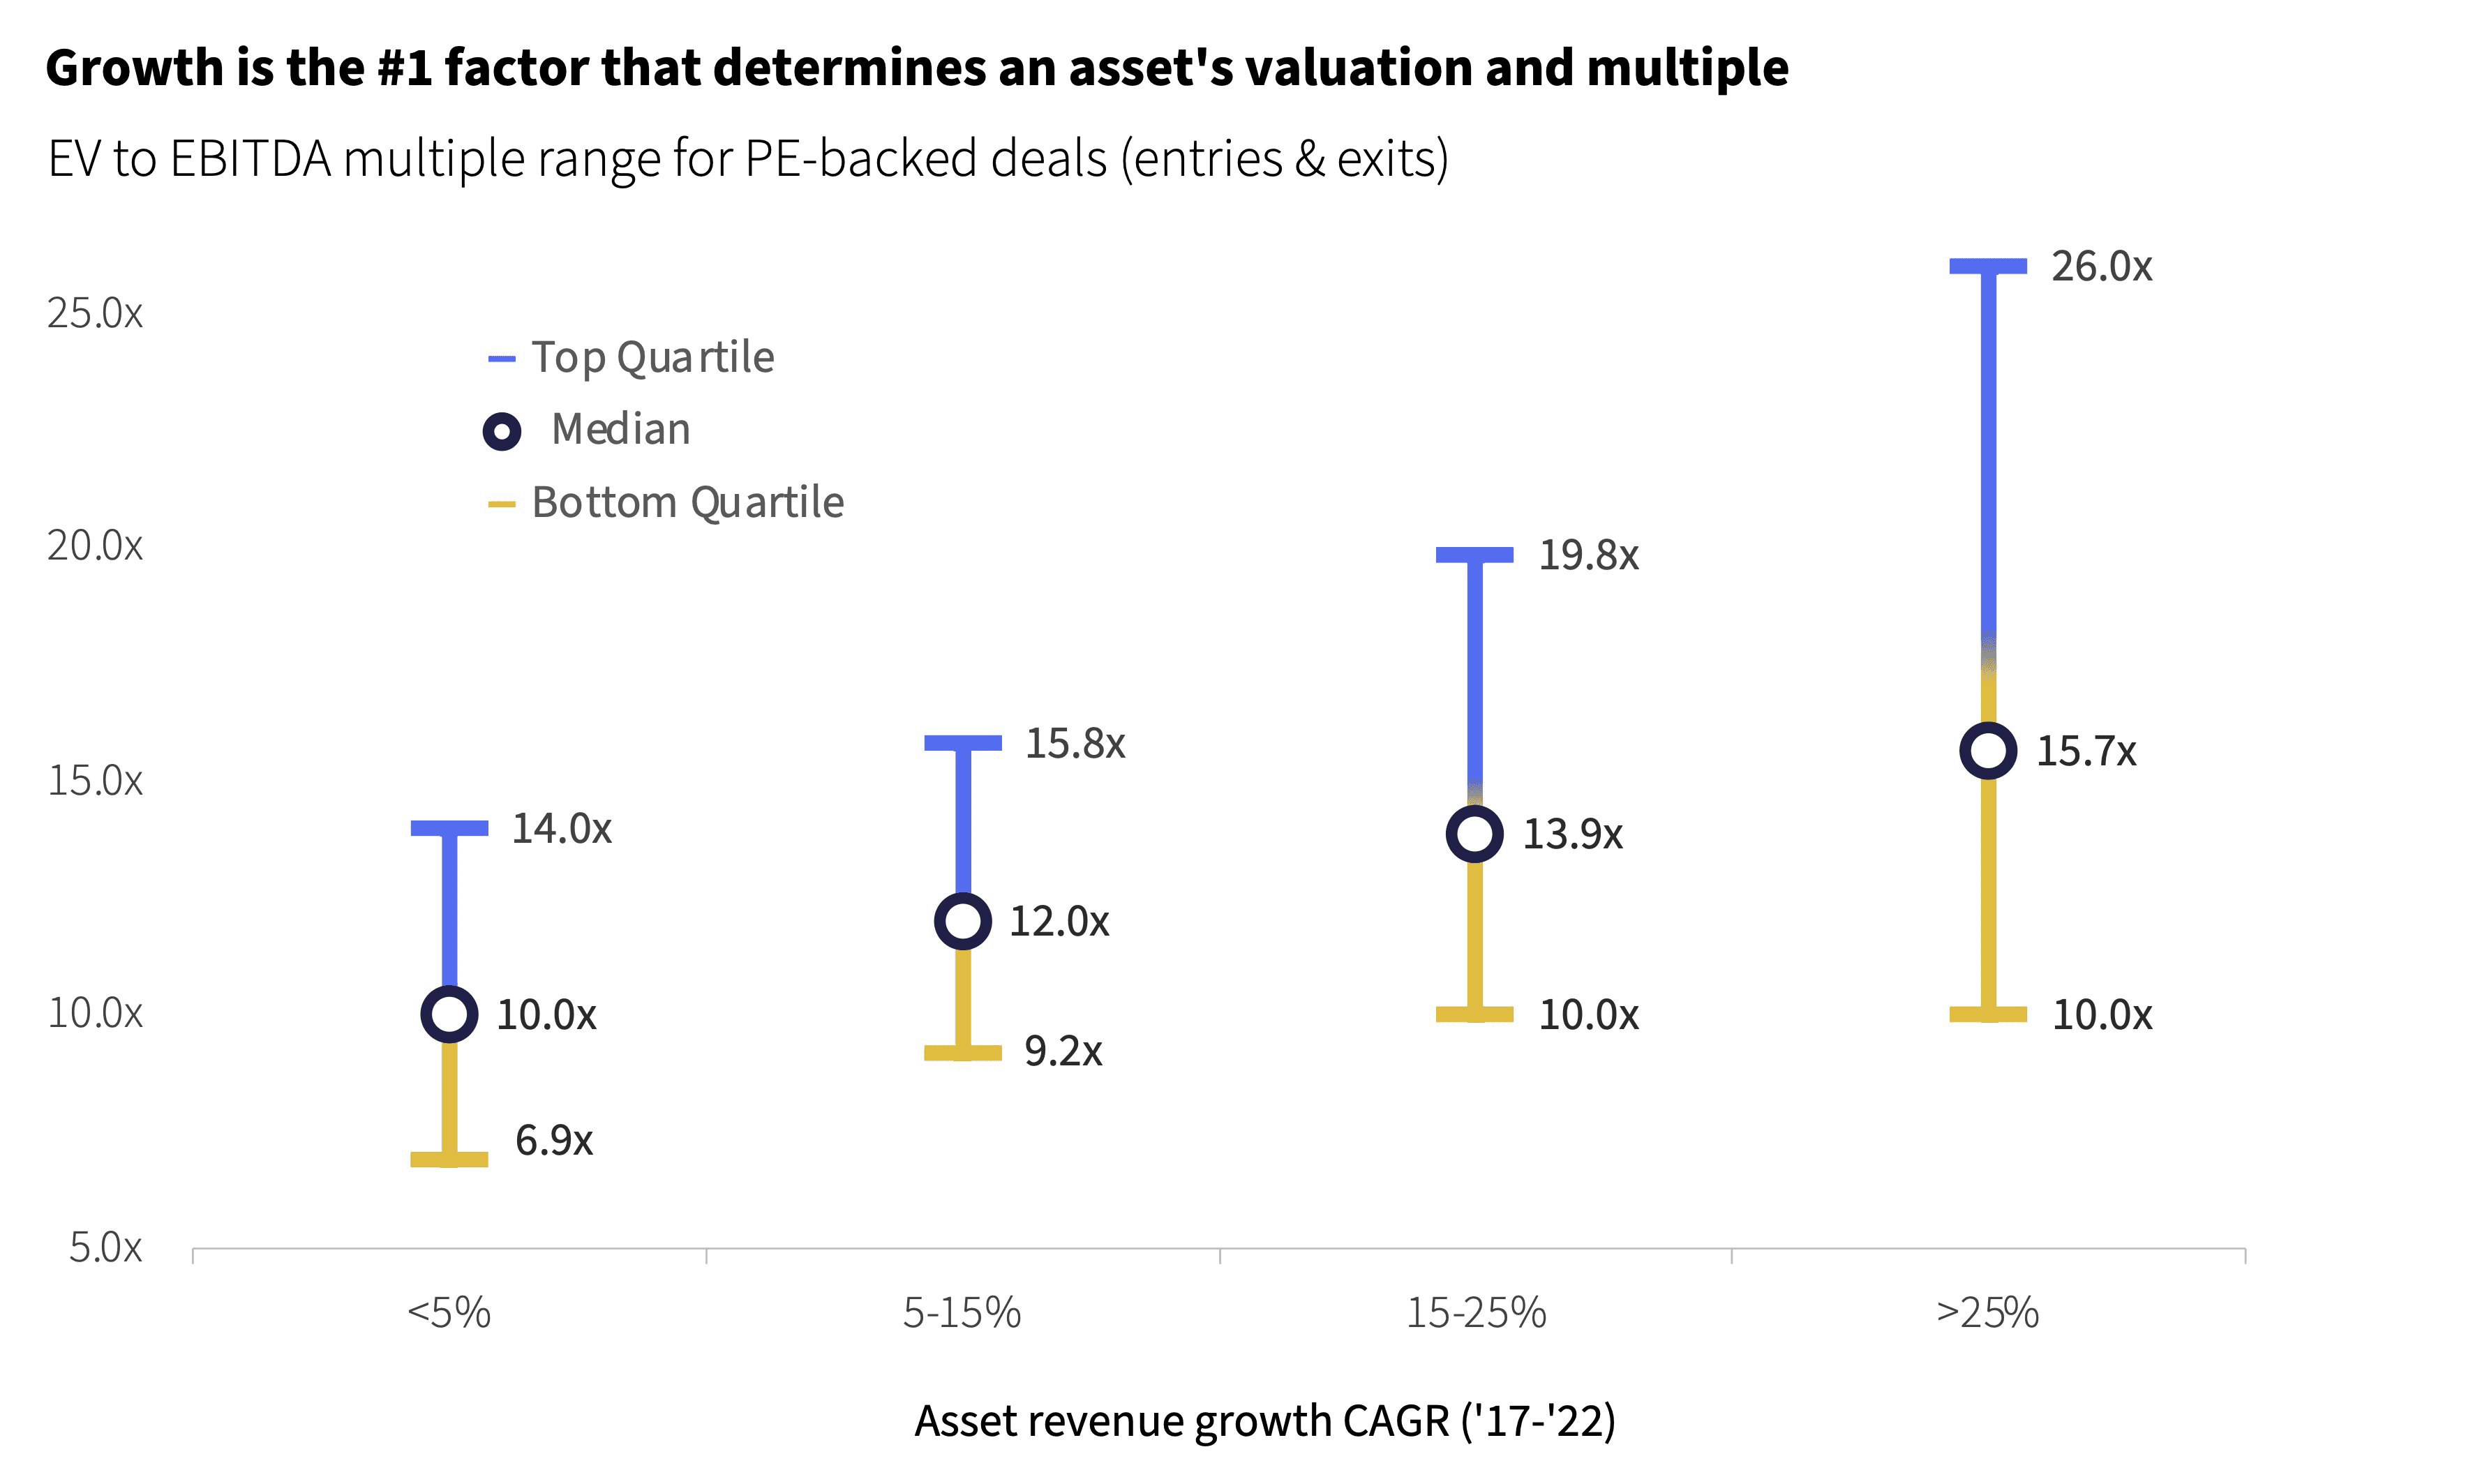
It should come as no surprise that growth is the #1 factor that determines an asset’s valuation and its multiple. Assets that grow faster (>25% revenue CAGR) sell at a 50% premium to those that grow slower (<5% revenue CAGR).
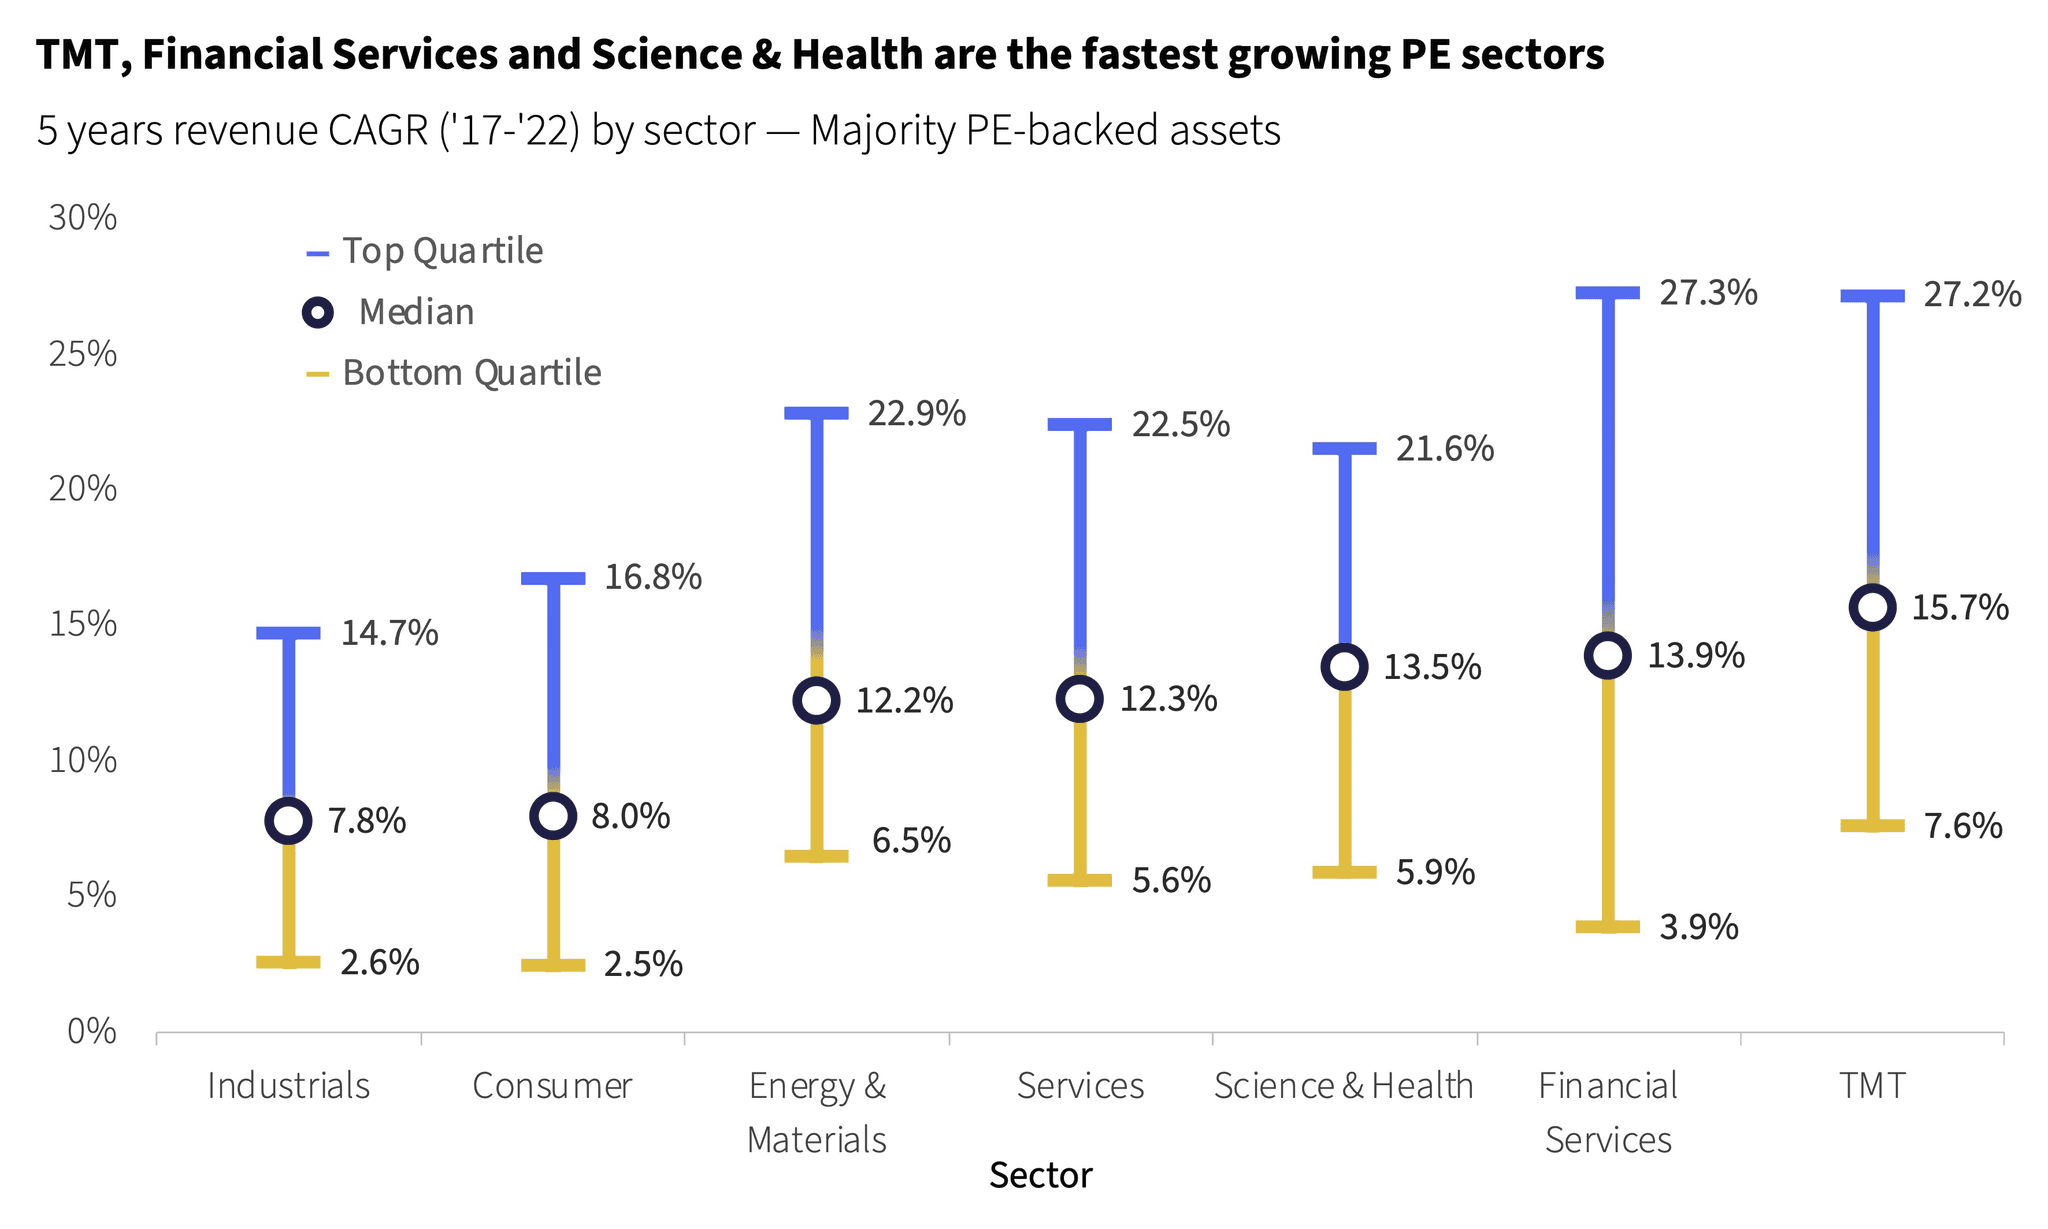
TMT, Financial Services and Science & Health are the fastest-growing sectors for PE-backed assets, while Consumer and Industrials lag behind. In addition to underlying growth, the three fastest-growing sectors are also characterized by above-average buy-and-build activity.
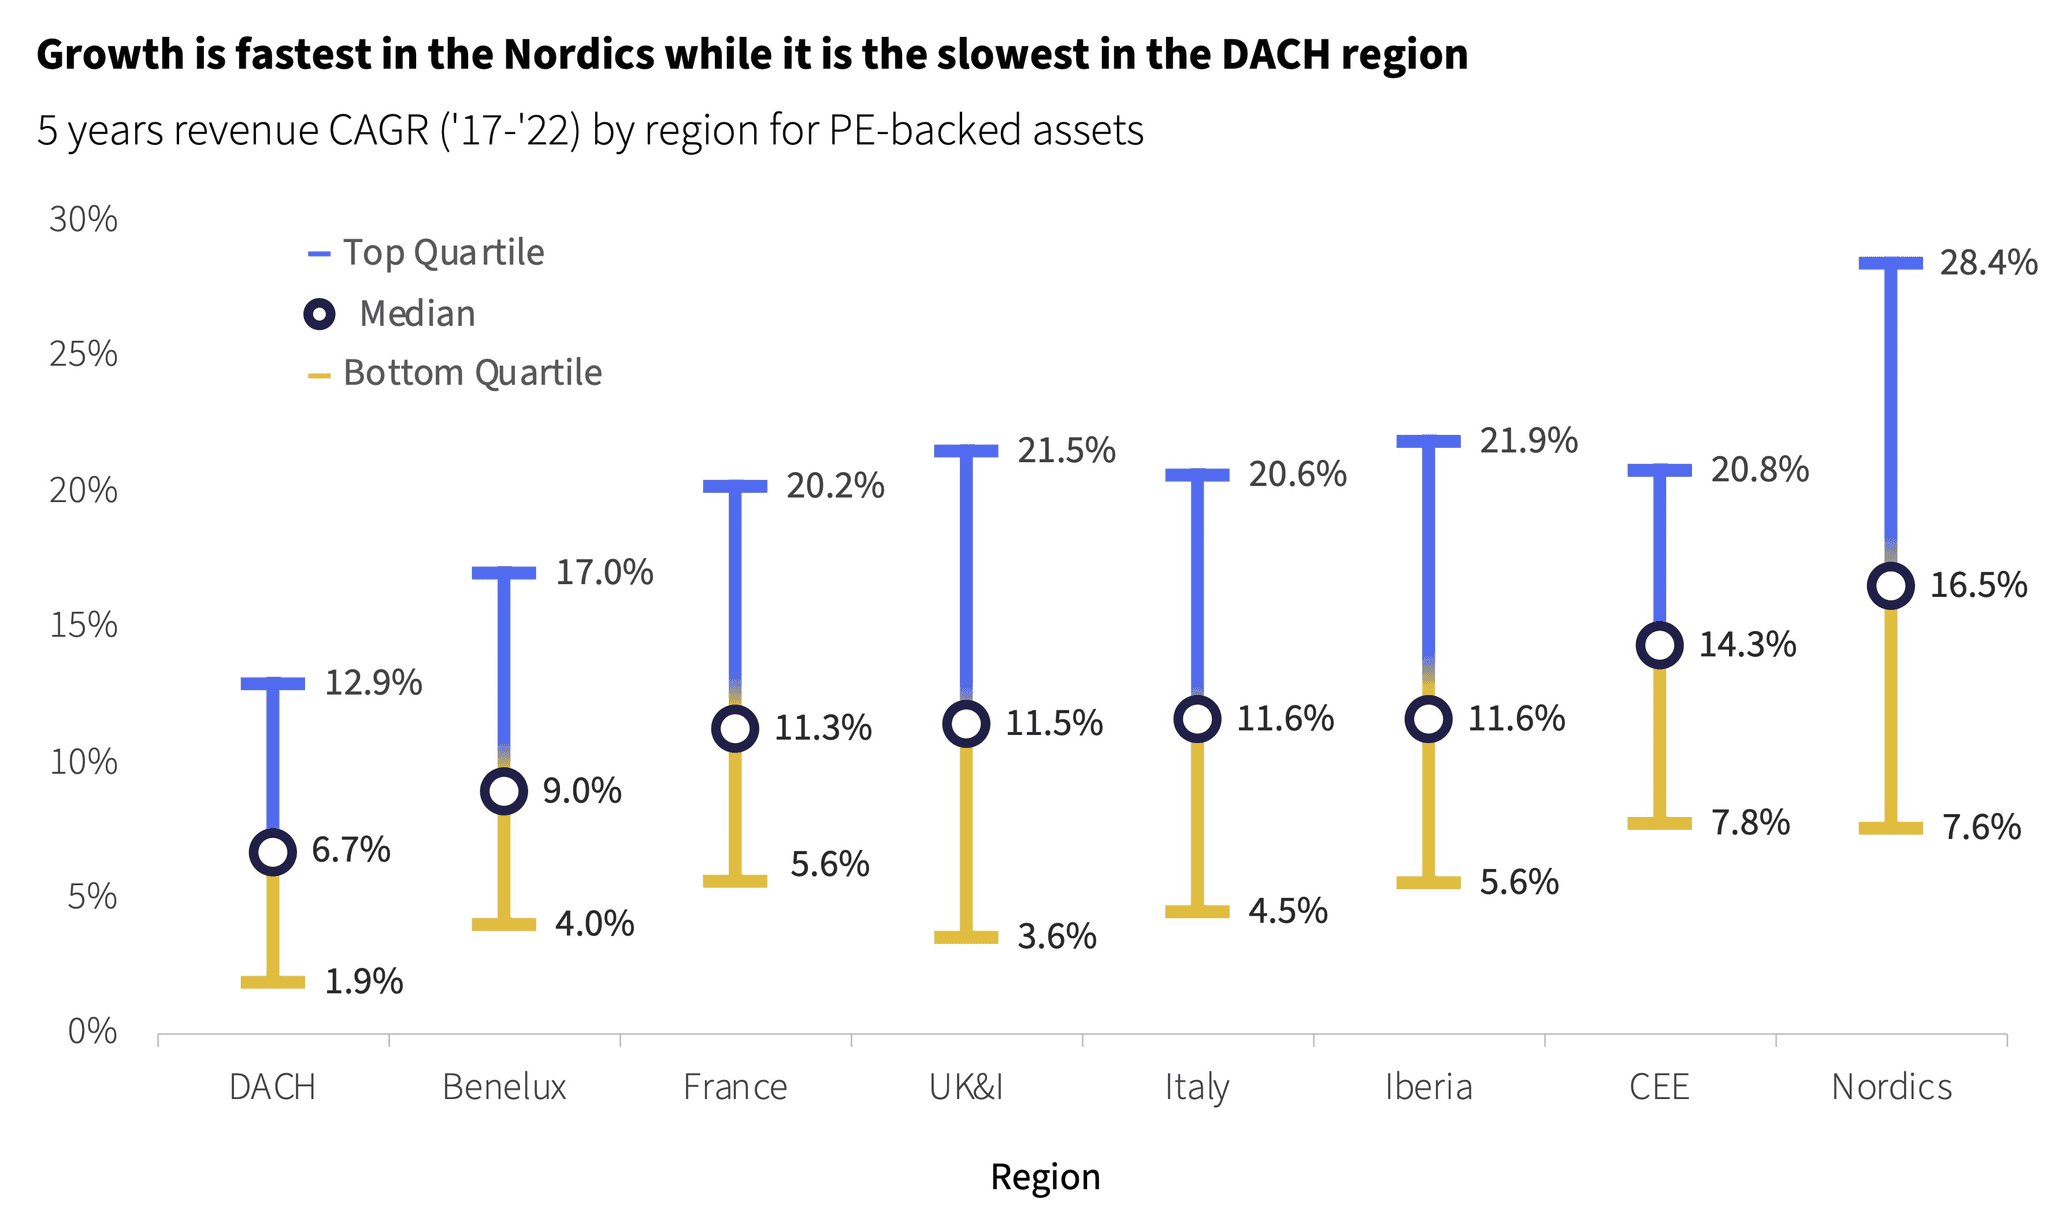
Growth is fastest in Nordics while it is slowest in the DACH region. Nordic regions are home to a lot of fast growing TMT and Services businesses while DACH is home to many mid to slow growing Industrials assets.
EBITDA Margins
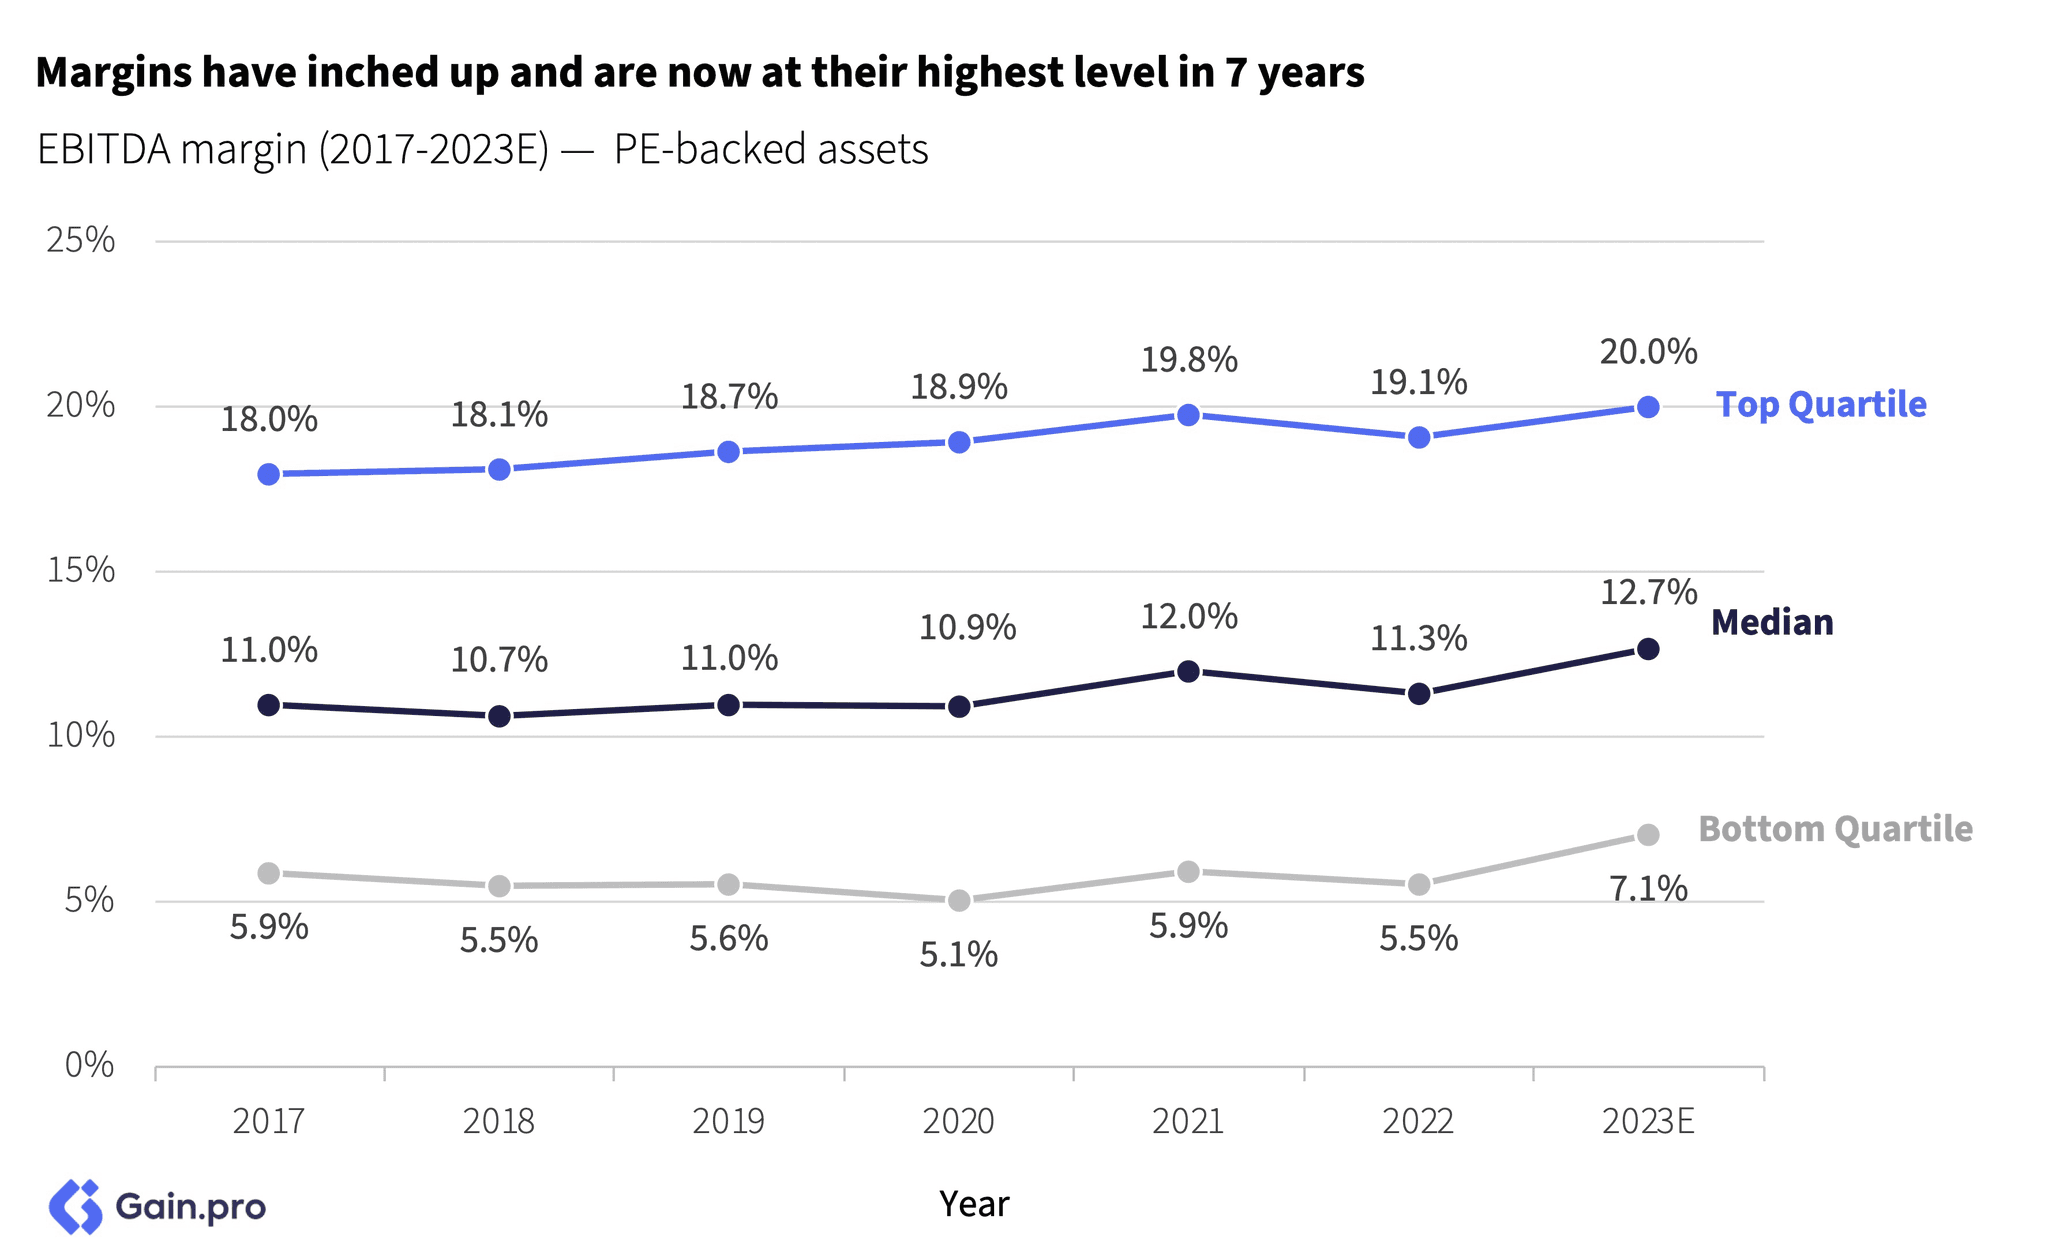
EBITDA margins for PE-backed businesses have been expanding over the last few years. The median PE-owned asset expanded margin from 11.0% in 2017 to 12.7% in 2023 (170 bps of expansion). Further, the spread between quartiles has remained stable, and so has the relative outperformance of high margin businesses.
As you would expect, a higher EBITDA margin leads to a higher entry and exit multiple. Investors readily pay a premium for businesses that are high quality and resilient. High operational efficiency coupled with strong cash flows also de-risks the transaction for the buyer.
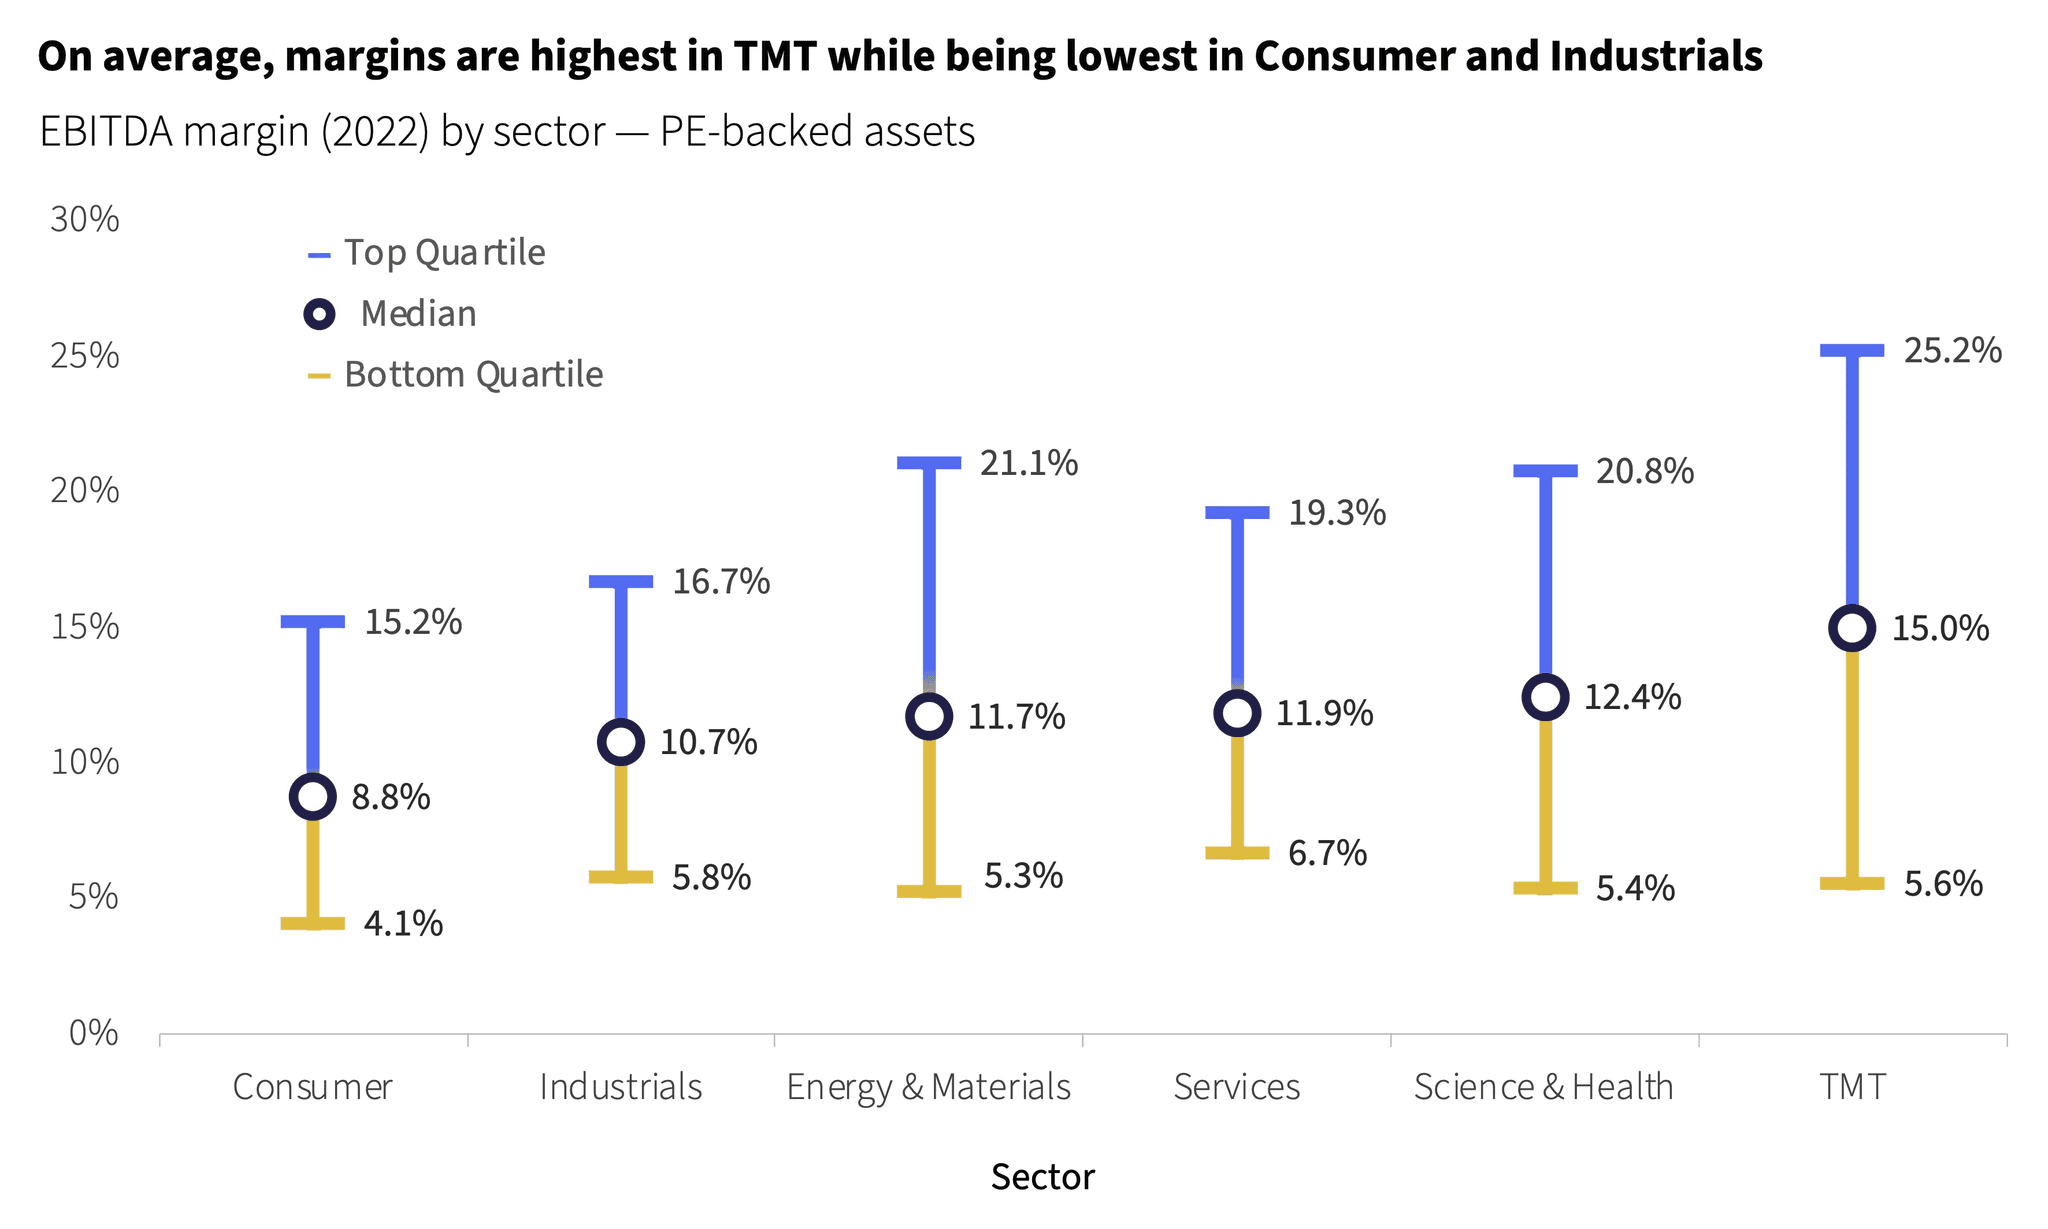
Margins are the highest in asset-light sectors such as TMT and Science & Health which also have scale benefits. On the flip side, margins are slimmest in Consumer and Industrials which have low gross margins and high operational costs.
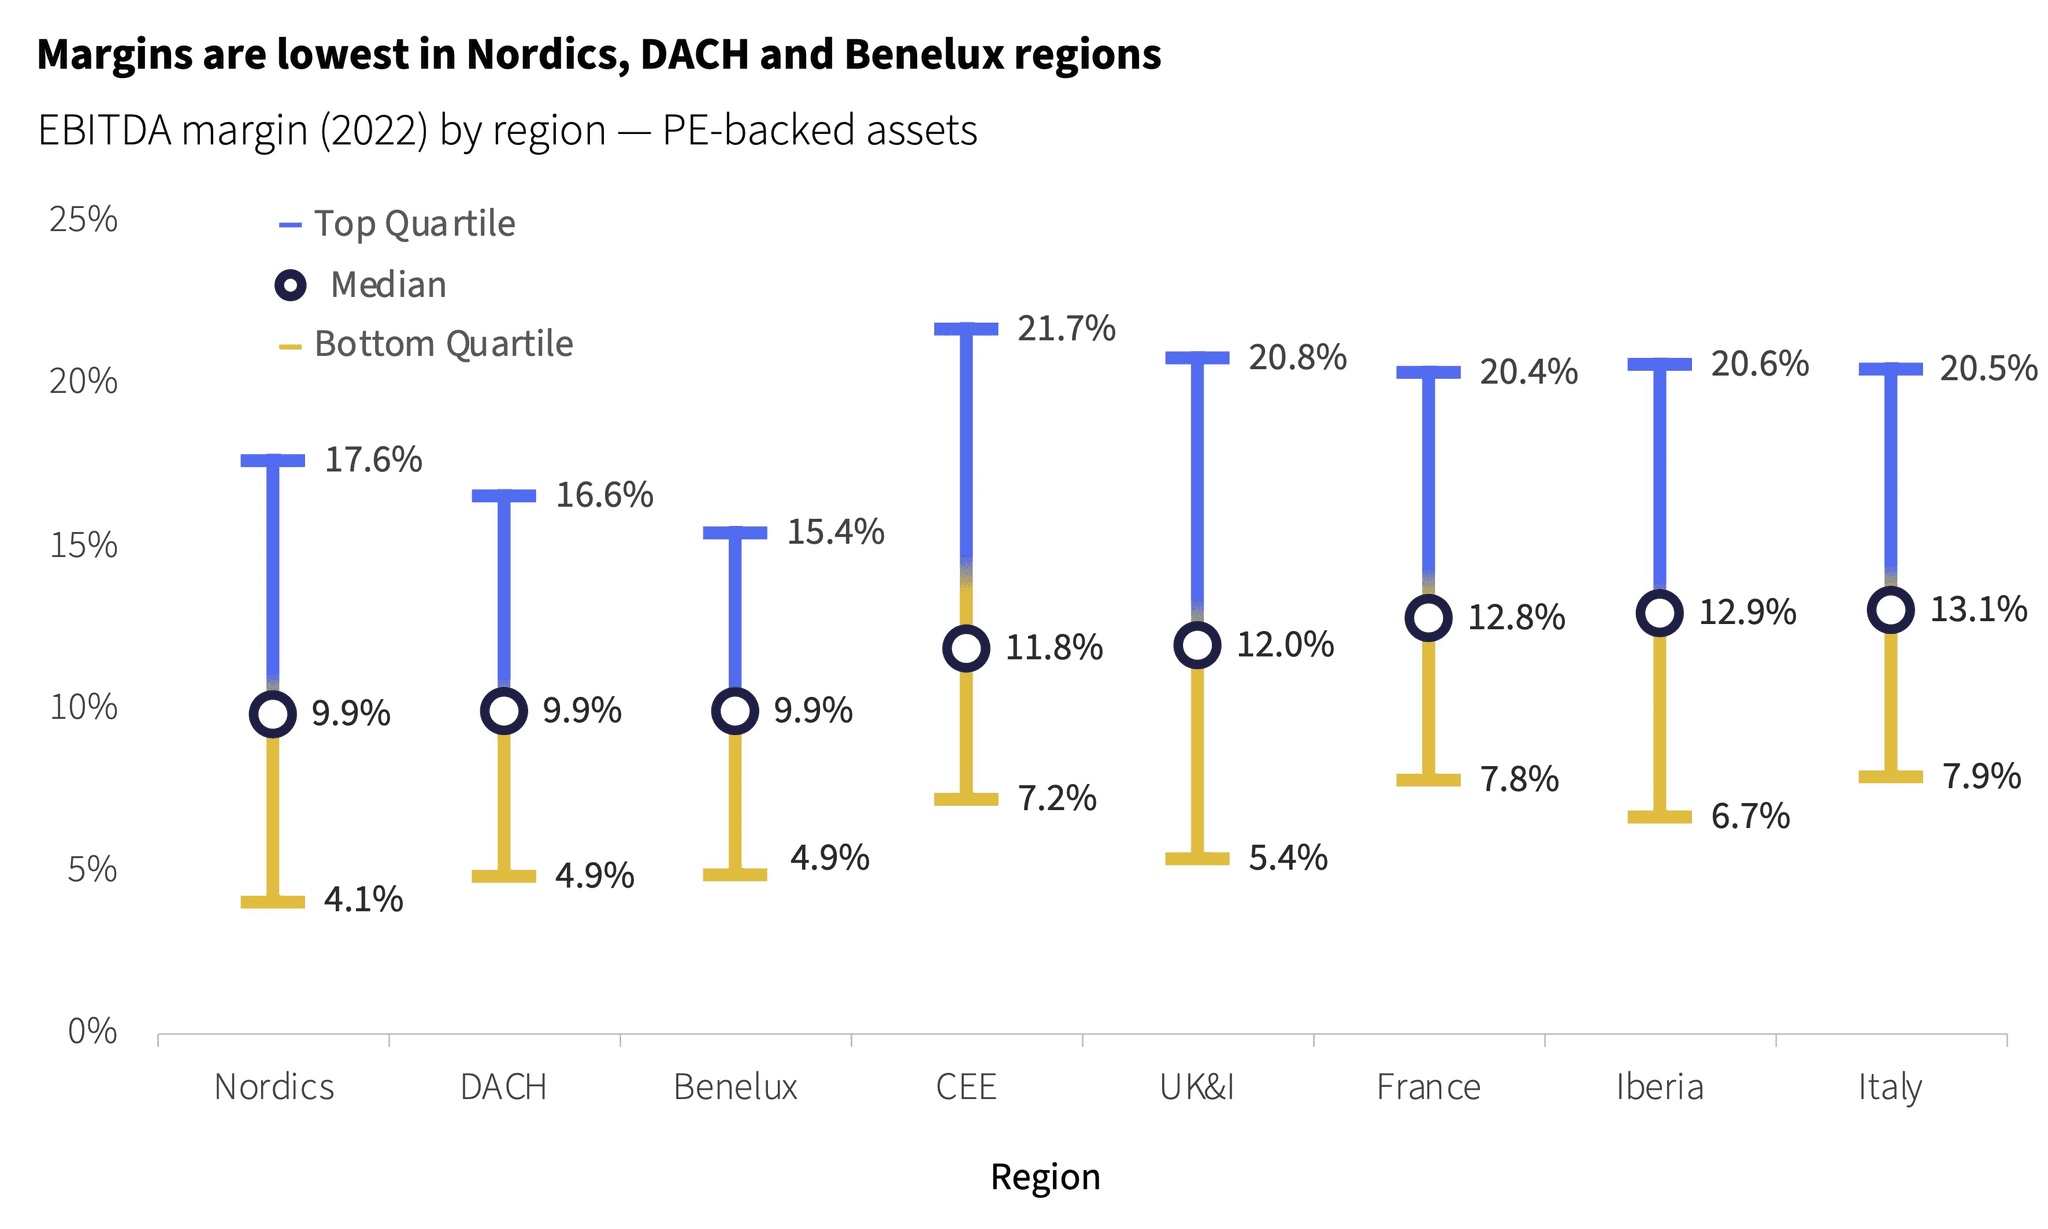
Margins are not very different across geographies except in Nordics, DACH and Benelux where they are lower. DACH in particular has a high proportion of lower-margin Industrials assets.
Methodology
The data for this report comes from Gain.pro.
We define PE-backed entries as those in which a PE firm took a minority or majority stake. We define PE-backed exits as those in which a PE firm sold a minority or majority stake. We exclude any VC rounds from our analysis. Both entries and exits also exclude live and aborted deals.
We only focused our analysis on assets HQ’d in Europe.
We estimate the deal count for the latest quarter based on prior deal history and the percent of deals that are announced or added post quarter close.
For metric calculations, we only included assets that had a hand-curated profile on Gain.pro (10+ hours of primary research). Where possible, we have used 2023 metrics. But in cases where numbers are still being reported, we have relied on 2022 metrics.
All EBITDA related metrics such as EBITDA margin and EV/EBITDA multiples exclude Financial Services from calculations.
Glossary
Benelux: Belgium, Netherlands and Luxembourg
CEE: Central and Eastern Europe
CAGR: Compound annual growth rate
DACH: Deutschland (Germany), Austria and Confœderatio Helvetica (Switzerland)
DPI: Distribution to paid-in
EBITDA: Earnings before interest, taxes, depreciation and amortization
EV: Enterprise value
HQ: Headquarters
Iberia: Portugal and Spain
IRR: Internal rate of return
M&A: Mergers and acquisitions
Nordics: Finland, Norway, Denmark and Sweden
PE: Private equity
SMEs: Small and medium-sized enterprises
UK&I: United Kingdom and Ireland
US: United States


