At a glance
A sector approach reveals that organic growth is most prevalent in TMT and other ‘usual suspects.’ However, when digging deeper into underlying niches, the picture becomes much more dispersed.
In fact, while a sector approach is useful to find fast-growing clusters, a lot of outperformance takes place at the company level, with many fast-growing champions hiding out in lower-growth sectors and industries.
Growth needs to be weighted against other key investment criteria such as profitability, cash conversion and cyclicality. The perfect asset hardly exists and may also be prohibitively expensive to acquire.


Pockets of growth
The previous chapter has shown that there remains plenty of organic growth opportunities and that many investors are excelling at capturing them. This begs the question of where such organic growth can be found. The following analyses aim to unearth the main pockets of growth at increasing levels of granularity. Herein, we will also weigh in profitability and cyclicality, since both are deemed key investment criteria weighed in by many PE investors.
We will start out by taking a high-level view of the main sectors. Looking at organic growth rates at this level, it can be observed that TMT, showing an average organic growth rate of 8-10%, is performing best. It is followed by the financial services and science & health sectors. In contrast, the industrials sector, with an average organic growth rate of 4-6%, followed by materials & energy and consumer are the sectors growing below the overall sector average.
Figure
17
TMT offers most organic growth opportunity, industrials are staying behind
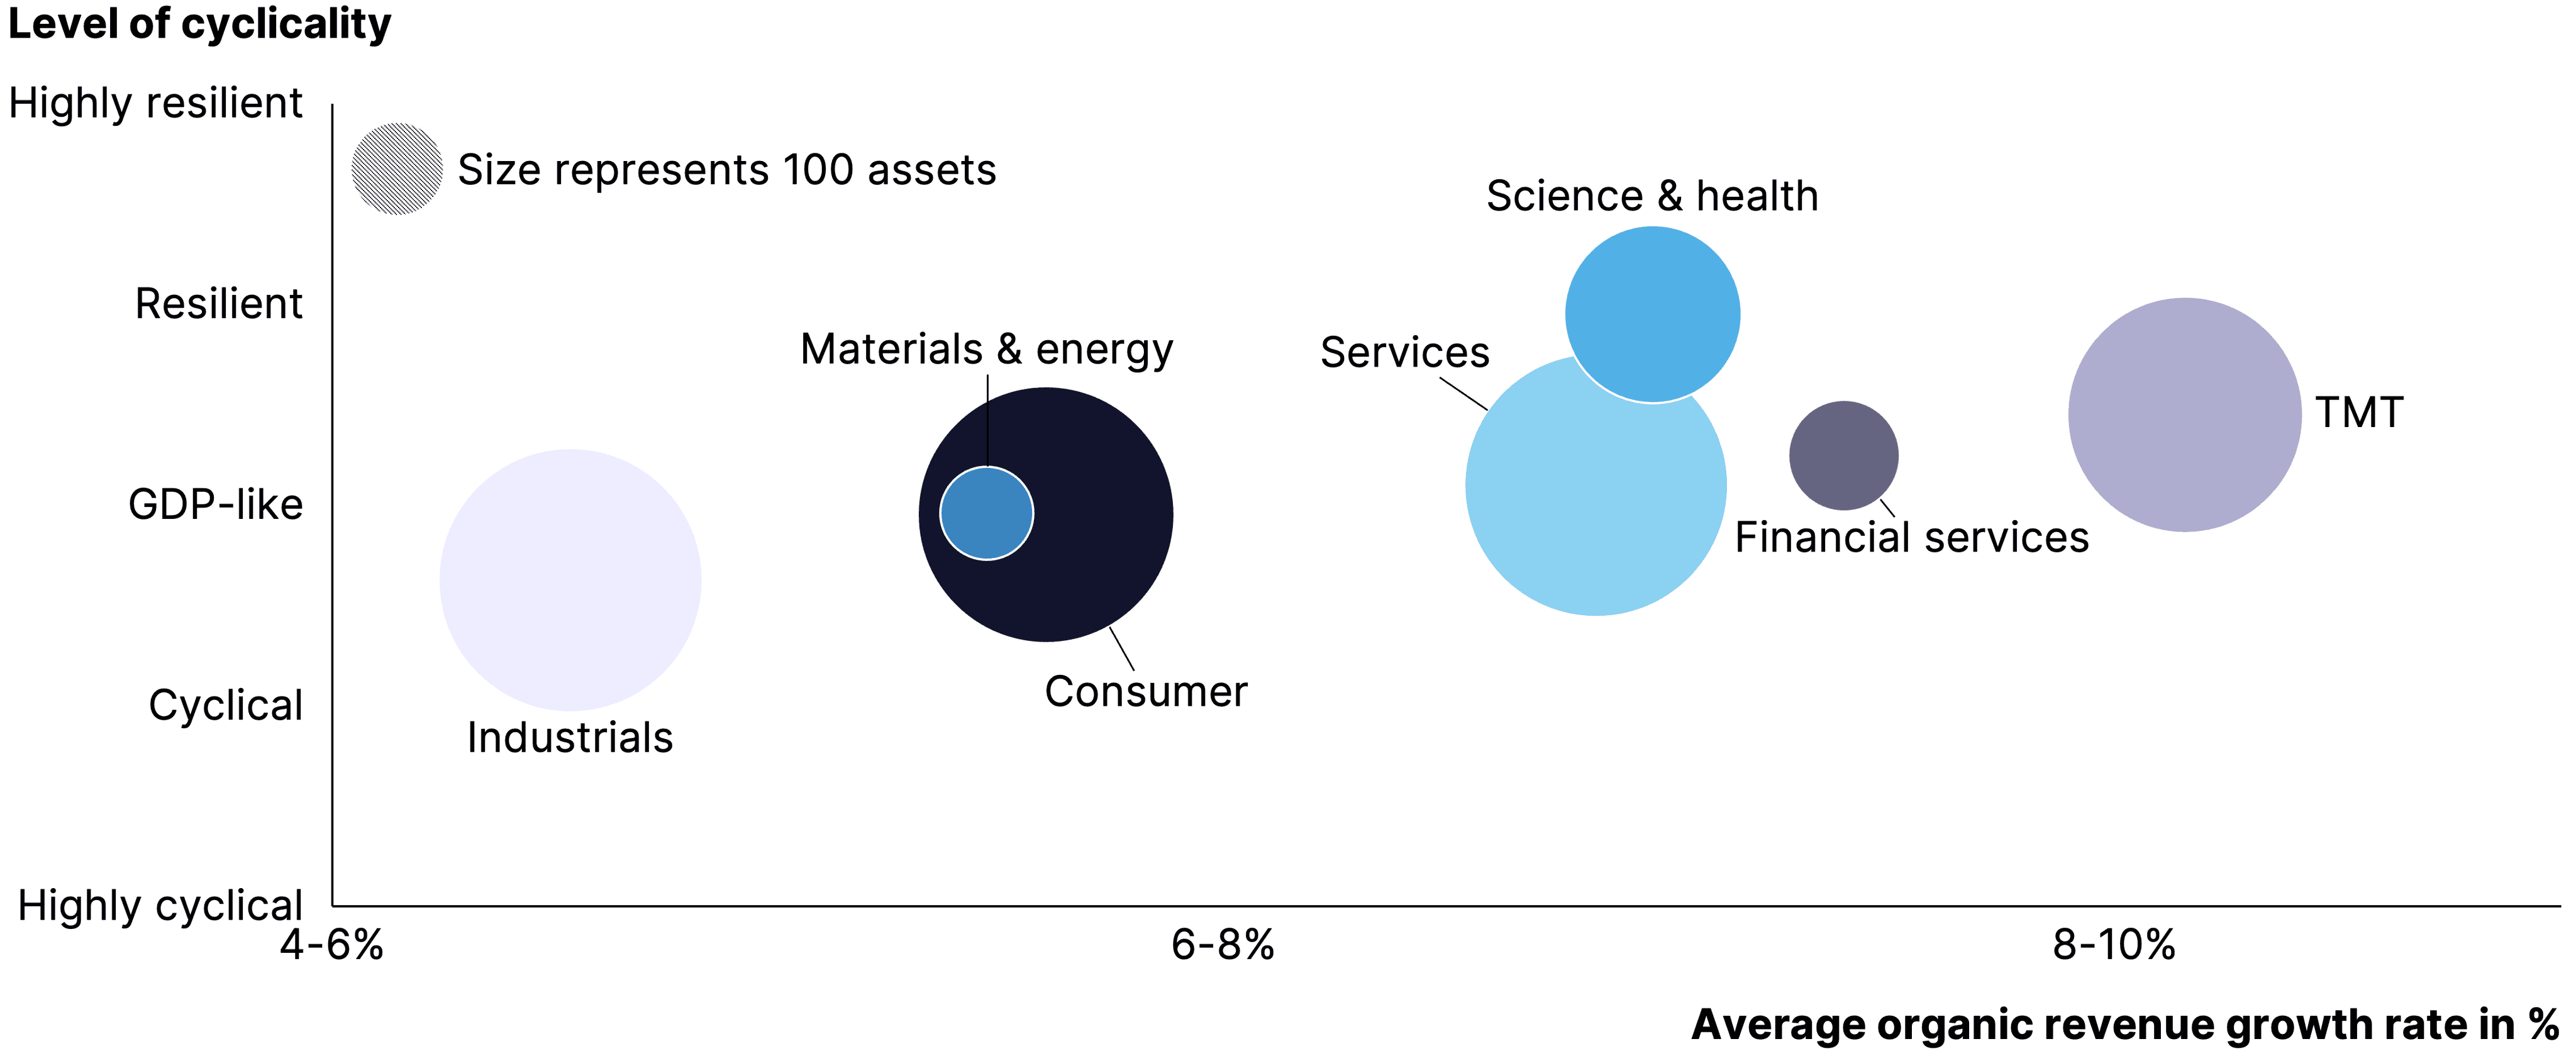
Notes: The chart refers only to companies which are majority-held by PE investors. Additionally, the average organic revenue growth calculation is based on the companies' last 5-year financial statements. Source: Gain.pro
As pointed out before, it is important for investors to weigh in cyclicality to gauge the endurance of historical organic growth. As expected, the science & health sector stands out as the least cyclical sector. Overall, the slower-growing sectors industrials, materials & energy and consumer are more cyclical than the faster-growing sectors TMT, financial services and services. This indicates an increased interest in the organically faster-growing sectors from an investor’s perspective since they comprise both higher growth and lower cyclicality.
Figure
18
TMT also leads when factoring in asset profitability
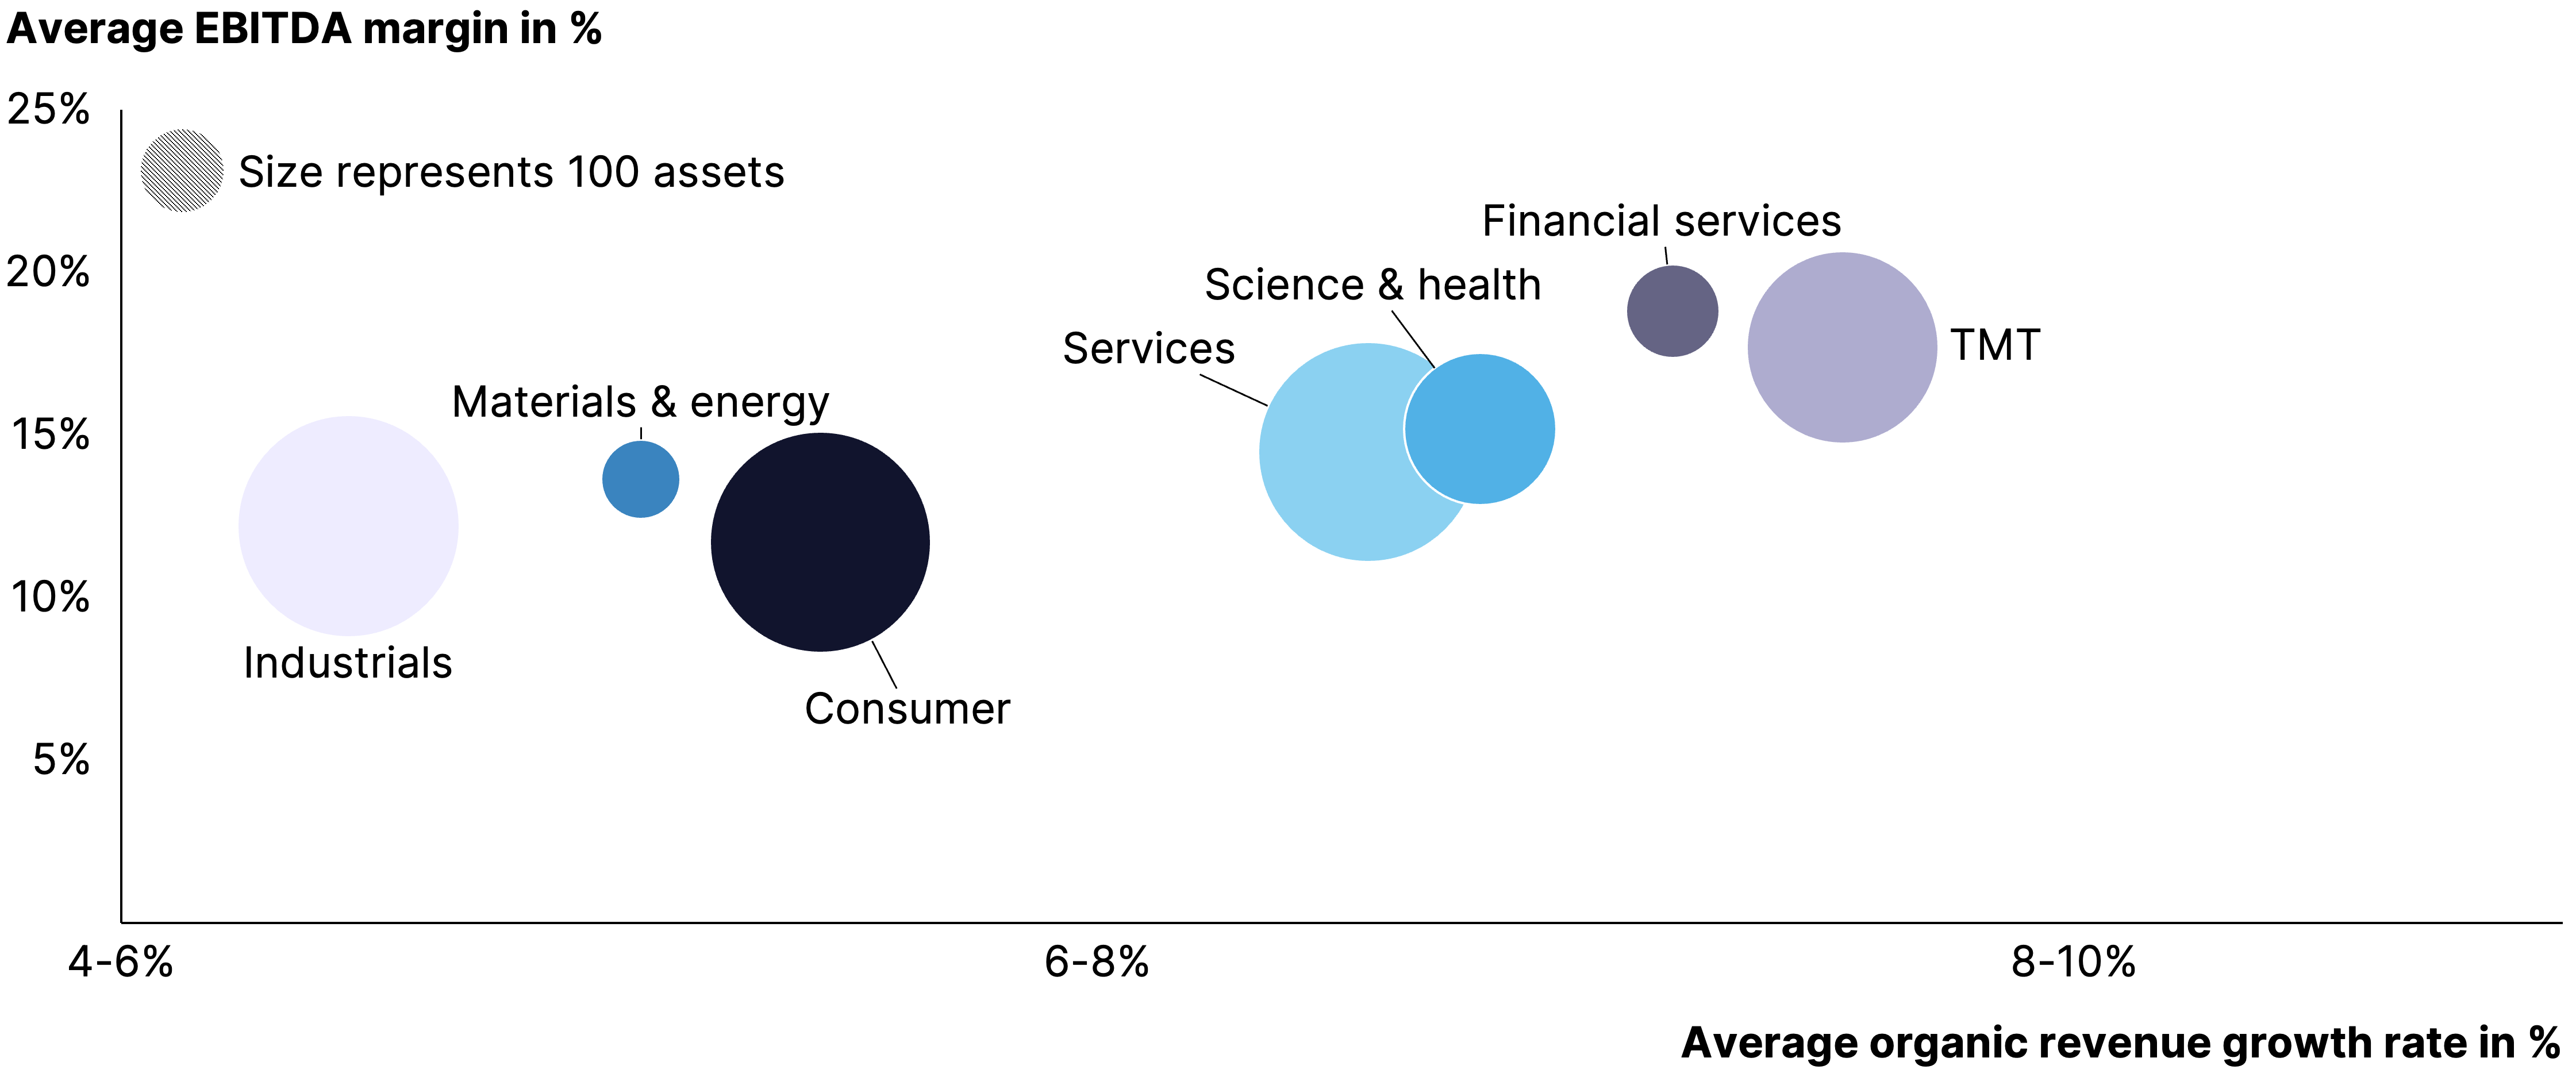
Notes: The chart refers only to companies which are majority-held by PE investors. Additionally, the average organic revenue growth and EBITDA margin calculation is based on the companies' last 5-year financial statements. Additionally, the dataset is based only companies reporting an EBITDA. Source: Gain.pro
Taking profitability (in the form of EBITDA margin) into account, it can be observed that the organically faster-growing sectors outperform the slower-growing ones. Financial services, followed by TMT, is leading the board. In line with the ranking of sectors on the organic growth vs. cyclicality chart, the slower-growing sectors also show the lowest profitability. More specifically, consumer stands out as the least profitable sector followed by industrials and materials & energy.
Figure
19
Looking more granularly, biotech and software stand out in terms of growth
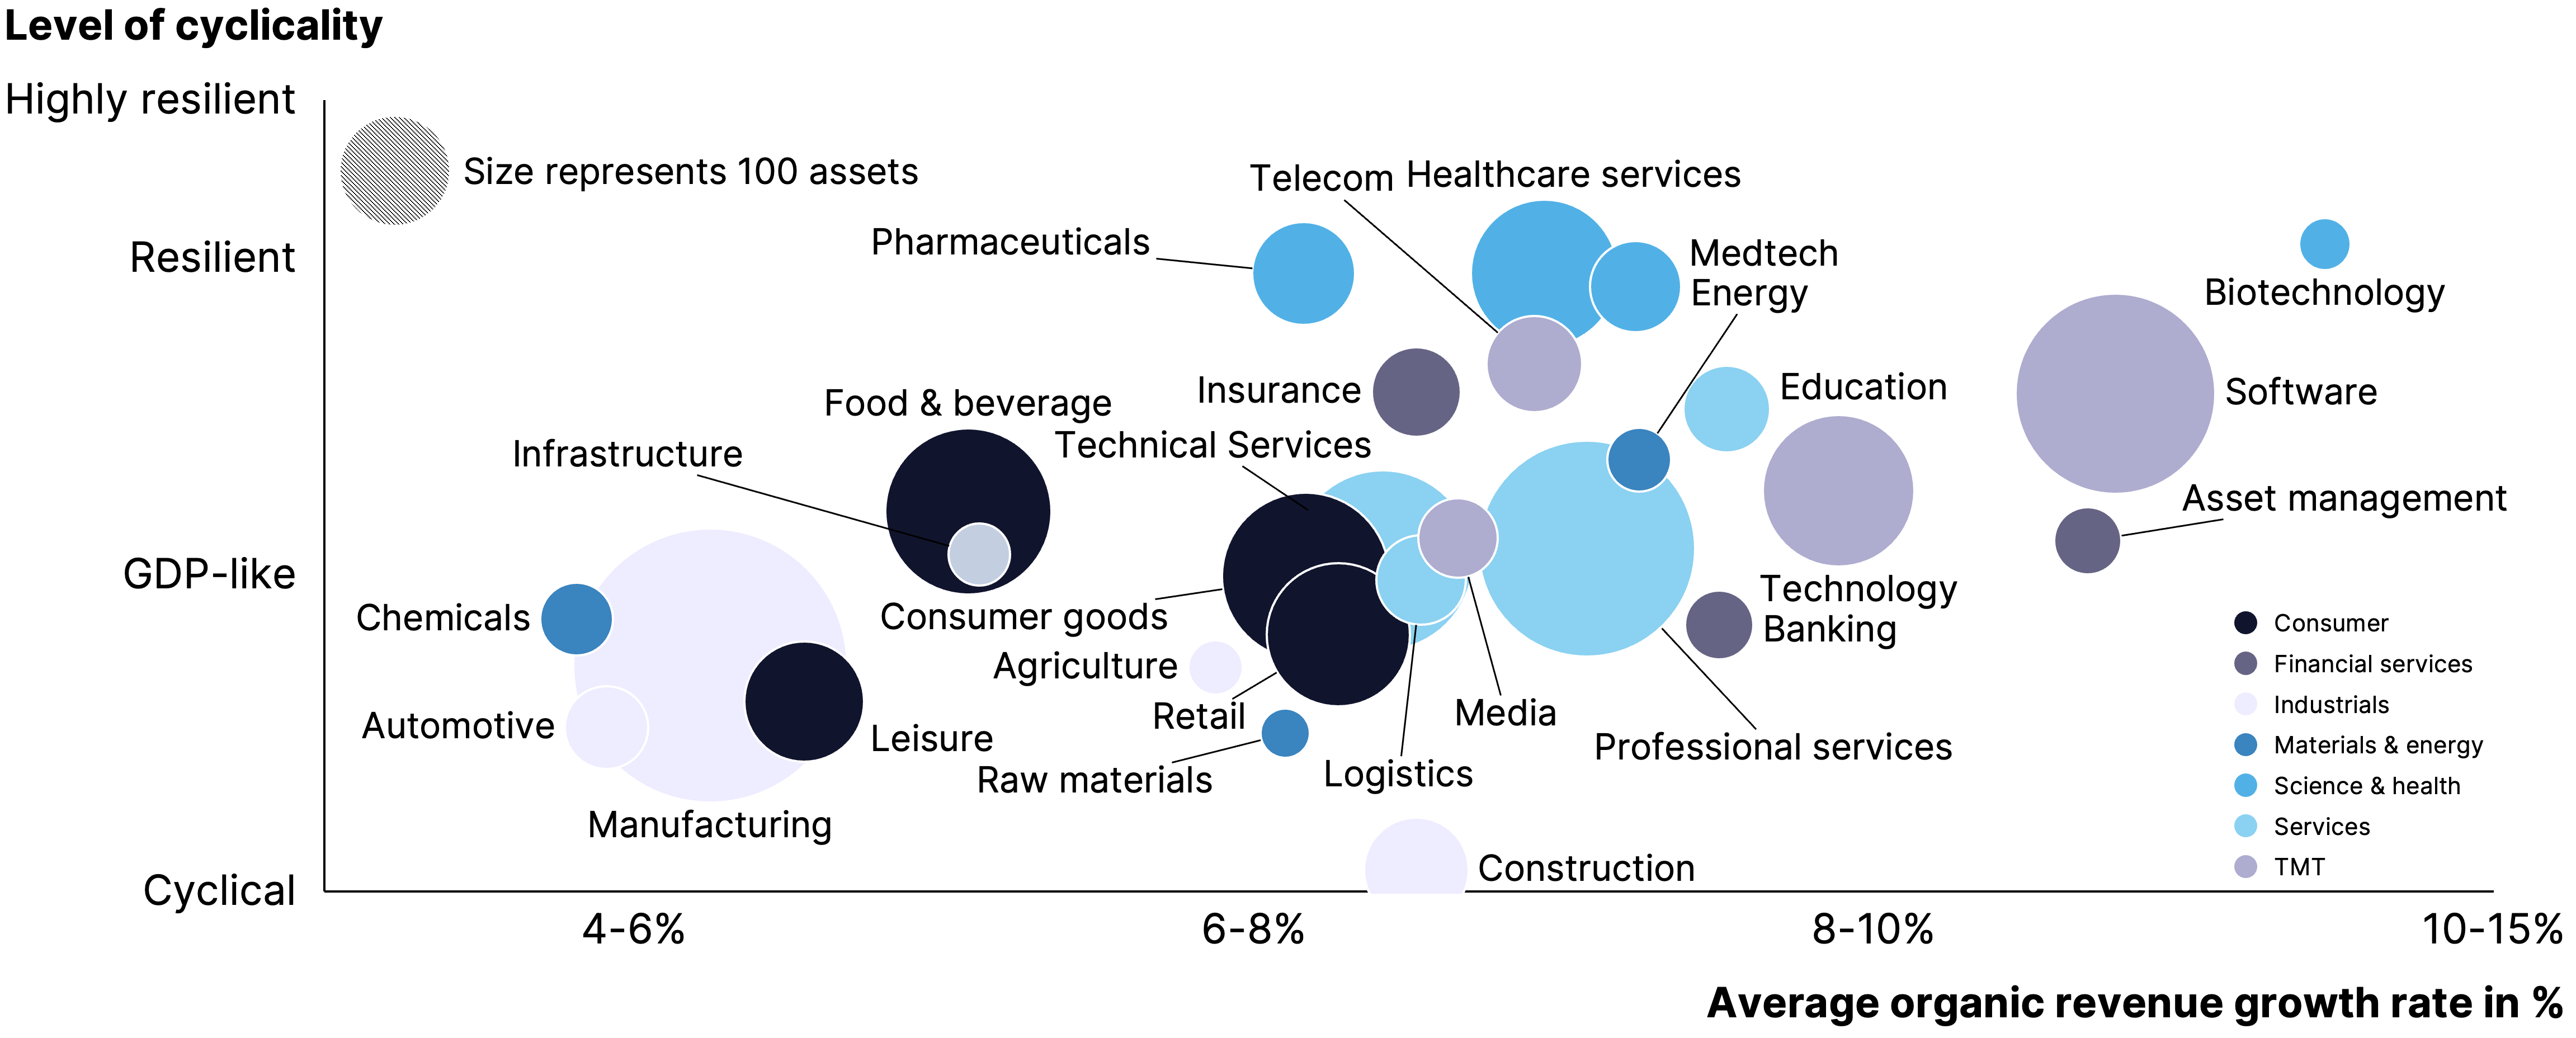
Notes: The chart refers only to companies which are majority-held by PE investors. Additionally, the average organic revenue growth calculation is based on the companies' last 5-year financial statements. Source: Gain.pro
Going one layer deeper and looking at organic growth, cyclicality and profitability from a subsector perspective, the picture gets a bit more dispersed. Overall, all science & health subsectors stand out as most resilient but more diverse in organic revenue growth, with pharmaceuticals growing the slowest (6-8%) and biotechnology the fastest (10-15%). For other sectors, the more granular approach to capture organic growth reveals more diverse insights: While consumer goods demonstrates average performance in terms of organic revenue growth (6-8%) and cyclicality (GDP-like), leisure stands out in the consumer sector as slowest-growing and most cyclical. Furthermore, media is underperforming the other TMT subsectors in terms of both cyclicality and organic revenue growth. Unsurprisingly, construction stands out as the most cyclical sector but has demonstrated the highest organic growth rates in the industrials sector (6-8%) in the past.
Figure
20
Biotech and asset management lead when it comes to combining growth and high margins

Notes: The chart refers only to companies which are majority-held by PE investors. Additionally, the average organic revenue growth and EBITDA margin calculation is based on the companies' last 5-year financial statements. Source: Gain.pro
Taking profitability into account on a subsector level, the asset management and biotechnology subsectors stand out in both profitability and organic growth. In contrast, the least profitable subsectors are automotive and retail, with automotive also being one of the slowest growing subsectors (4-6%). This goes in line with the development of the automotive sector, mainly the suppliers, in recent years. Lastly, the subsectors software and technology perform well as expected in both organic revenue growth (8-10%) and profitability.
Figure
21
Real granular insight is found only when looking at industry-level performance
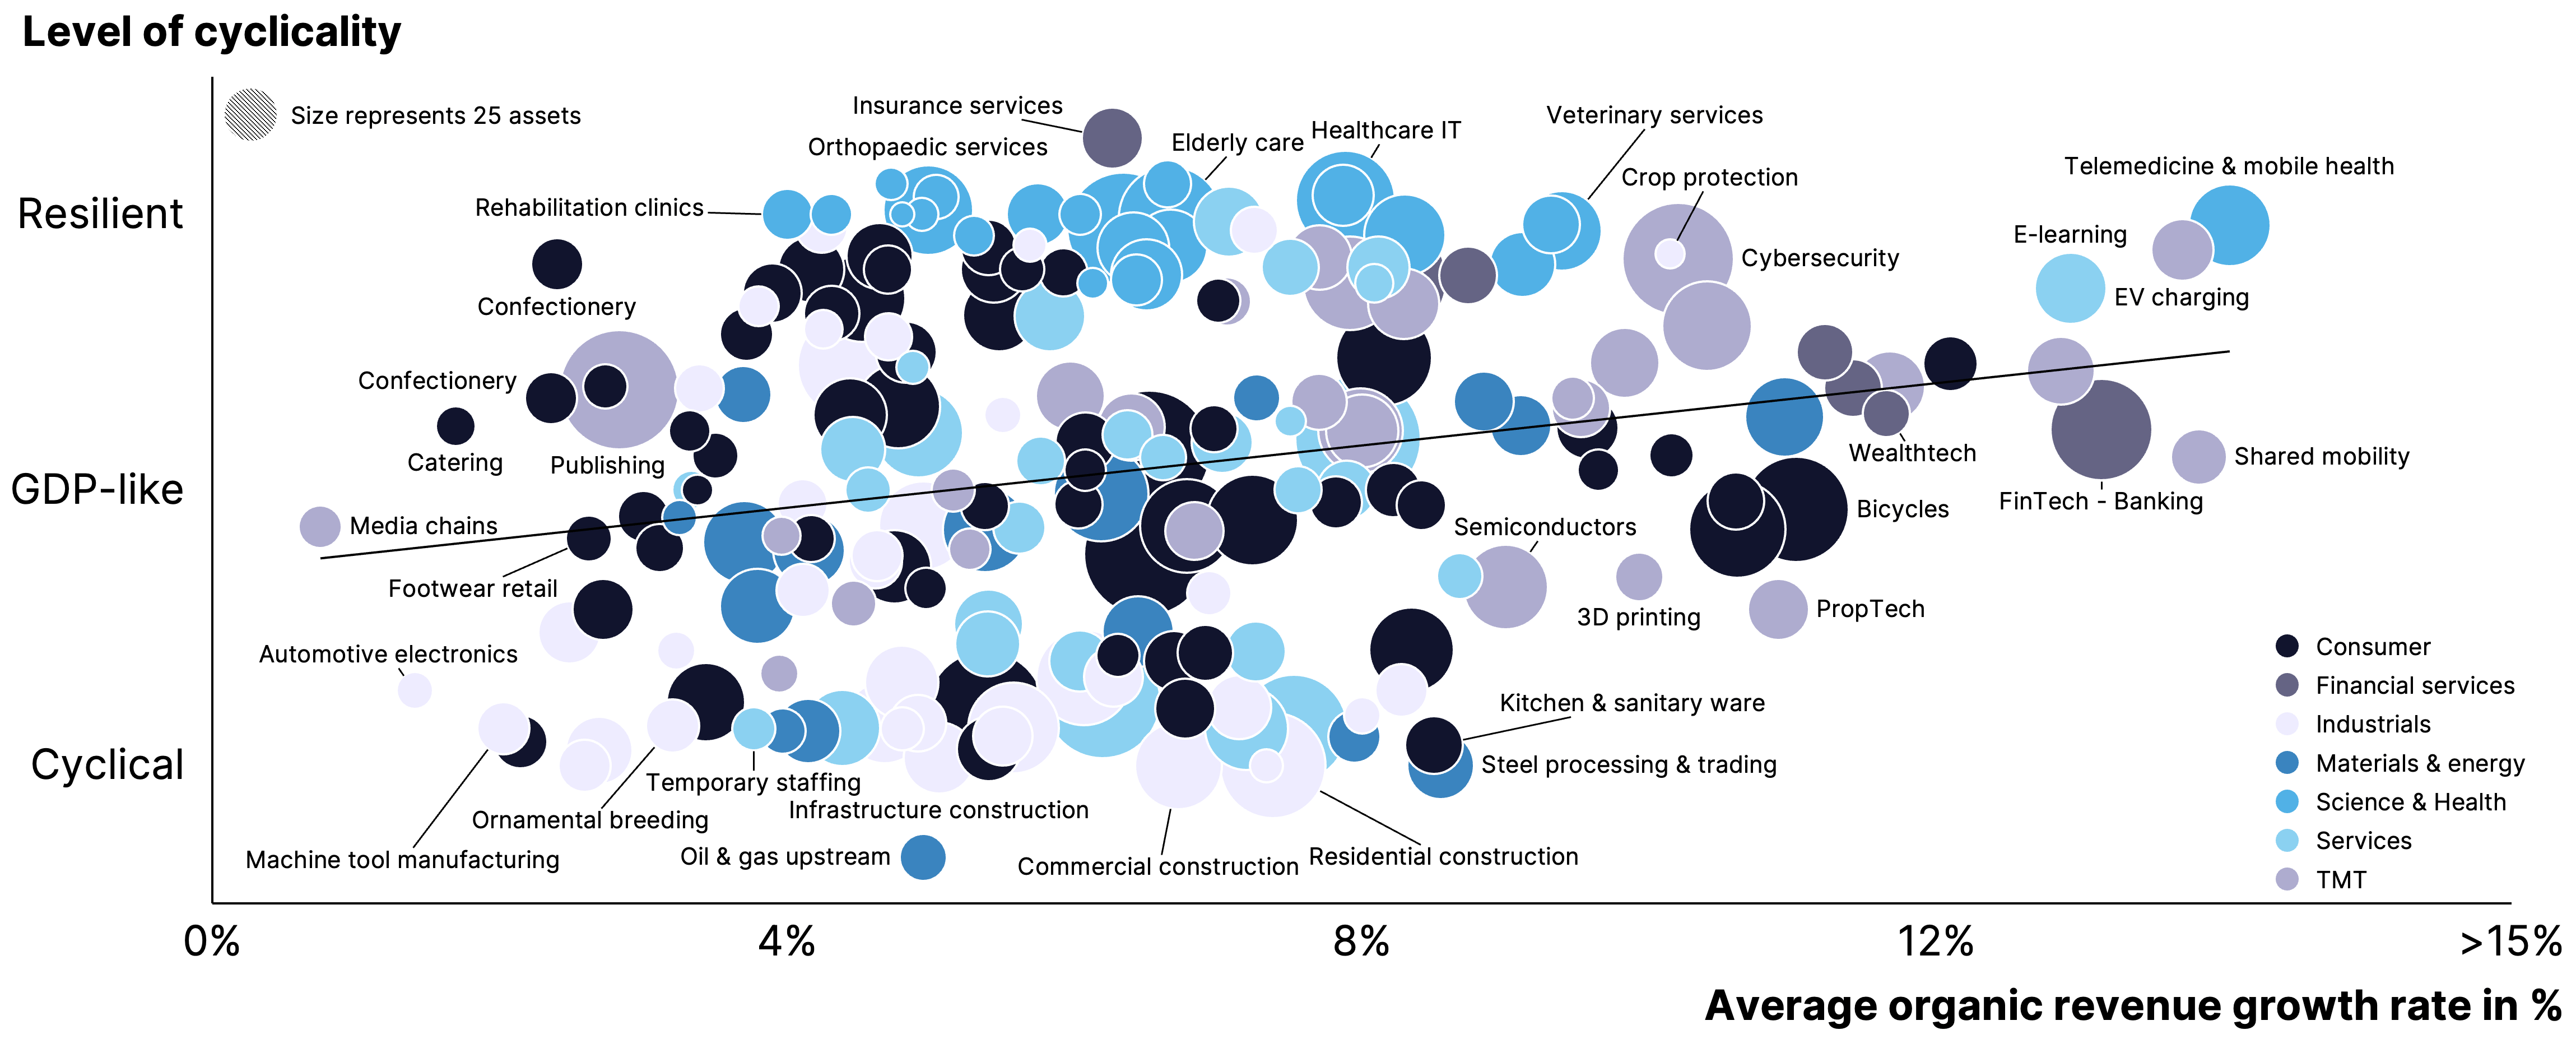
Notes: The chart refers to companies with the following ownership types: VC-backed, Minority PE-backed, PE-backed, Longhold and Private ownership. Additionally, the average organic revenue growth and EBITDA margin calculation is based on the companies' last 5-year financial statements. Source: Gain.pro
Going yet another layer deeper and looking at organic growth on an industry level, an even more dispersed picture can be drawn, which is overall still in line with the picture on the sector and subsector level. Looking at organic revenue growth on an industry level, especially new emerging and VC-backed industries, such as shared mobility, fintech-banking or telemedicine & mobile health, stand out (12-15%). Those industries not only show strong organic revenue growth but also resilience. On the lower end of the organic revenue growth scale, saturated industries mainly from the industrial and consumer sectors can be found. Examples include automotive electronics, confectionery and catering. With regard to the TMT sector, media chains stand out as a descending industry in terms of organic revenue growth. Looking at cyclicality, the vast majority of industries from the science & health sector show the highest resilience, which is in line with observations on a sector and subsector level. Furthermore, the various construction industries also stand out as being the most cyclical.
Figure
22
At a higher level of granularity, growth more often comes with a trade-off on profitability

Notes: The chart refers to companies with the following ownership types: VC-backed, Minority PE-backed, PE-backed, Longhold and Private ownership. Additionally, the average organic revenue growth calculation is based on the companies' last 5-year financial statements. Source: Gain.pro
Taking into account profitability in addition to cyclicality and organic revenue growth, it becomes visible that the emerging, often VC-backed industries, show high organic revenue growth and low cyclicality but significantly lack in profitability. This observation can be made across sectors, for instance, the telemedicine & mobile health industry from the science & health sector or the shared mobility industry from the TMT sector. Besides that, profitability varies significantly across industries with all levels of profitability being found across sectors.
Figure
23
PEs have been able to find growth assets throughout Europe, with the Nordics and UK ahead
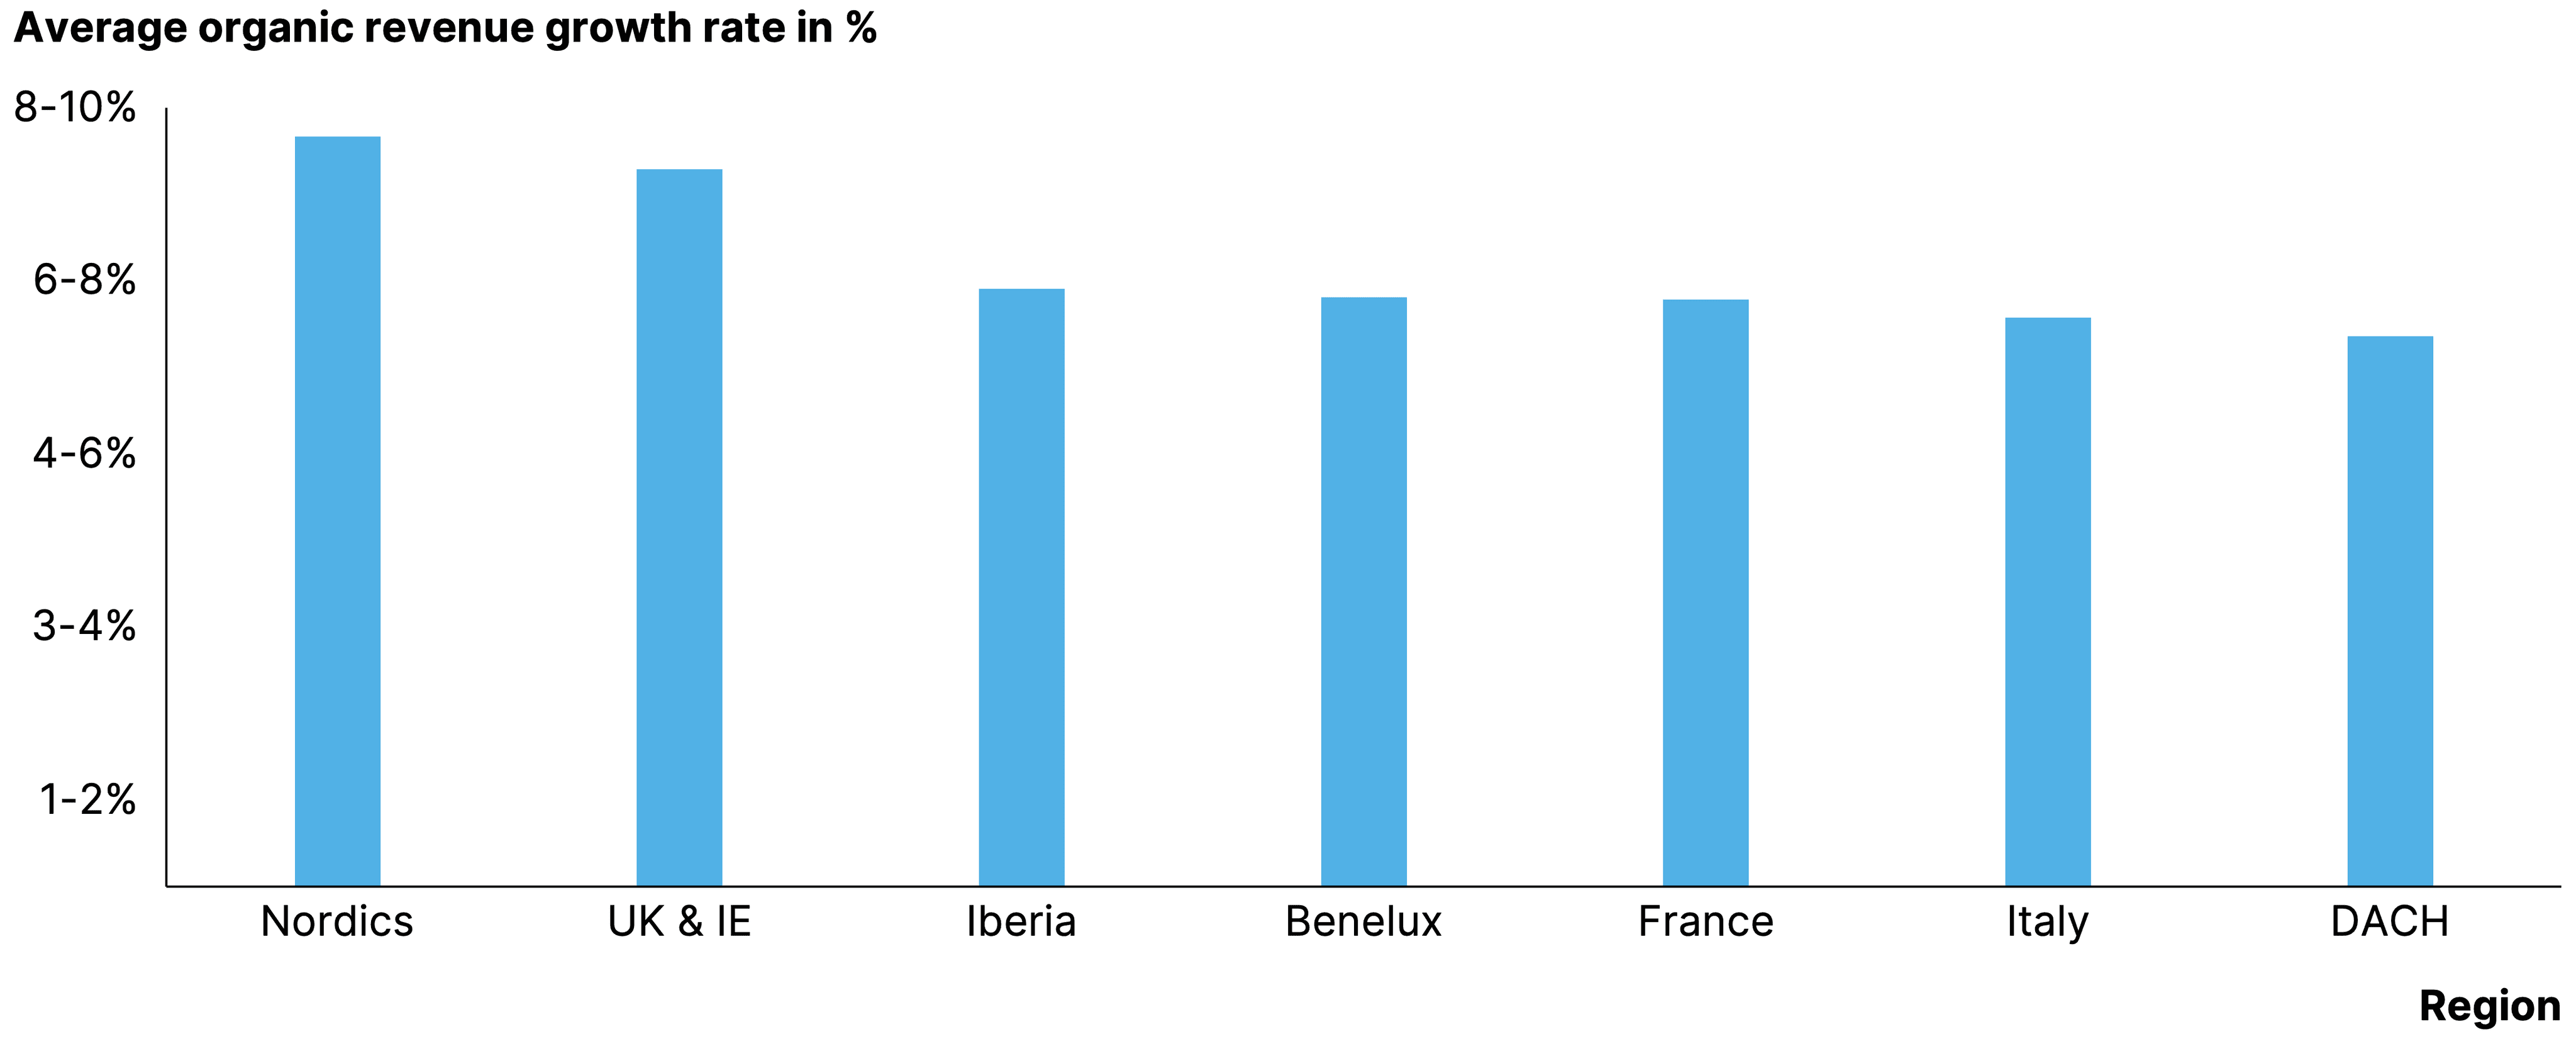
Notes: The chart refers only to companies which are majority-held by PE investors. Additionally, the average organic revenue growth calculation is based on the companies' last 5-year financial statements. Source: Gain.pro
Finally, looking at organic revenue growth from a regional perspective, it can be observed that investors can find growth across all European regions. Overall, the PE-backed companies (we look at a single ownership category to make the data like-for-like) in the Nordics and the UK/IE market are performing slightly better than other regions in Europe. But what mostly stands out is that growth rates are largely quite similar.
Means can be deceiving
Thus far, we took a sector perspective to find growth. However, for investors there is a clear risk to taking this approach. To illustrate the issue, let us compare the growth distribution of the overall low-growth retail industry with the on average high-growth technology industry.
Figure
24
Be aware, picking winning companies is more important than picking winning sectors

Notes: The chart refers to all ownership types. Additionally, the average organic revenue growth calculation is based on the companies' last 5-year financial statements. Source: Gain.pro
As is visible when doing so, there turns out to be many high-growth companies within the lower-growth retail sector, whereas the tech-sector actually includes a good number of sluggishly performing assets. In other words, investors miss out on many high-growth companies if they only focus on high-growth sectors.
Figure
25
Avoiding lower-growth industries leads to missing out on a third of the fastest-growing companies

Notes: The chart refers to all ownership types. Additionally, the average organic revenue growth calculation is based on the companies' last 5-year financial statements. Source: Gain.pro
This point is made even clearer when looking at the percentage of fast-growing companies that fall into each industry. We compare the lower-growth industrials, materials & energy and consumer sectors against the above-average growth services, science & health, financial services and TMT sectors. It turns out that disregarding the three slower-growing sectors from an investment scope means excluding 33% of the fastest-growing companies (above 15% growth) that exist overall. This proves organic growth can still be achieved in slower-growing sectors. Importantly, growth assets in such industries often trade at lower transaction multiples, making for interesting investment cases. Picking winning companies is therefore much more important than just picking a sector with high organic growth rates. In the end, the growth difference between companies in a specific sector is much higher than the growth differences between sectors, so a granular search is what truly pays off.
Be ready for trade-offs
Buying growing assets is not an objective to be pursued in isolation. A first consideration is that especially strong growth is very rare. In fact, only 24% of sizable assets in Europe achieve more than 15% annual organic revenue growth. Profitable growth is even rarer. A mere 7% of companies manage to combine such a growth rate with EBITDA margins above 12%. That even drops to 4% of companies when raising the margin threshold to over 20%.
Figure
26
Strong organic growth is rare - and profitable growth even rarer

Notes: Calculation based on organic revenue figures from companies' latest available 5-year revenues with all ownership types. Source: Gain.pro
In addition to being rare, strong organic growth is also expensive. When factoring out all other elements, a steep relationship between multiples and growth is visible. Therefore, investing in high organic growth companies comes with a certain price tag, so investors have to ask themselves whether they are willing to pay up.
Figure
27
Increasing organic revenue growth results in a higher expected EBITDA multiple

Notes: Relationship shown is based on an everything-else-equal data science method isolating the role of organic growth factor in transaction multiples. Source: Gain.pro
Additionally, growth needs to be weighted in the context of other investment criteria. The following data shows how rare strong performance is on such factors.
Figure
28
The growth profile of companies needs to be weighed against other investment criteria


Notes: The chart refers to companies with all ownership types. Additionally, the gross margin and EBITDA margin calculation is based on the companies' last 5-year financial statements. Source: Gain.pro
Growth and profit are not the only metrics that matter. Investors seek to “do good” through their investment choices. Positively, this does not have to entail a trade off against growth. In fact, there is a clear correlation between the organic growth rates of an industry and the ESG-risk profile of a company. This means that higher organic growth correlates with a (slightly) lower average ESG-risk. Investors can therefore still achieve strong organic growth while investing in ESG-friendly industries and in fact benefit from combining both.
Figure
29
ESG-friendly strategies go hand-in-hand with growth investing

Notes: The chart refers to companies with the following ownership types: VC-backed, Minority PE-backed, PE-backed, Longhold and Private ownership. Additionally, the average organic revenue growth calculation is based on the companies' last 5-year financial statements. Source: Gain.pro
Whereas ESG performance is one trade off investors don’t have to make compromises on, a certain appetite for ‘negatives’ on other investment criteria is inevitable. There are approximately 35k sizable investable assets in Europe, meaning they are either over €5m EBITDA, €50m of sales or have received at least €10m of (venture) funding. Rooting out assets based on some (reasonable) investment criteria very quickly narrows down the pool of opportunities. We provide an example of such a weeding out exercise below.
Figure
30
Trade-offs are inevitable; perfect assets hardly exist

Notes: Definition of sizable is having >€5m EBITDA and/or >€50m revenue and/or €50m EV. Source: Gain.pro
As can be seen, when narrowing the sizable companies down to those that are fully privately held (no PE/VC in the cap table) and over €10m EBITDA we are down to 7k opportunities. Some basic (but sharp) investment criteria (>15% organic growth, >20% EBITDA margin, >80% cash conversion, etc) brings our selection down to just 25(!) businesses. This is clearly too low to generate sufficient deal flow. In other words, you cannot have it all. It is important to be explicit in where you want to make trade offs if you want your sourcing efforts to deliver sufficient leads.
Investors need to define their sweet spot investment criteria as well as those elements on which they are comfortable to make trade-offs. Together, these should result in a pool of companies that is specific enough to be differentiated to build angles but broad enough to see enough deal flow. We coined this exercise the definition of the ‘Total Addressable Asset Pool (TAAP),’ and our website contains a series of resources to help PEs implement the concept