


The reversal of quantitative easing means easy returns from a market multiple uplift are a thing of the past. This poses a challenge to PE firms who now require more EBITDA growth in order to pass their carry hurdle. That is why we set out to find organic growth and buy-and-build opportunities, leveraging our own unique dataset on Europe’s private asset pool. Results show that even in today’s lackluster macro-environment the European economy offers plenty of growth avenues to construct tomorrow’s winning portfolios.
Introduction
Table of Content
Executive summary
With an astounding 58% of current global PE returns coming from multiple expansion, contracting valuations put the whole industry under pressure. Organic growth, buy-and-build and operational improvements will now have to drive performance. But with a meager 1% GDP CAGR Europe appears to be in a disadvantaged position.
The good news: European private assets still grew on average 7% overall (incl. M&A) over the last 5 years. Even better is that PE-held companies managed to outperform privately held ones by at least a factor of 2. They excel at achieving organic growth and amplify this with add-ons. Additionally, PEs overachieve margin expansion averages. However, the willingness and ability to find and drive organic growth and M&A strongly varies by investor. While there is fundamentally no right or wrong here in terms of strategy pursued, our data shows that the best performing European PEs are in fact differentially good at realizing both types of growth.
To enable investors to capture organic growth we analyzed on a sector-level where to find it in today’s economy. In aggregate, the usual suspects (e.g. TMT) stand out, but when digging deeper, many niches in less obvious sectors display high growth. Means can be deceiving. For instance, more than a third of the fastest-growing companies (>15% organic growth CAGR) operate in lower-growth industries (industrials, materials, consumer). We also find that growth is rare, with less than 24% of companies exceeding 15% annual organic expansion. What is more, few combine it with profitability and in fact less than 4% manage to achieve such a growth level while also delivering >20% EBITDA margins. It means that trade offs are likely a necessity to secure enough deal flow.
The attraction of buy-and-build is that it enables multiple arbitrage irrespective of the overall valuation curve. On top of this, we find that businesses engaged in continuous M&A are able to expand EBITDA margins much quicker than those that do not (+2.4pp vs 0.9pp in 17-22). This means scale benefits and operating synergies are real. We identified the best sectors and niches to find market fragmentation by analyzing their concentration index (HHI). Overall, the services sector is least consolidated. In addition, we compared levels of PE-ownership and ongoing M&A as a method to identify paths into less well-trodden spaces for investment.
Based on our findings, we recommend European investors sharpen their sweet spot in order to capture much-needed growth. This also includes making it explicit which flaws you are willing to accept, because perfect assets are rare and expensive. PEs should also get more creative to find multiple arbitrage opportunities that do not rely as much on overall market multiples, such as buy-and-build as well as profile enhancement to drive an attractive exit rating. Lastly, we urge investors to think more creatively than to just chase the latest hot TMT vertical. Growth is granular and can be found in a wide range of sectors. There is no denying that PEs will have to work harder to do well in the next decade. Smart data-driven sourcing strategies are one place to start.
Chapter 1: Growth in Europe
Successful LBOs require EBITDA growth. But Europe offers a low-growth environment. In order to thrive, tomorrow’s PE leaders will have to work a lot harder to pass that carry hurdle.
The good news? A lot of growth opportunities remain. Underneath sluggish overall GDP rates there is a healthily growing private asset pool which can be supplemented through buy-and-build plays.
The willingness and ability of PE players to capture both organic and acquisitive growth strongly varies. While there is no right or wrong strategy, data shows IRR leaders are typically good at both.
The PE growth imperative
LBOs, or leveraged buyouts, require a certain level of growth to work their magic. However, passing the carry hurdle on a flat-ish topline case can be challenging, especially given the persistently full valuations and increased cost of financing in today’s market. For European deal makers, this presents a worrying prospect, particularly when considering the macroeconomic challenges facing the region's economic growth.
Reflecting on the history of the industry, it's clear that the 80s and 90s were the pioneer stage when the industry was invented and household names were established. The 00s represented a golden age of high returns, which in turn attracted a significant amount of capital inflow that may have commoditized the industry in the 2010s. Fortunately for carry holders, the monetary expansion policy of Draghi led to a market multiple uplift that proved to be a windfall for virtually everyone in the industry. Looking ahead to the 20s, however, the reversal of QE combined with broader macro headwinds is unlikely to make the average returns on invested vintages particularly strong. This may mean a very meager decade is ahead for today's emerging PE talent, especially those in the middle layer primarily invested in recently deployed funds. This becomes even more clear when considering just how much of recent returns have been driven by multiple expansion.

Now, imagine trying to achieve similar returns but this time with multiple contraction. Overall, the challenging market conditions and uncertain economic outlook in Europe and beyond suggest that private equity will require innovative thinking and creative strategies in order to continue to yield hurdle-passing results. In all likelihood, top-quartile investors will still do great. Where the mediocre will struggle, outperformers will continue to thrive. But what are their options to drive outperformance? We summarize them in the following framework.
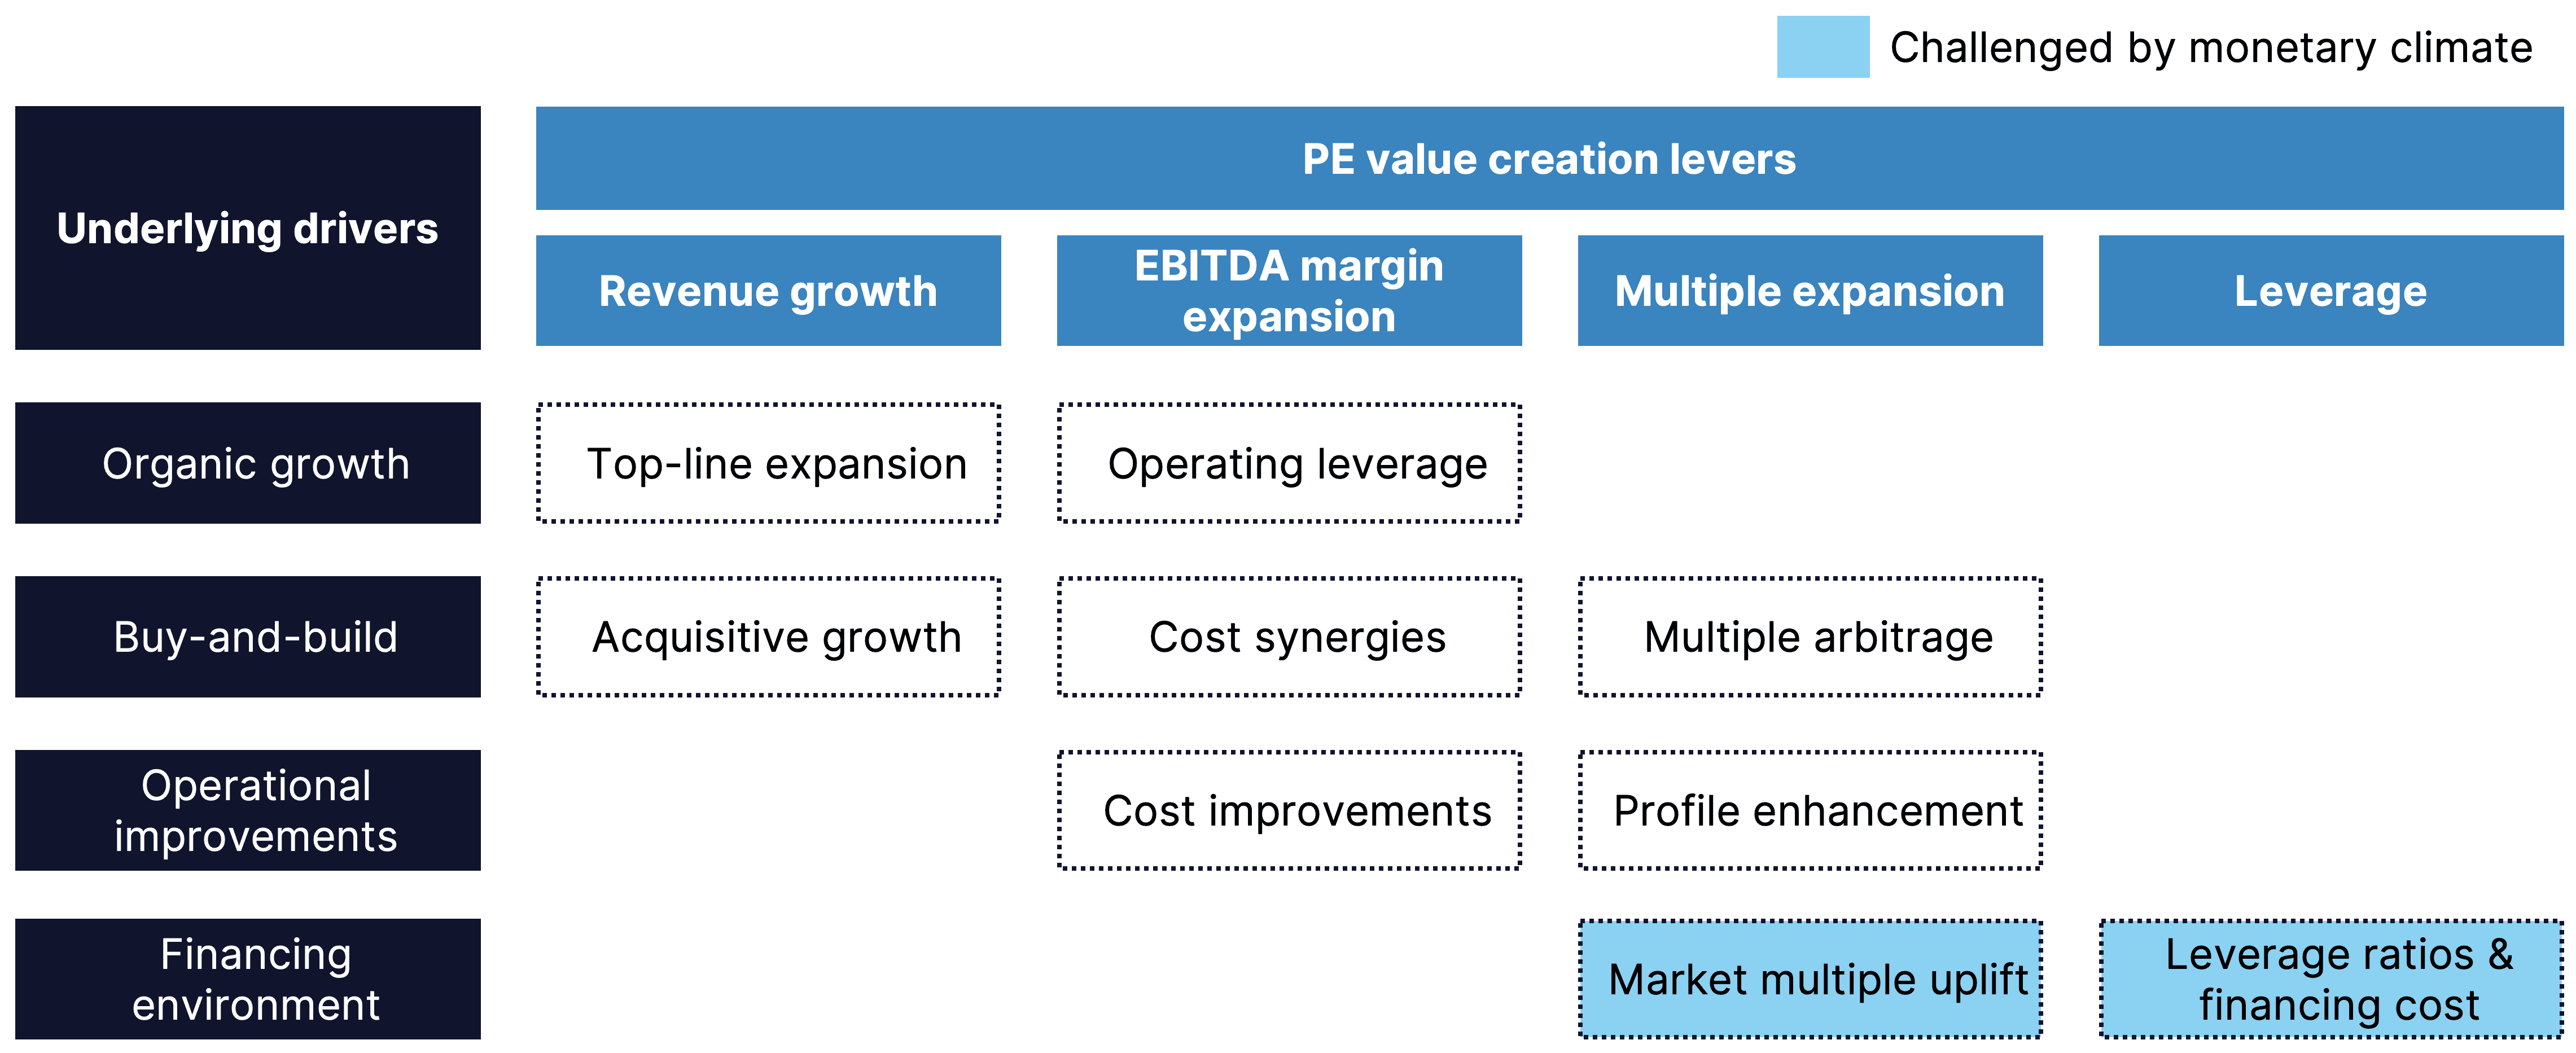
It is clear from this framework that while the ‘market multiple’ uplift may fall away, many opportunities to generate returns remain. This actually includes multiple expansion. While the monetary component of that may be falling away or even reversing now, PEs also benefit massively from small-vs-large multiple arbitrage (i.e. buy-and-build). This also remains with macro headwinds. Also, a higher rating from profile enhancement (divest non-core, lower client concentration, etc.) should still work. So the colloquial reasoning 'over half of PE value creation comes from multiple arbitrage and that's gone now' is probably largely true but not entirely. With hard work, there are paths to remain successful.
There is still growth
When looking for growth, a simple place to start is to assess GDP growth rates. The following chart represents this data for the world’s main economies.

Sources: 2022 estimates retrieved from IMF; Financial data 2000-2021 retrieved from World Economic Bank.
It is clear that GDP growth in industrialized countries has been relatively slow and has been slowing down in years. Zooming in on the EU, countries averaged 1.3% from 2000-2022E reaching a record low within the last two decades from 2017-2022E with 1.0% average growth. This is also lower than the US and China, the world’s other major economic blocs. Looking ahead - tighter monetary policies, higher interest rates, persistently high energy prices and declining confidence are all expected to sap growth in Europe in the decade ahead. These specific European weaknesses delayed recoveries in past decades and continue to keep the EU in a more vulnerable position compared to other large economies such as the US. However, this overall GDP perspective does hide a lot of healthy performance in the underlying private company asset pool.
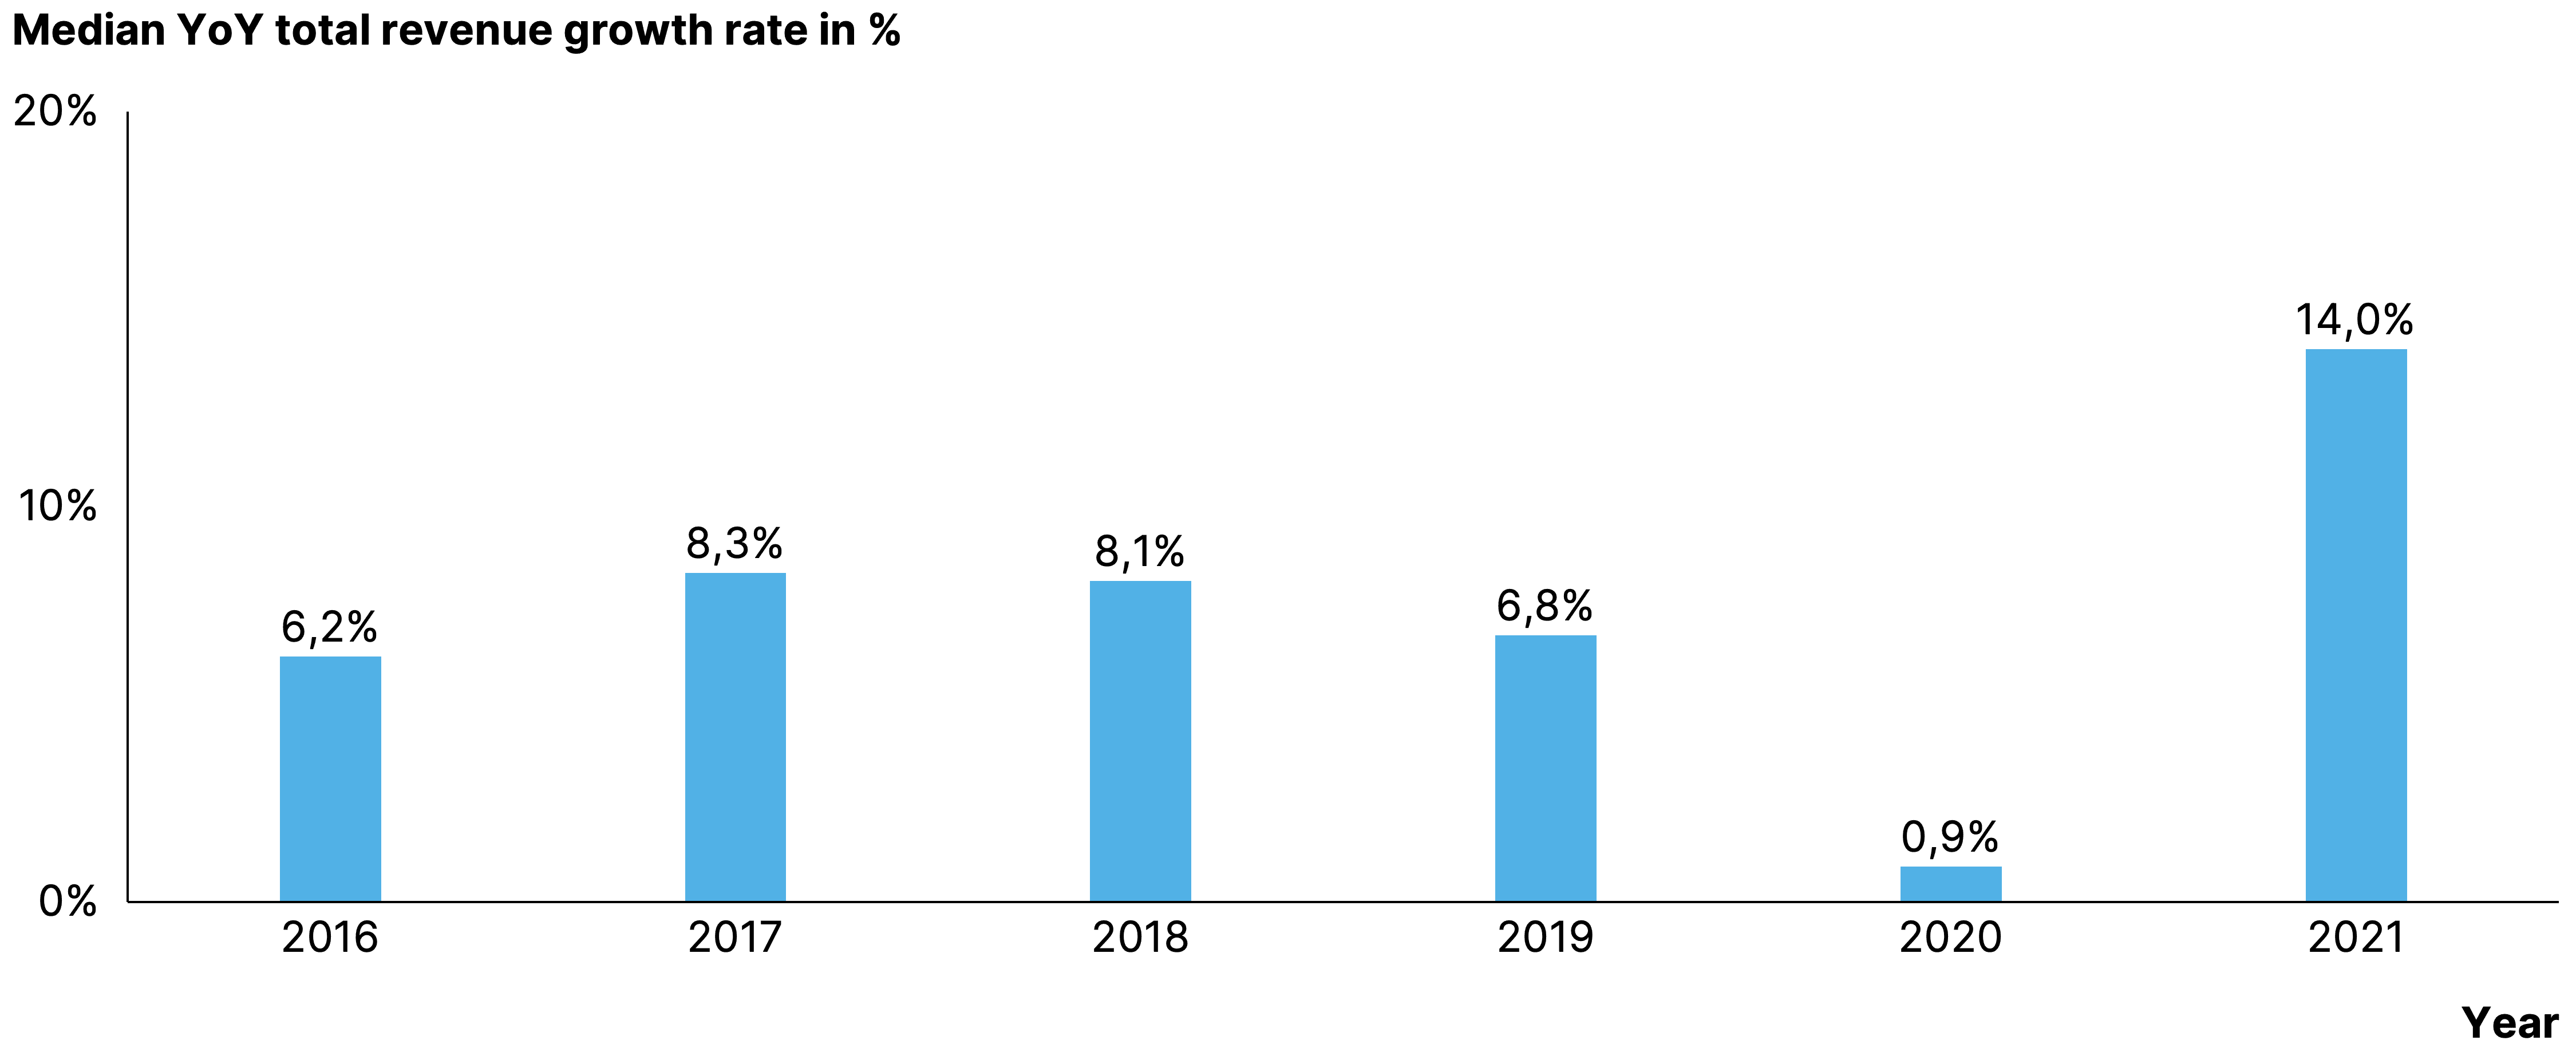
As we can see, European companies still managed to grow around 7% on average over the last 6 years. Pre-COVID, we saw stable growth rates ranging from 6-8%. This may come as a surprise given the overall GDP growth rates and even more so given that the business sector contributes to the vast majority of total GDP (the remainder comes from government spending, nonprofit and household real estate incomes). So how is it possible that European companies in our sample set consistently outperformed GDP growth? Part of the difference between the 1% GDP growth and 7% company growth in Europe can be explained by buy-and-build. Combining companies will have an impact on individual company growth as captured in our analysis but not on overall GDP growth. Another reason is the numerous companies that face bankruptcy every year which has a strong negative impact on GDP growth. Lastly, our analysis of the ‘investable asset pool’ of private companies focuses on companies above €5m EBITDA. This has a positive impact on growth rates as those companies are well-established companies that demonstrated certain growth levels in the past. The main point to take away, though, is that in spite of overall sluggish growth, there is a vast pool of potential investment opportunities that do grow at decent rates.
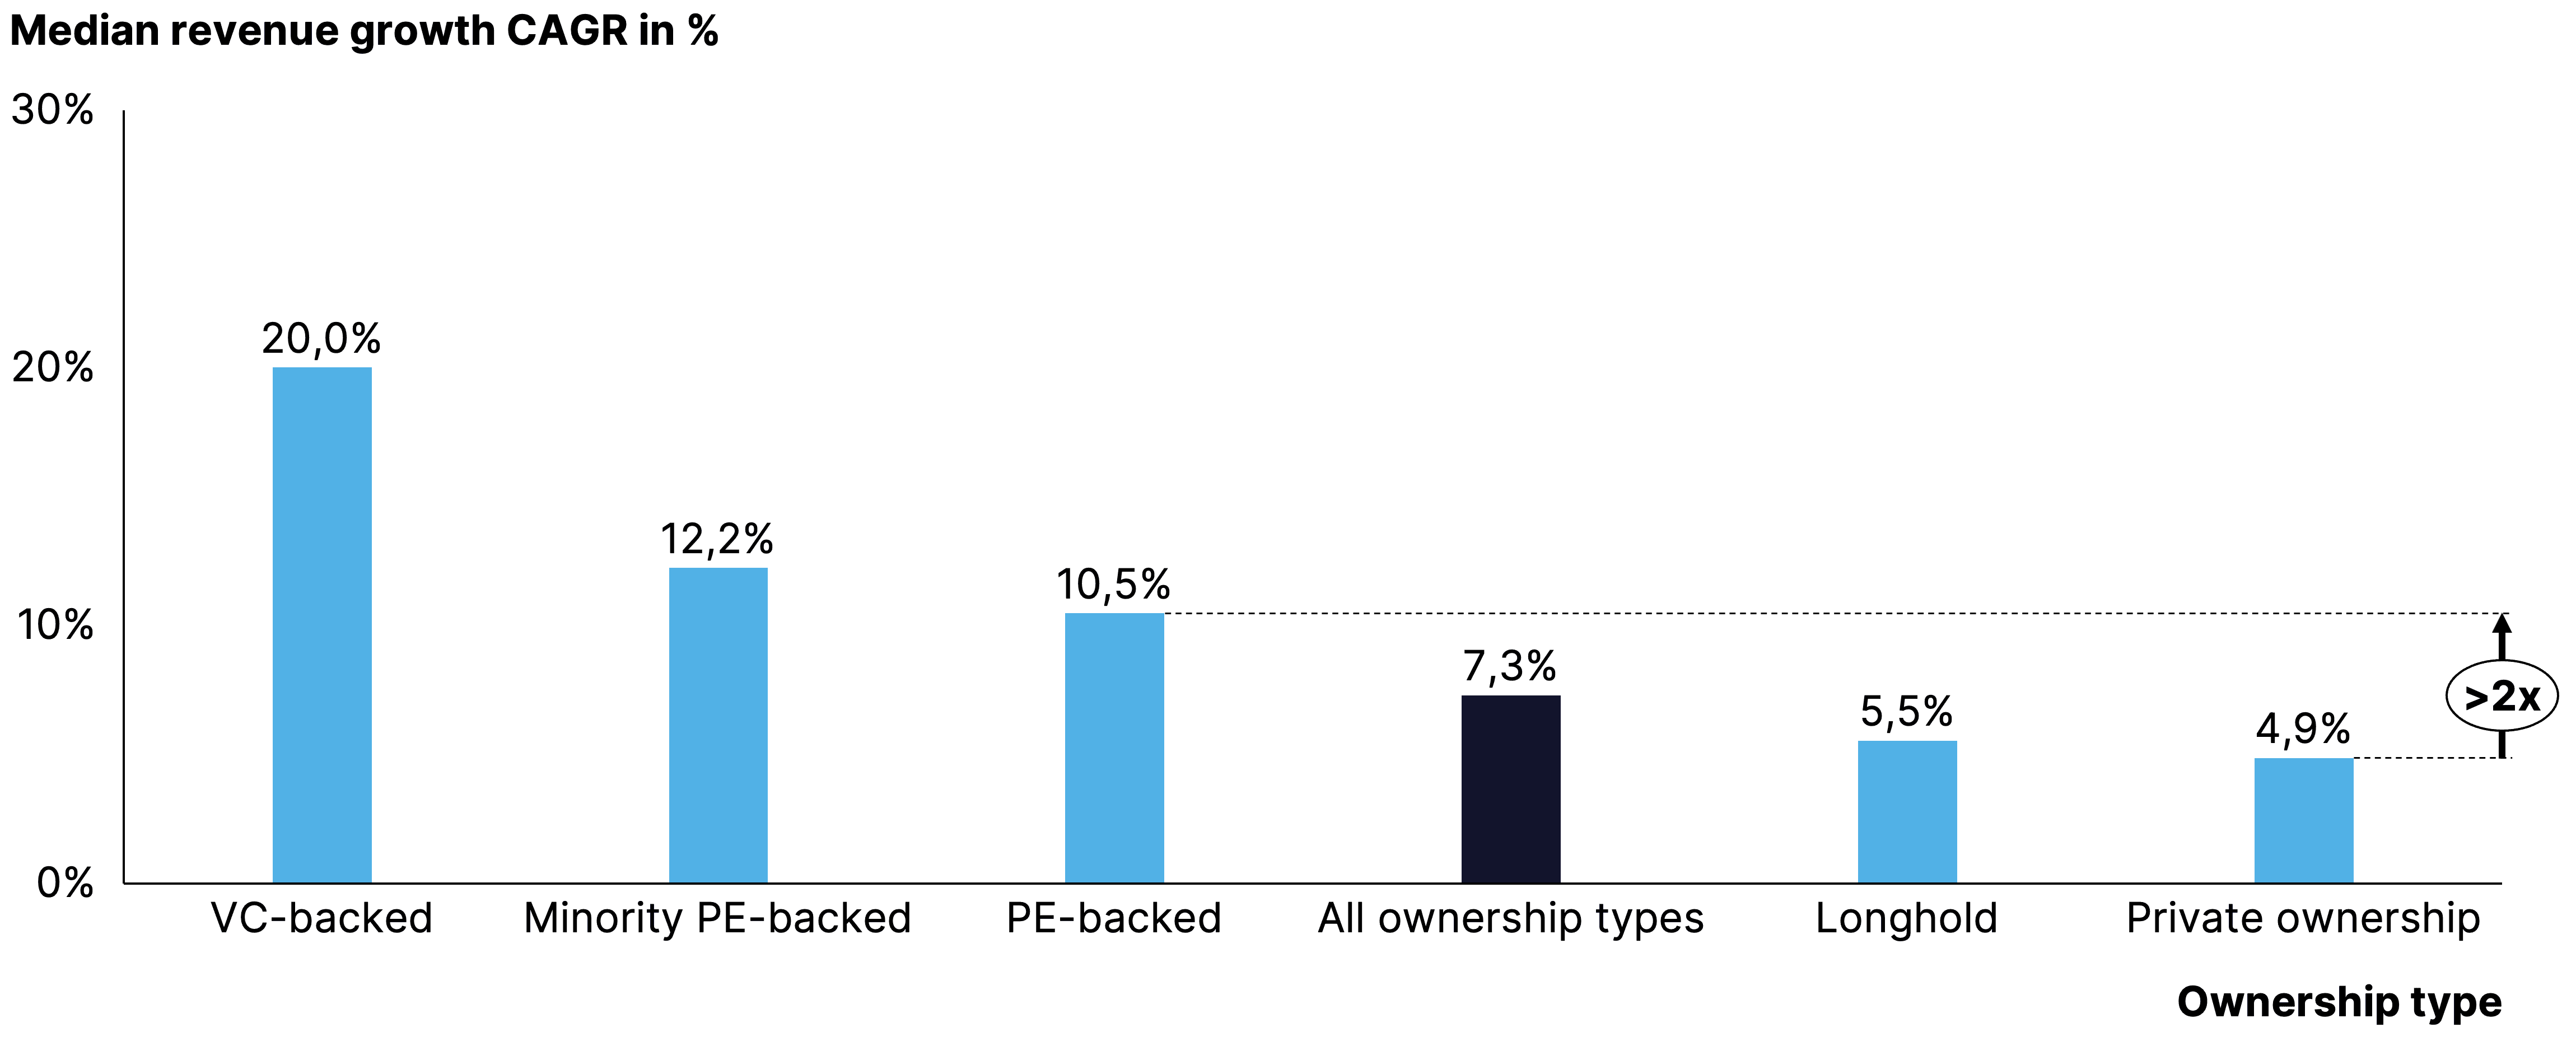
Moreover, our data shows that financial sponsors are differentially good at buying into growth and creating it. Analyzing revenue growth by ownership type, VC- and PE-backed companies outperform privately owned companies by a factor of 2-4x. VC-backed companies grew around 20% whereas PE-backed companies grew between 10-12% in the past years. Private companies on the other hand only managed to grow around 5%, slightly below the average of 7% across all ownership types. This vindicates the added value of VC and PE ownership in selecting growth assets and (likely) accelerating performance through financial resources and expertise.

It then becomes very interesting to decompose growth. As we find in our data, the median total growth of 8-10% is almost twice as high as the median organic growth of 4-6%. In the segment for the highest growth rates of above 15%, this becomes also evident where 24% of companies grow above 15% organically vs. 34% of companies growing above 15% in total. Buy-and-build is clearly a large component of overall topline expansion across the pool of European companies.

As alluded previously, PE-backed companies are better at capturing growth than privately owned companies. That begs the question of whether this is due to the higher buy-and-build activity for PE-backed companies or if it is driven by organic performance. Separately comparing the organic growth distribution of privately owned companies and PE-backed companies, it can be observed that PE-backed companies are in fact also better at capturing organic growth. Roughly 41% of privately owned companies grow above 4-6% organically whereas around 52% of PE-backed companies make that threshold. This can be due to both selection preferences by institutional investors as well as an ability to stimulate growth endogenously.
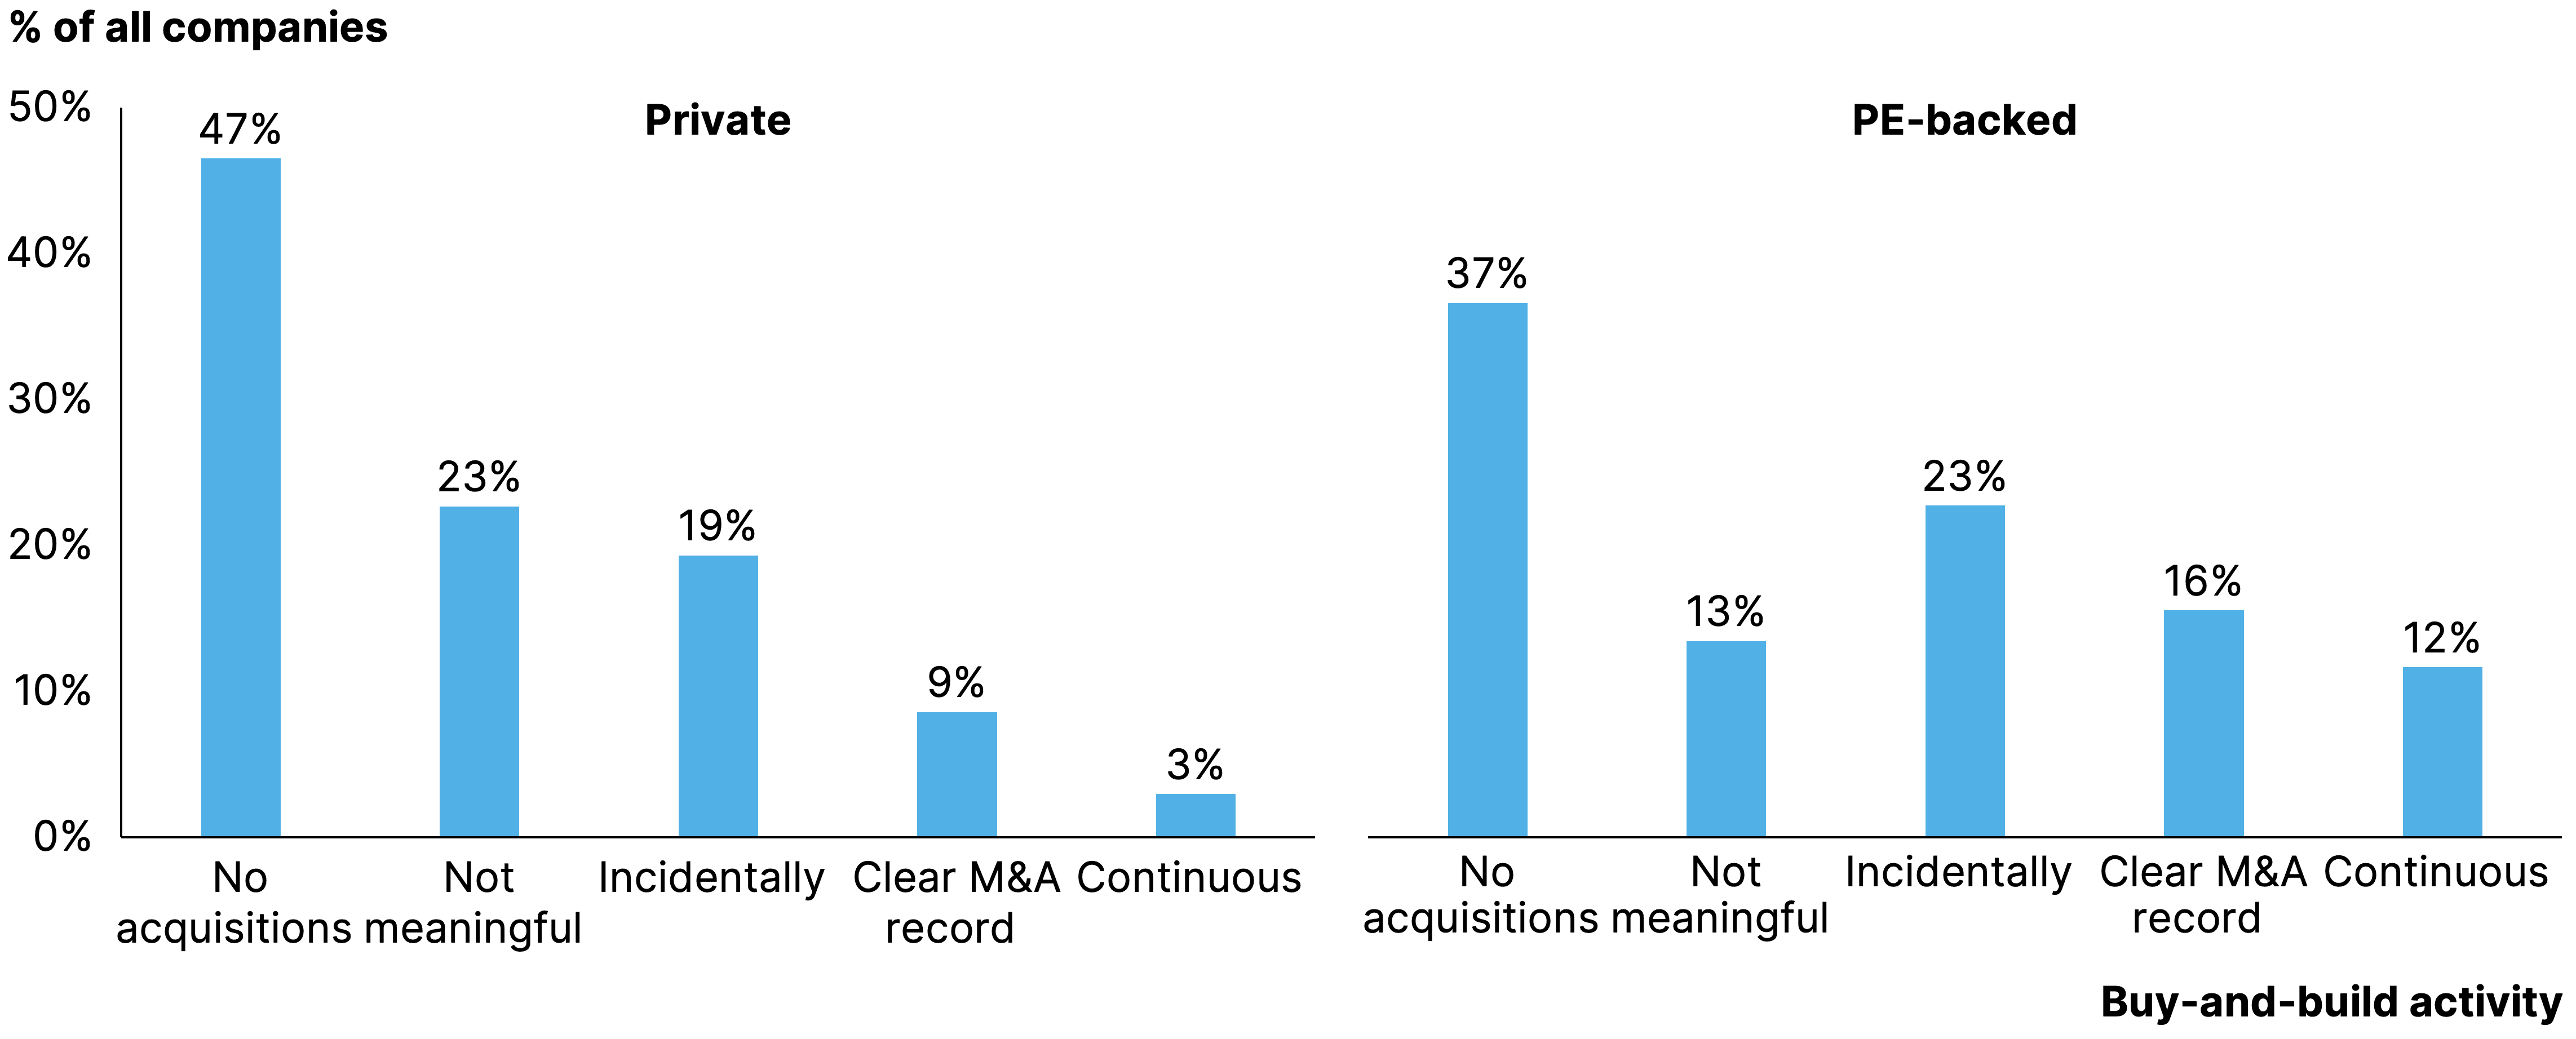
Looking at the second growth avenue – inorganic growth – PE-backed companies are also more active than their privately held peers. Almost half of the latter do not engage in buy-and-build whereas this share is around 10% lower for PE-backed companies. An active buy-and-build strategy is applied by 28% of PE-backed companies, meaning they acquire at least one company per year. This compares to only 12% for privately owned companies.
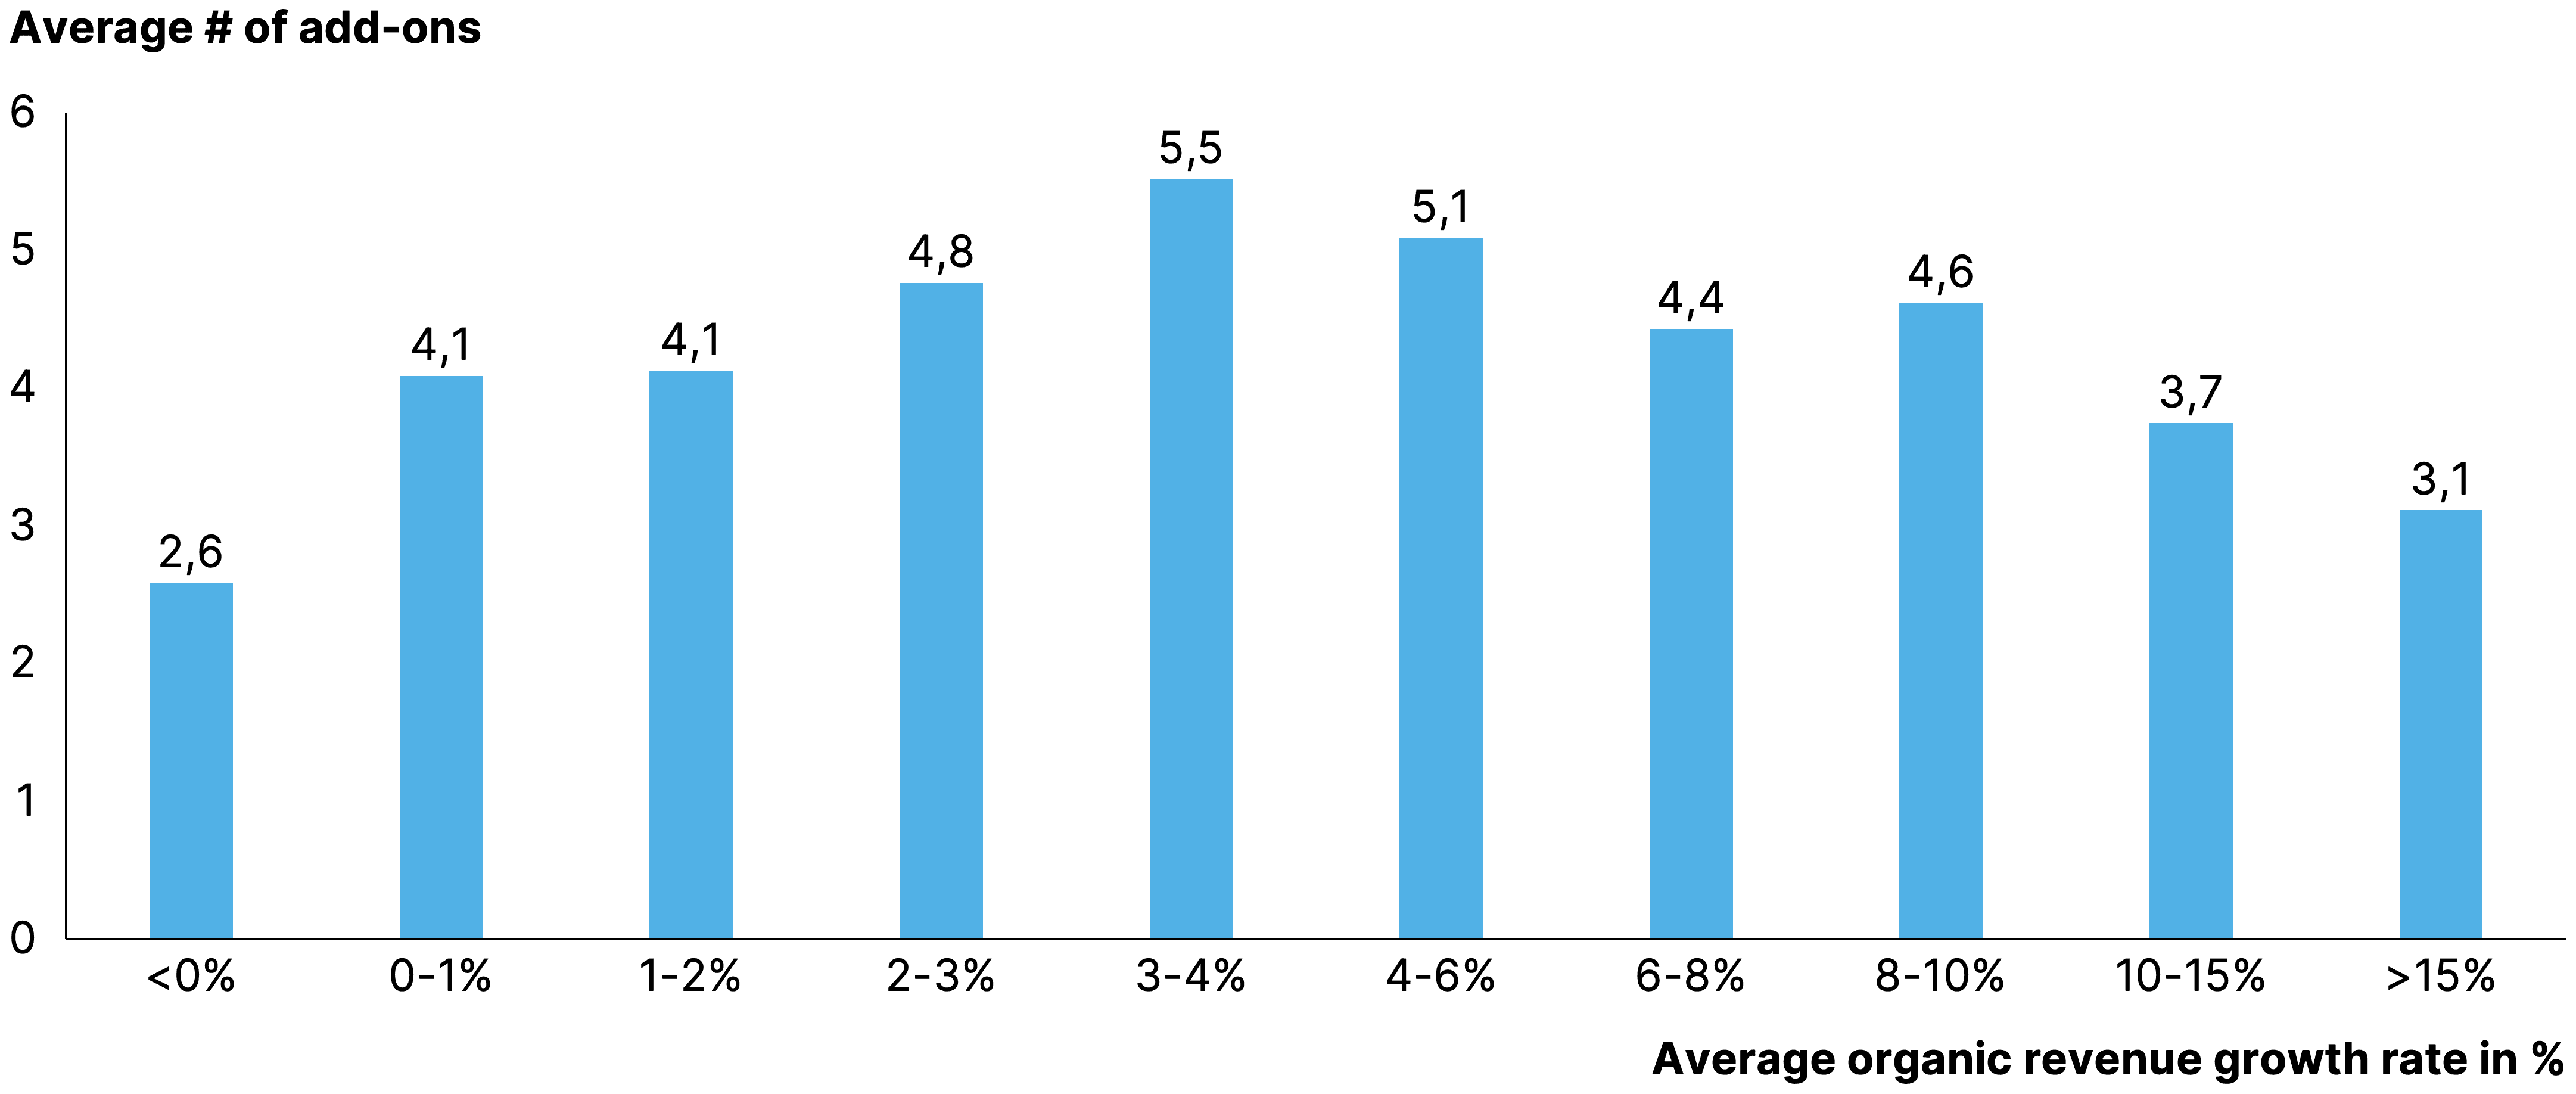
When does a PE investor rely on buy-and-build vs. other growth strategies such as organic growth? Companies showing mediocre organic growth especially show the highest buy-and-build activity, with roughly 5 add-on acquisitions per platform deal on average. Once companies reach an organic growth threshold of 8-10%, they rely less on buy-and-build to make their investment case. We do observe some buy-and-build activity even in the low-growth buckets of sub-2% organic growth. Digging into the underlying data, it links mostly to platform deals done by PEs with a focus on distressed deals and special situations. There, operational synergies and capacity utilization may be key drivers of acquisitions. Example investors include Mutares, Aurelius and Nimbus.

We now know that PE-backed companies are better at capturing growth both organically and through acquisitions. As there are more avenues for generating value than topline, it is also important to look at operational improvements. Crunching the data, PE and VC-backed companies are also better at realizing margin expansion. During a 4-year time horizon (2017 to 2021), PE-backed companies were able to improve their EBITDA margins by 1.1 percentage points whereas privately owned companies were only able to realize an improvement of 0.6 percentage points. VC-backed and minority PE-backed companies were able to realize an improvement of 1.6 percentage points.
Part of the higher margin expansion can be explained by organic growth and buy-and-build. The higher organic revenue growth can translate into lower operating leverage and therefore better margins. Furthermore, buy-and-build can translate into cost synergies which can also result in a margin improvement. Lastly, the higher margin expansion of PE-backed companies can be explained by the overall focus on operational improvements by investors. While we cannot decompose the relative contributions of these elements, an interplay of such factors is most likely. Interestingly, longhold assets (held by PEs without a fund structure and/or typical exit window) do not show margin improvement outperformance. This may imply the pressure of an exit is an important stimulus for operational enhancement.
Growth leaders
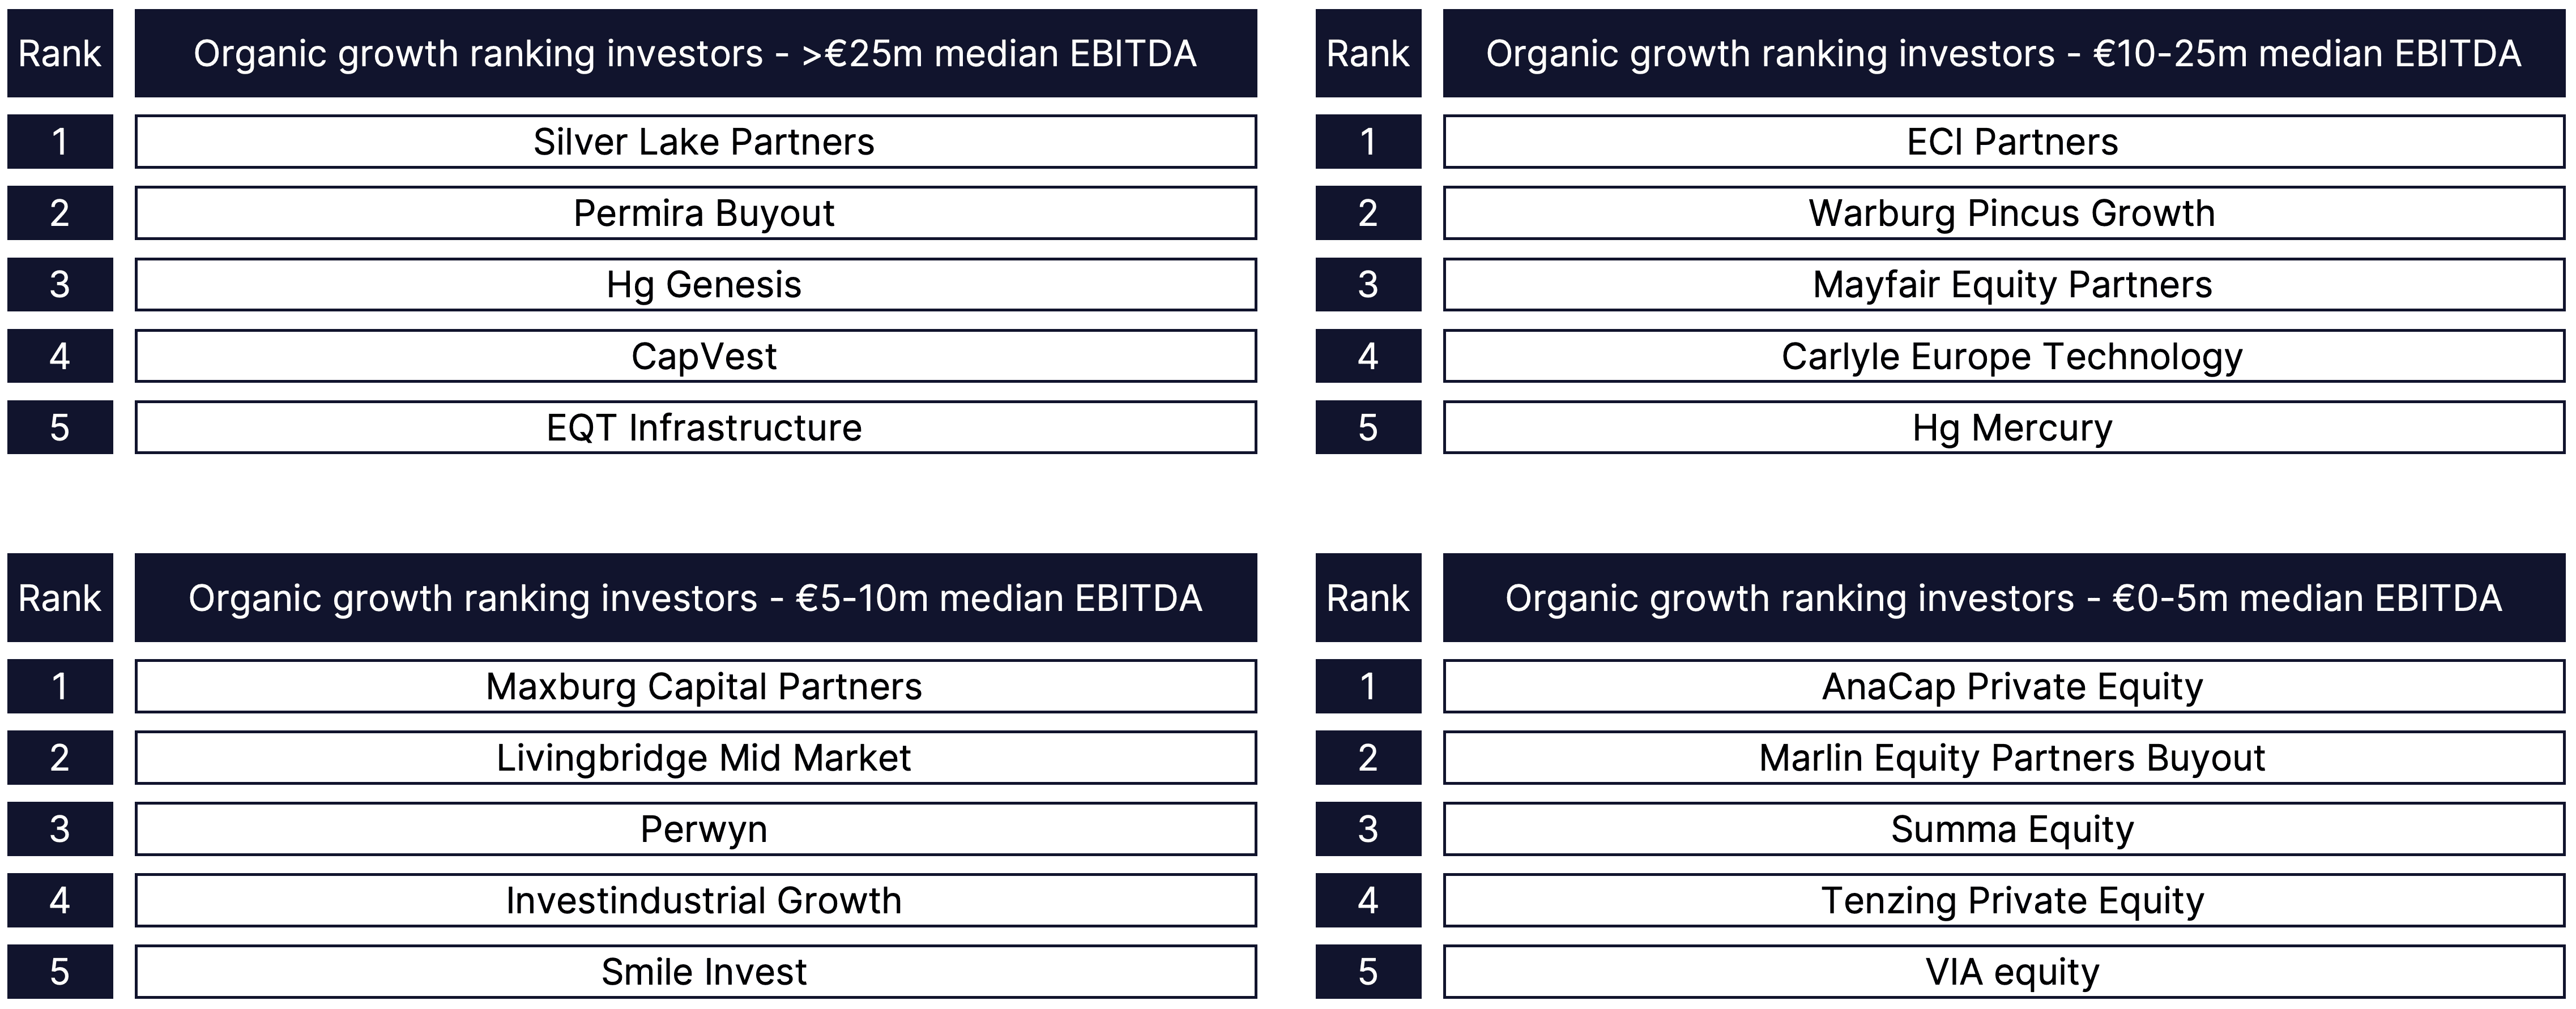
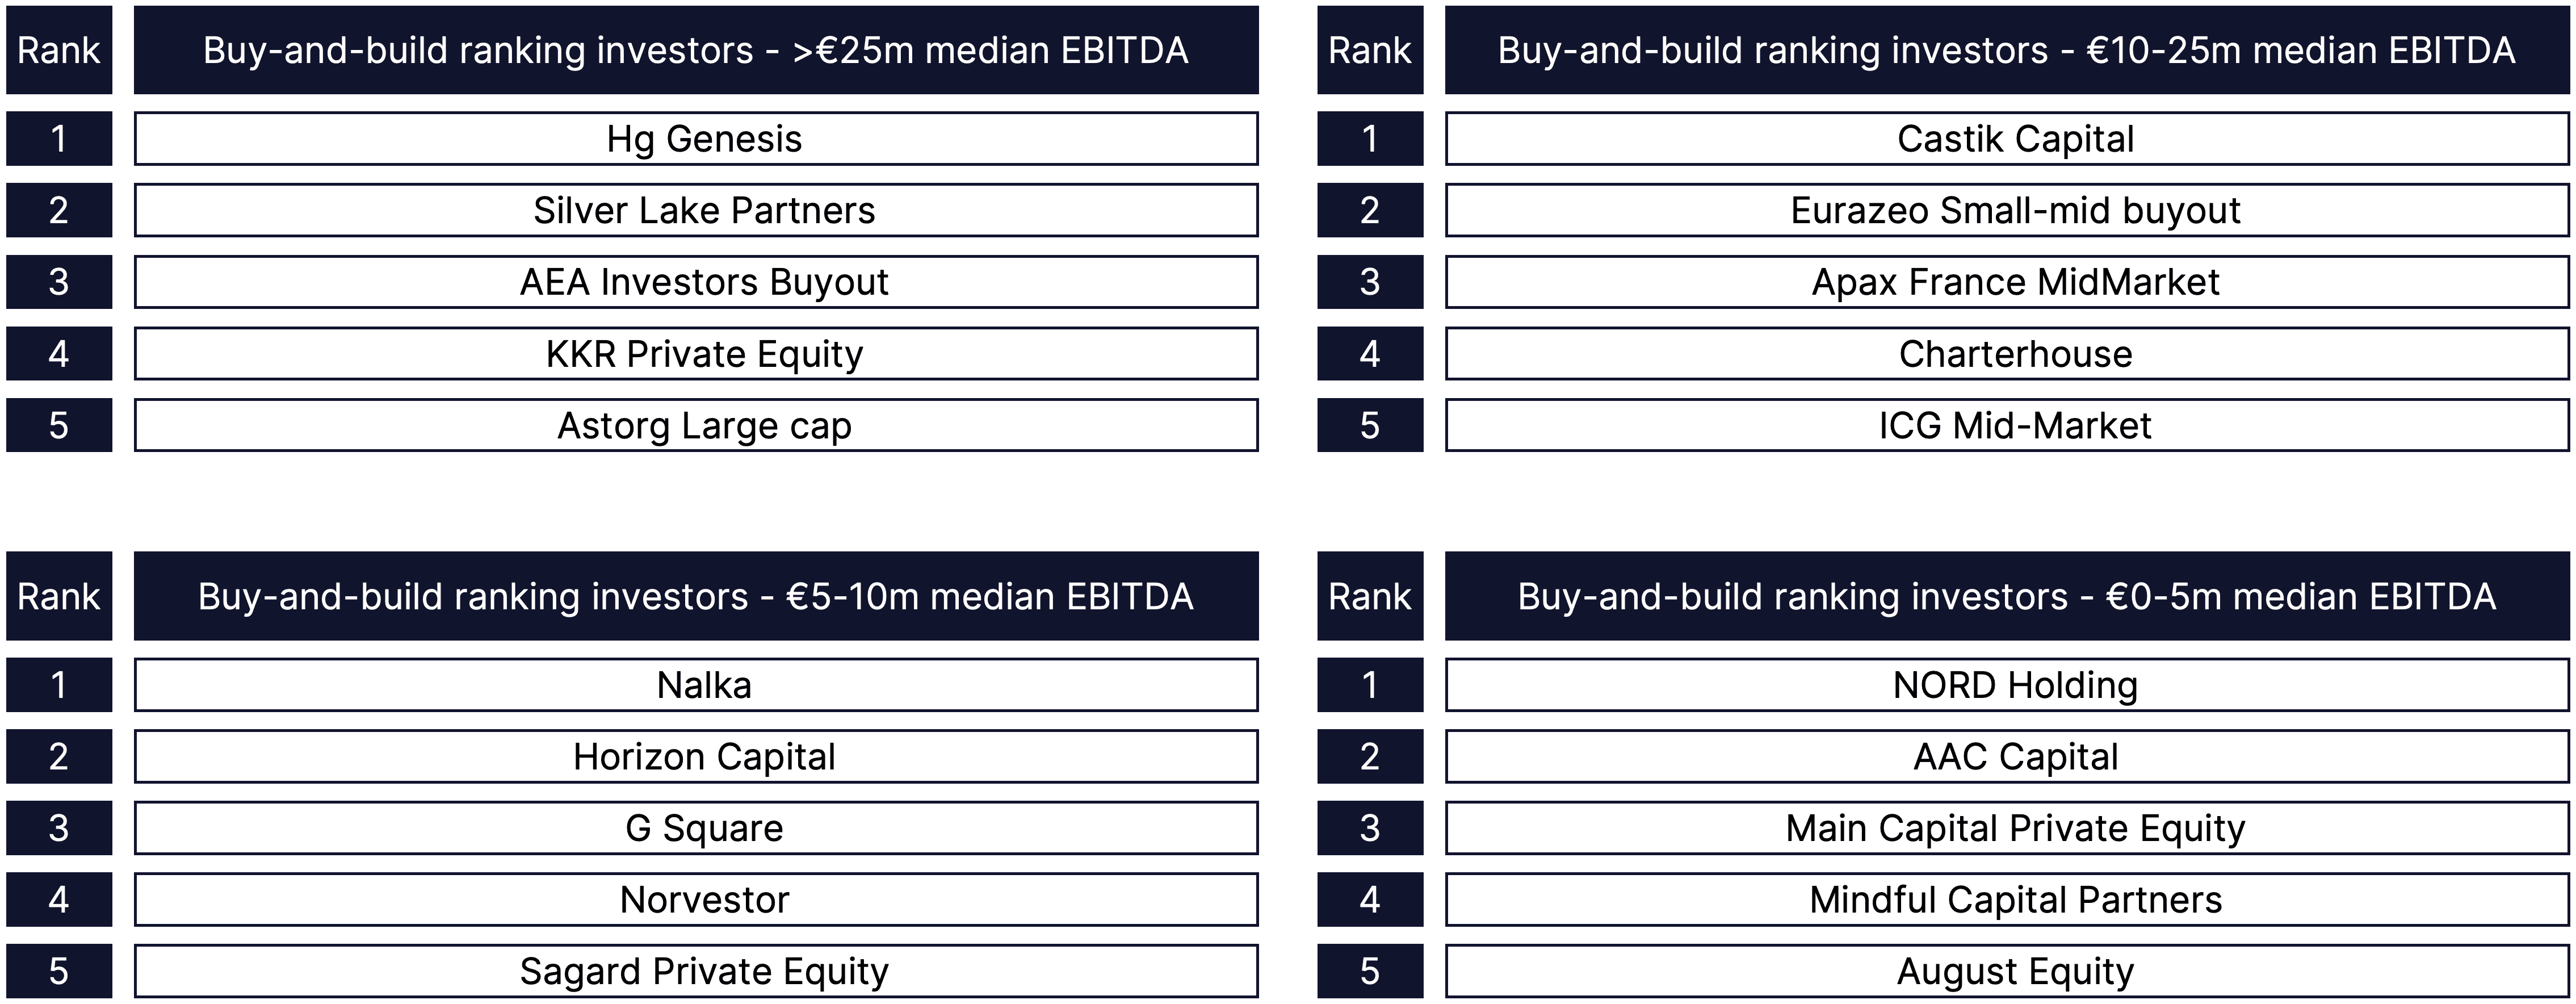
Until now we have looked at averages. But what if we go into the granular detail of individual investors? Which ones are leading the way? Below, we highlight players by segment that, within their segment, perform differentially well at capturing organic growth. Importantly, we analyzed these players at the level of investment strategies rather than looking at PE houses overall or at individual funds. At their strategy-level, we analyze the mean performance of their underlying portfolios. Doing so through this methodology for both organic growth and buy-and-build, we unearth two respective sets of leaders in capturing these forms of topline growth.
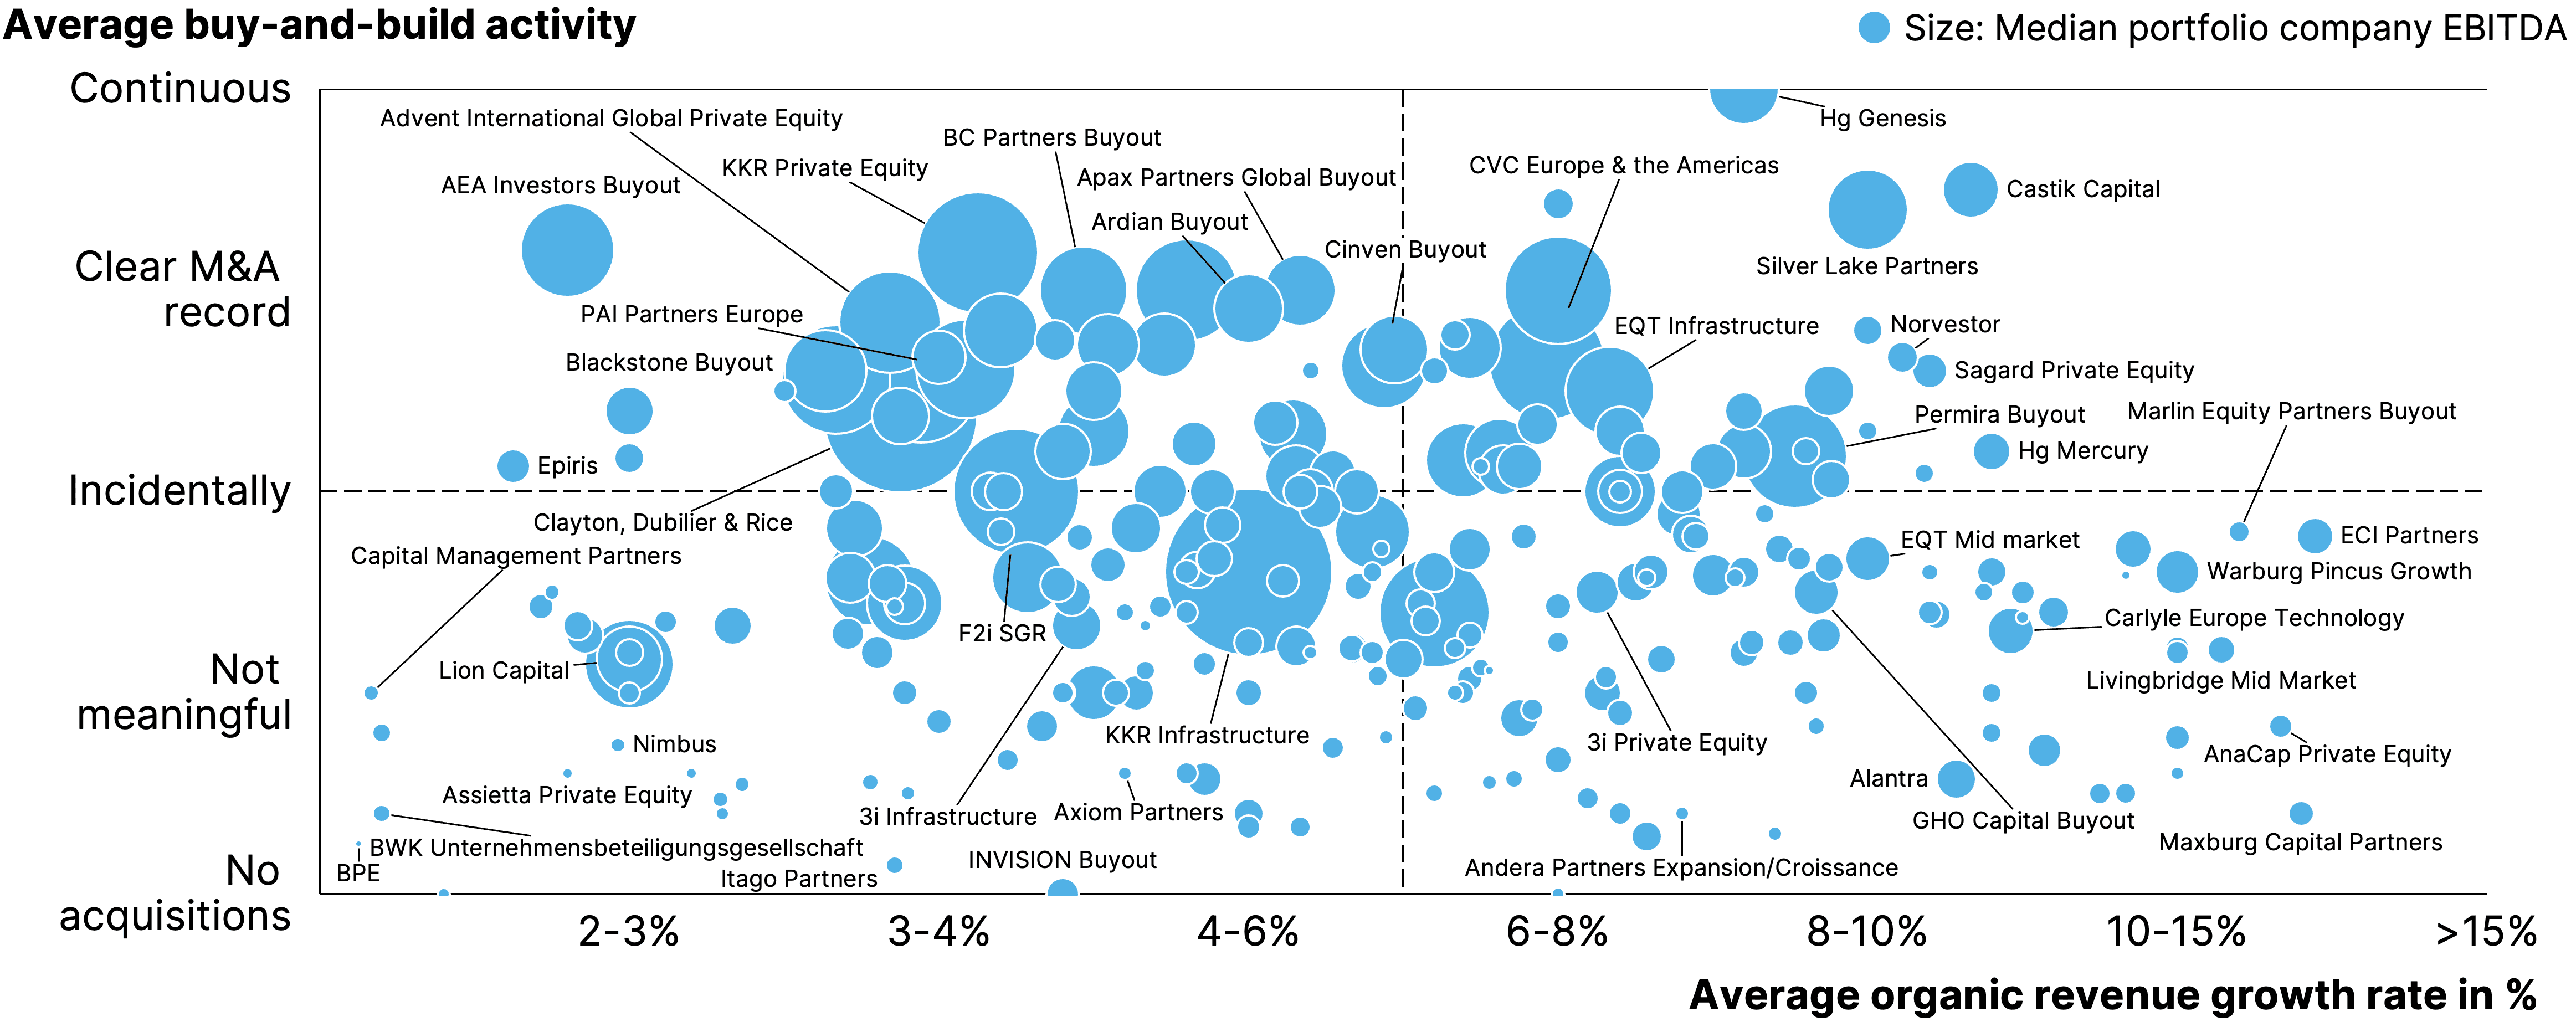
Now, it is even more interesting to plot both the elements of organic growth and buy-and-build against each other. This offers a detailed perspective on how investment strategies differ across virtually all investors.
We subsequently repeat the plotting, but now replace the buy-and-build rating with the average EBITDA margin of portfolio companies. This offers a further perspective of how PEs vary in their investment preferences.
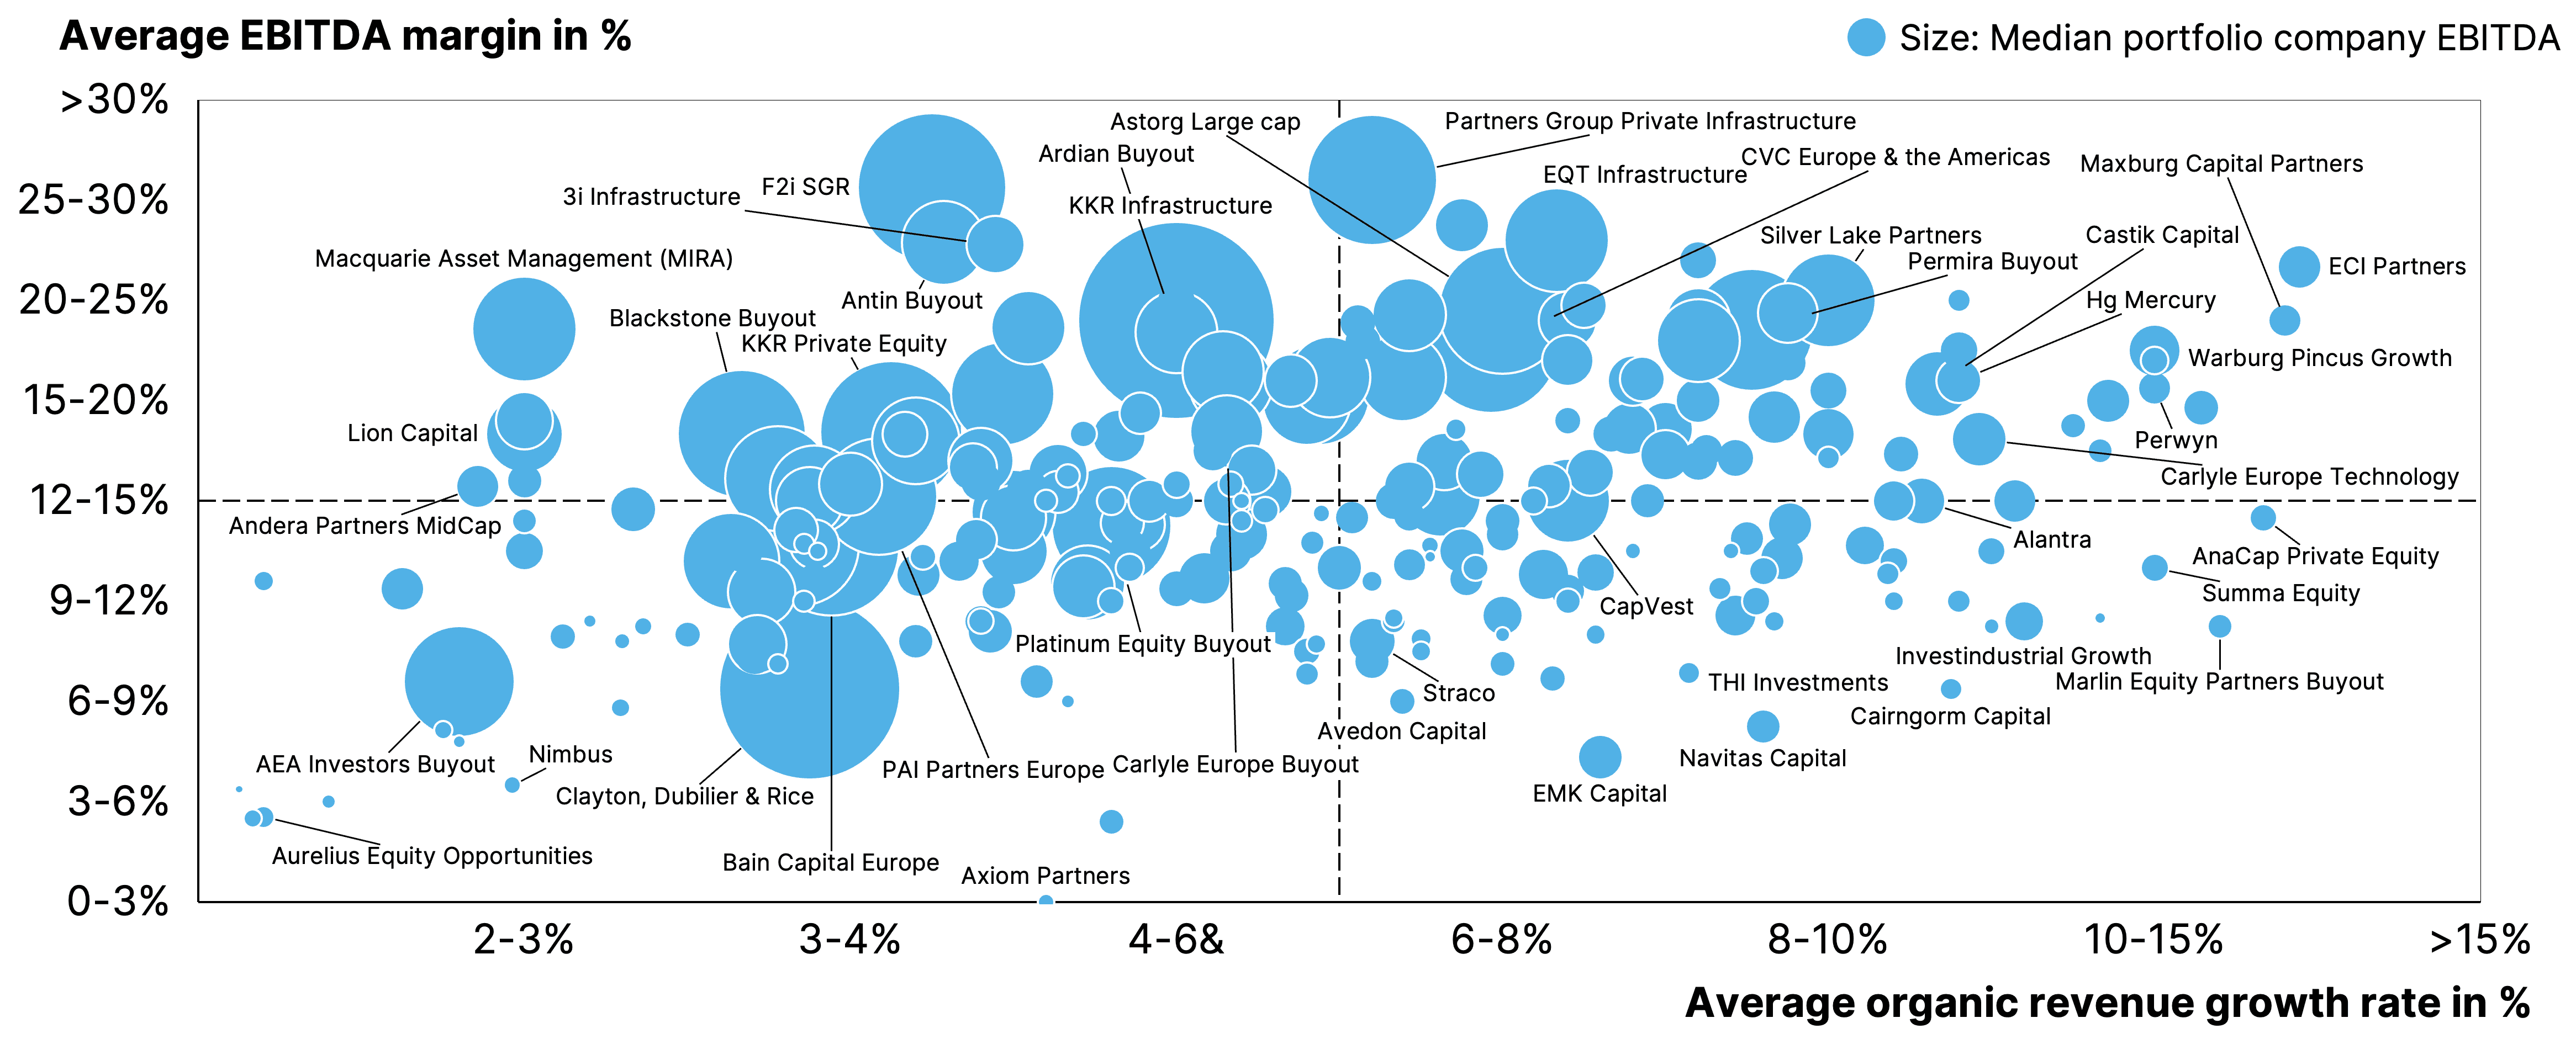
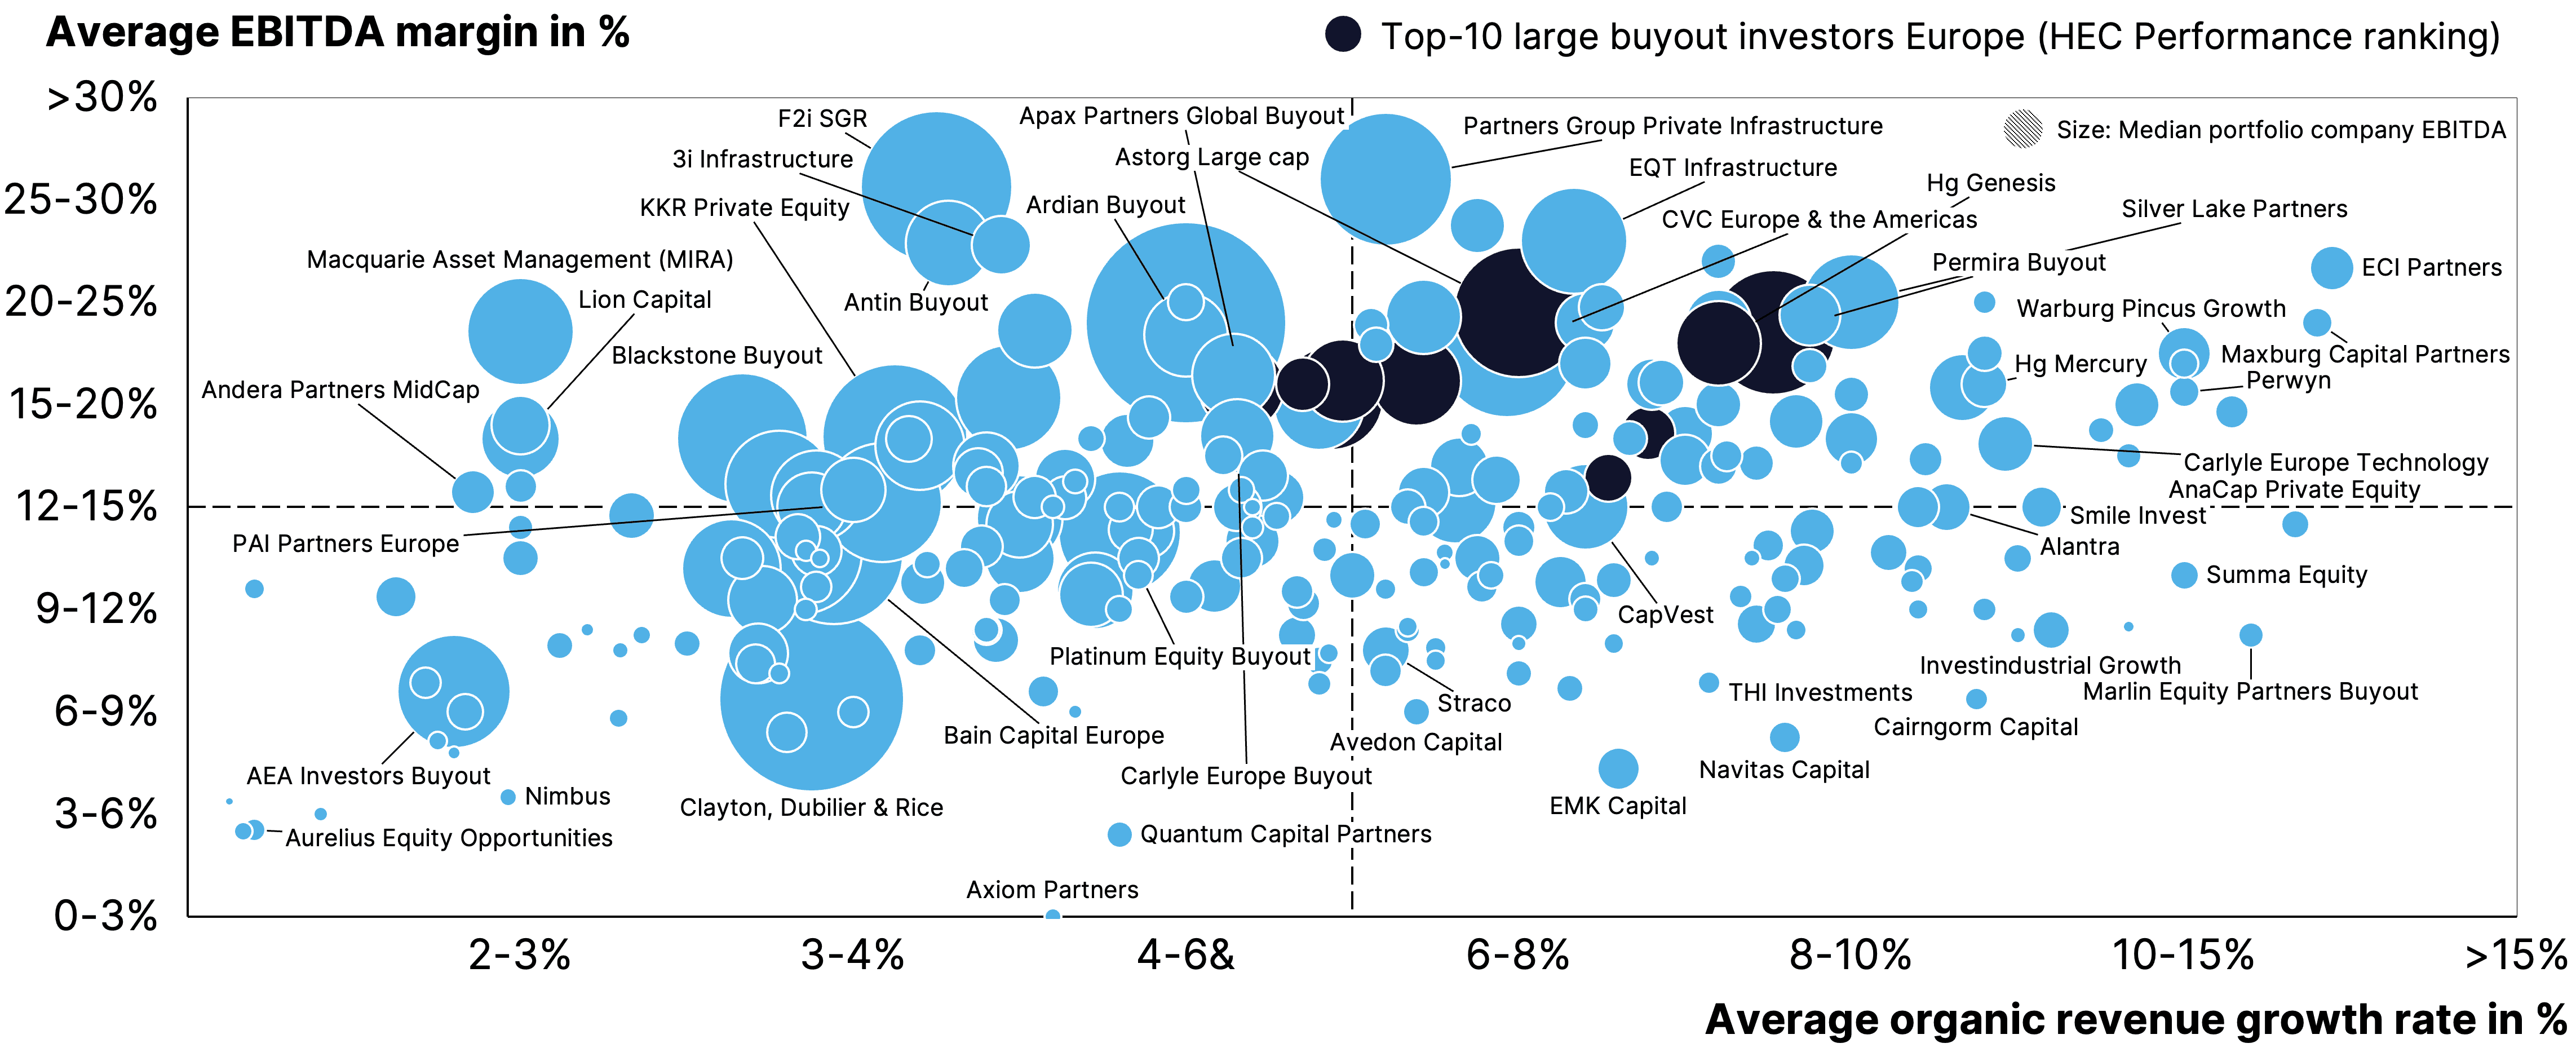
At this point, it is important to point out that being bottom left or top right at face value says nothing about being a good or bad investor. It merely analyzes the quality of the portfolios. But of course, bottom right can be filled by great turnaround investors or value buyers. On the flip side, top right houses might be overpaying for growth and margin. However, while there are certainly some great investors in the bottom right quadrant, we do find that being exposed to organic growth and driving buy-and-build often correlates with strong historical performance. In fact, when showing the top-10 performers in HEC’s well-cited performance ranking, we find that they are exclusively top right. When checking the same when bringing in the EBITDA margin-axis, the point on outperformance holds.
Further research confirms this notion. In fact, the vast majority of the HEC Paris-DownJones 2022 large buyout performance rankings winners demonstrate those characteristics: organic revenue growth, an active buy-and-build strategy and focus on profitability. This again does not mean every investor should follow the same strategy, but it surely proves that looking closely at unearthing growth and consolidation opportunities is a worthwhile pursuit.

Notes: Ranking refers to investors whose portfolios comprise at least 5 companies. Additionally, the calculation is based on portfolio companies’ last 5-year buy-and-build activity and average organic revenue growth. Source: Gain.pro; HEC Paris
Notes: Ranking refers to investors whose portfolios comprise at least 5 companies. Additionally, the average organic revenue growth and average EBITDA margin calculation is based on portfolio companies’ last 5-year financial statements. Source: Gain.pro; HEC Paris
Table of Content
Chapter 2: Capturing organic growth
A sector approach reveals that organic growth is most prevalent in TMT and other ‘usual suspects.’ However, when digging deeper into underlying niches, the picture becomes much more dispersed.
In fact, while a sector approach is useful to find fast-growing clusters, a lot of outperformance takes place at the company level, with many fast-growing champions hiding out in lower-growth sectors and industries.
Growth needs to be weighted against other key investment criteria such as profitability, cash conversion and cyclicality. The perfect asset hardly exists and may also be prohibitively expensive to acquire.
Pockets of growth
The previous chapter has shown that there remains plenty of organic growth opportunities and that many investors are excelling at capturing them. This begs the question of where such organic growth can be found. The following analyses aim to unearth the main pockets of growth at increasing levels of granularity. Herein, we will also weigh in profitability and cyclicality, since both are deemed key investment criteria weighed in by many PE investors.
We will start out by taking a high-level view of the main sectors. Looking at organic growth rates at this level, it can be observed that TMT, showing an average organic growth rate of 8-10%, is performing best. It is followed by the financial services and science & health sectors. In contrast, the industrials sector, with an average organic growth rate of 4-6%, followed by materials & energy and consumer are the sectors growing below the overall sector average.
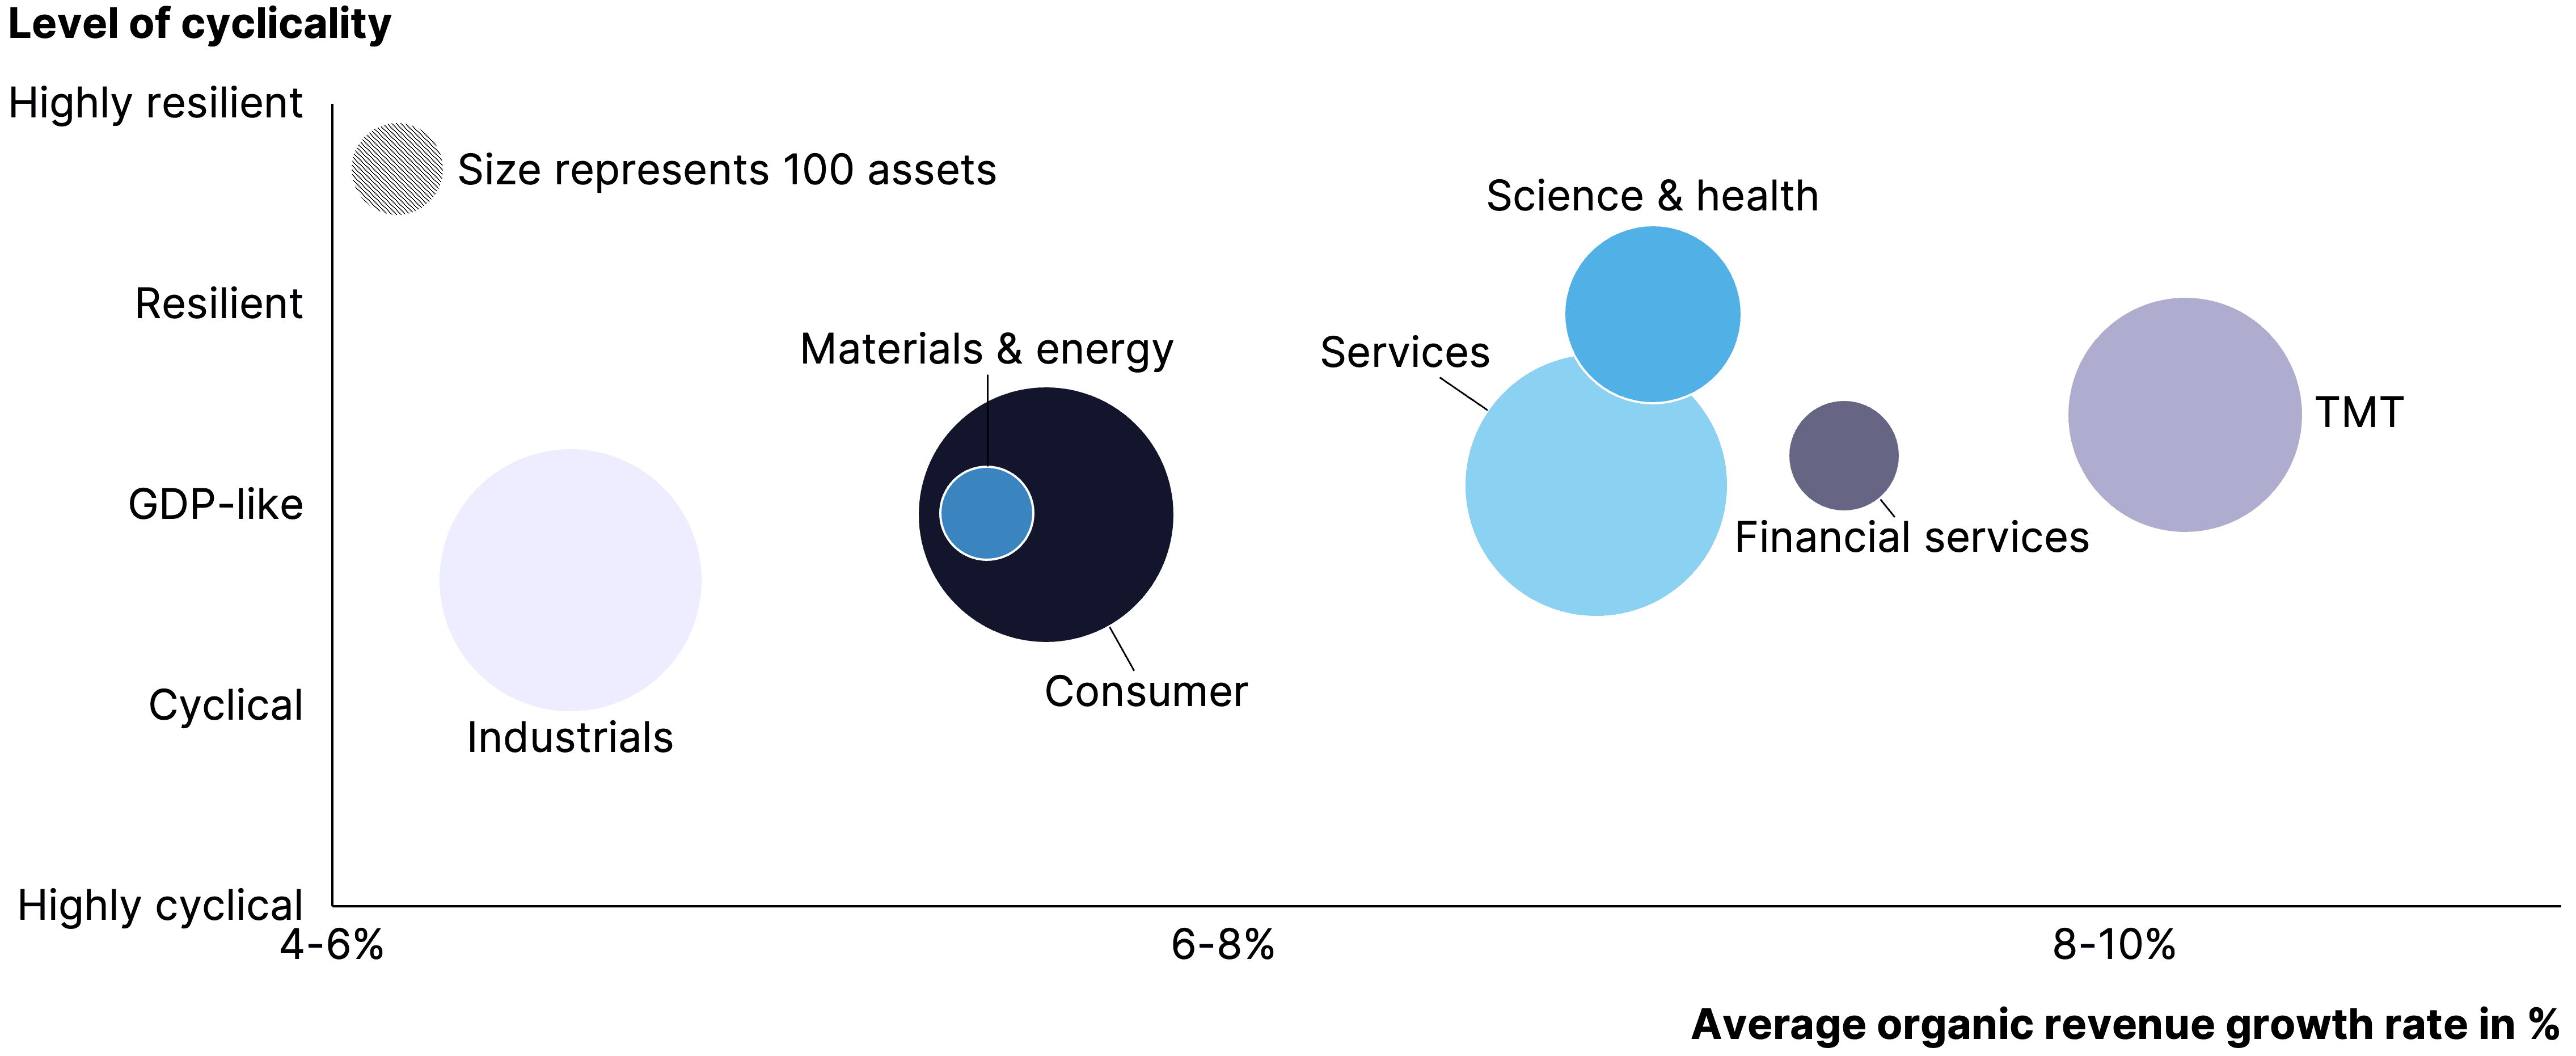
As pointed out before, it is important for investors to weigh in cyclicality to gauge the endurance of historical organic growth. As expected, the science & health sector stands out as the least cyclical sector. Overall, the slower-growing sectors industrials, materials & energy and consumer are more cyclical than the faster-growing sectors TMT, financial services and services. This indicates an increased interest in the organically faster-growing sectors from an investor’s perspective since they comprise both higher growth and lower cyclicality.
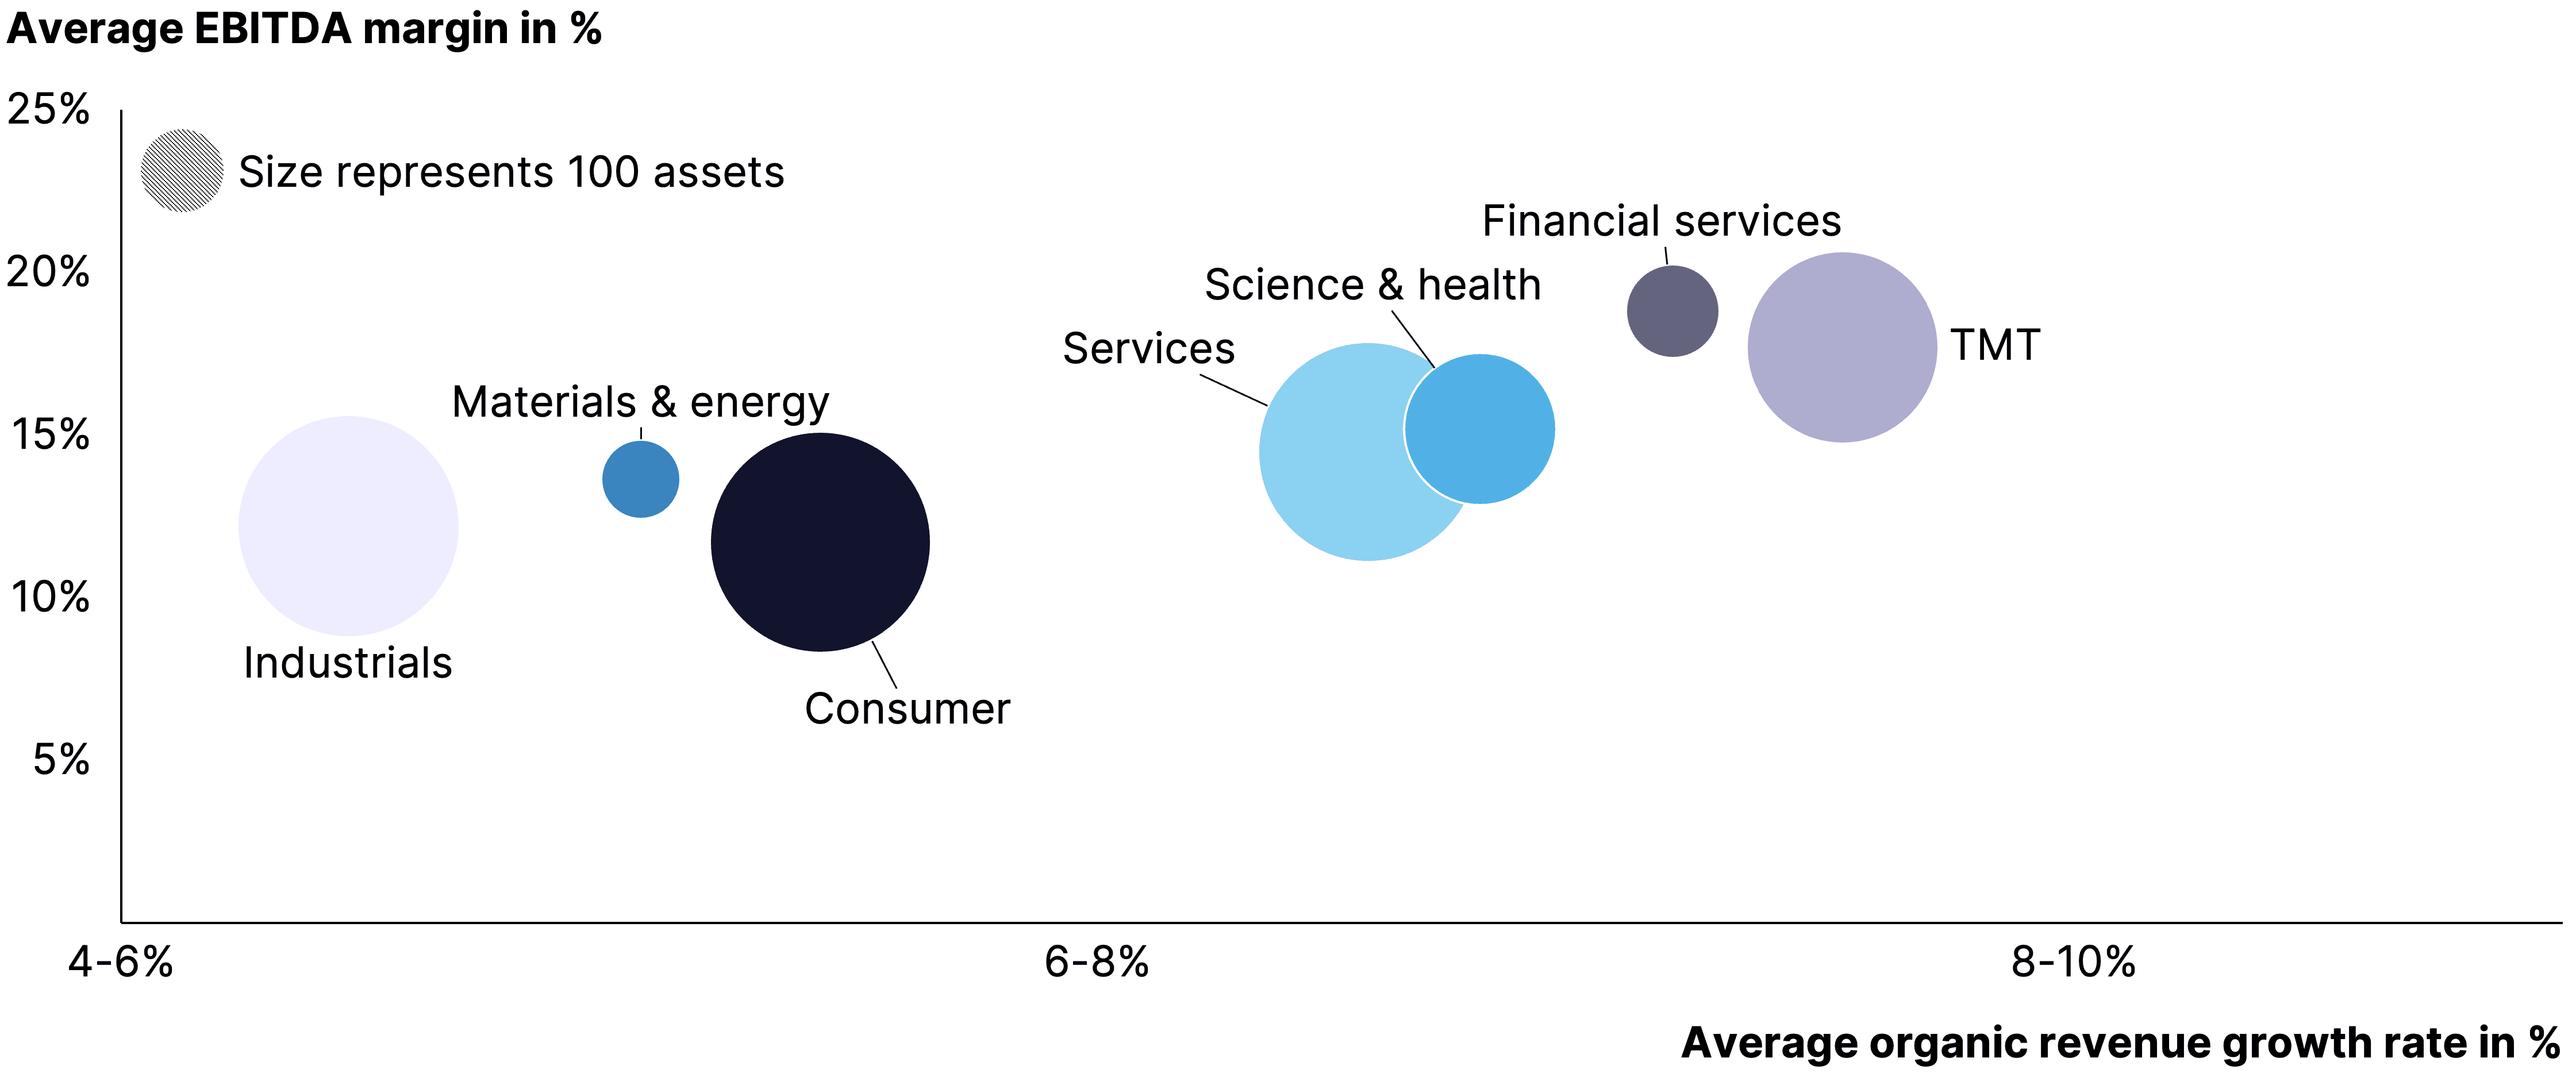
Taking profitability (in the form of EBITDA margin) into account, it can be observed that the organically faster-growing sectors outperform the slower-growing ones. Financial services, followed by TMT, is leading the board. In line with the ranking of sectors on the organic growth vs. cyclicality chart, the slower-growing sectors also show the lowest profitability. More specifically, consumer stands out as the least profitable sector followed by industrials and materials & energy.
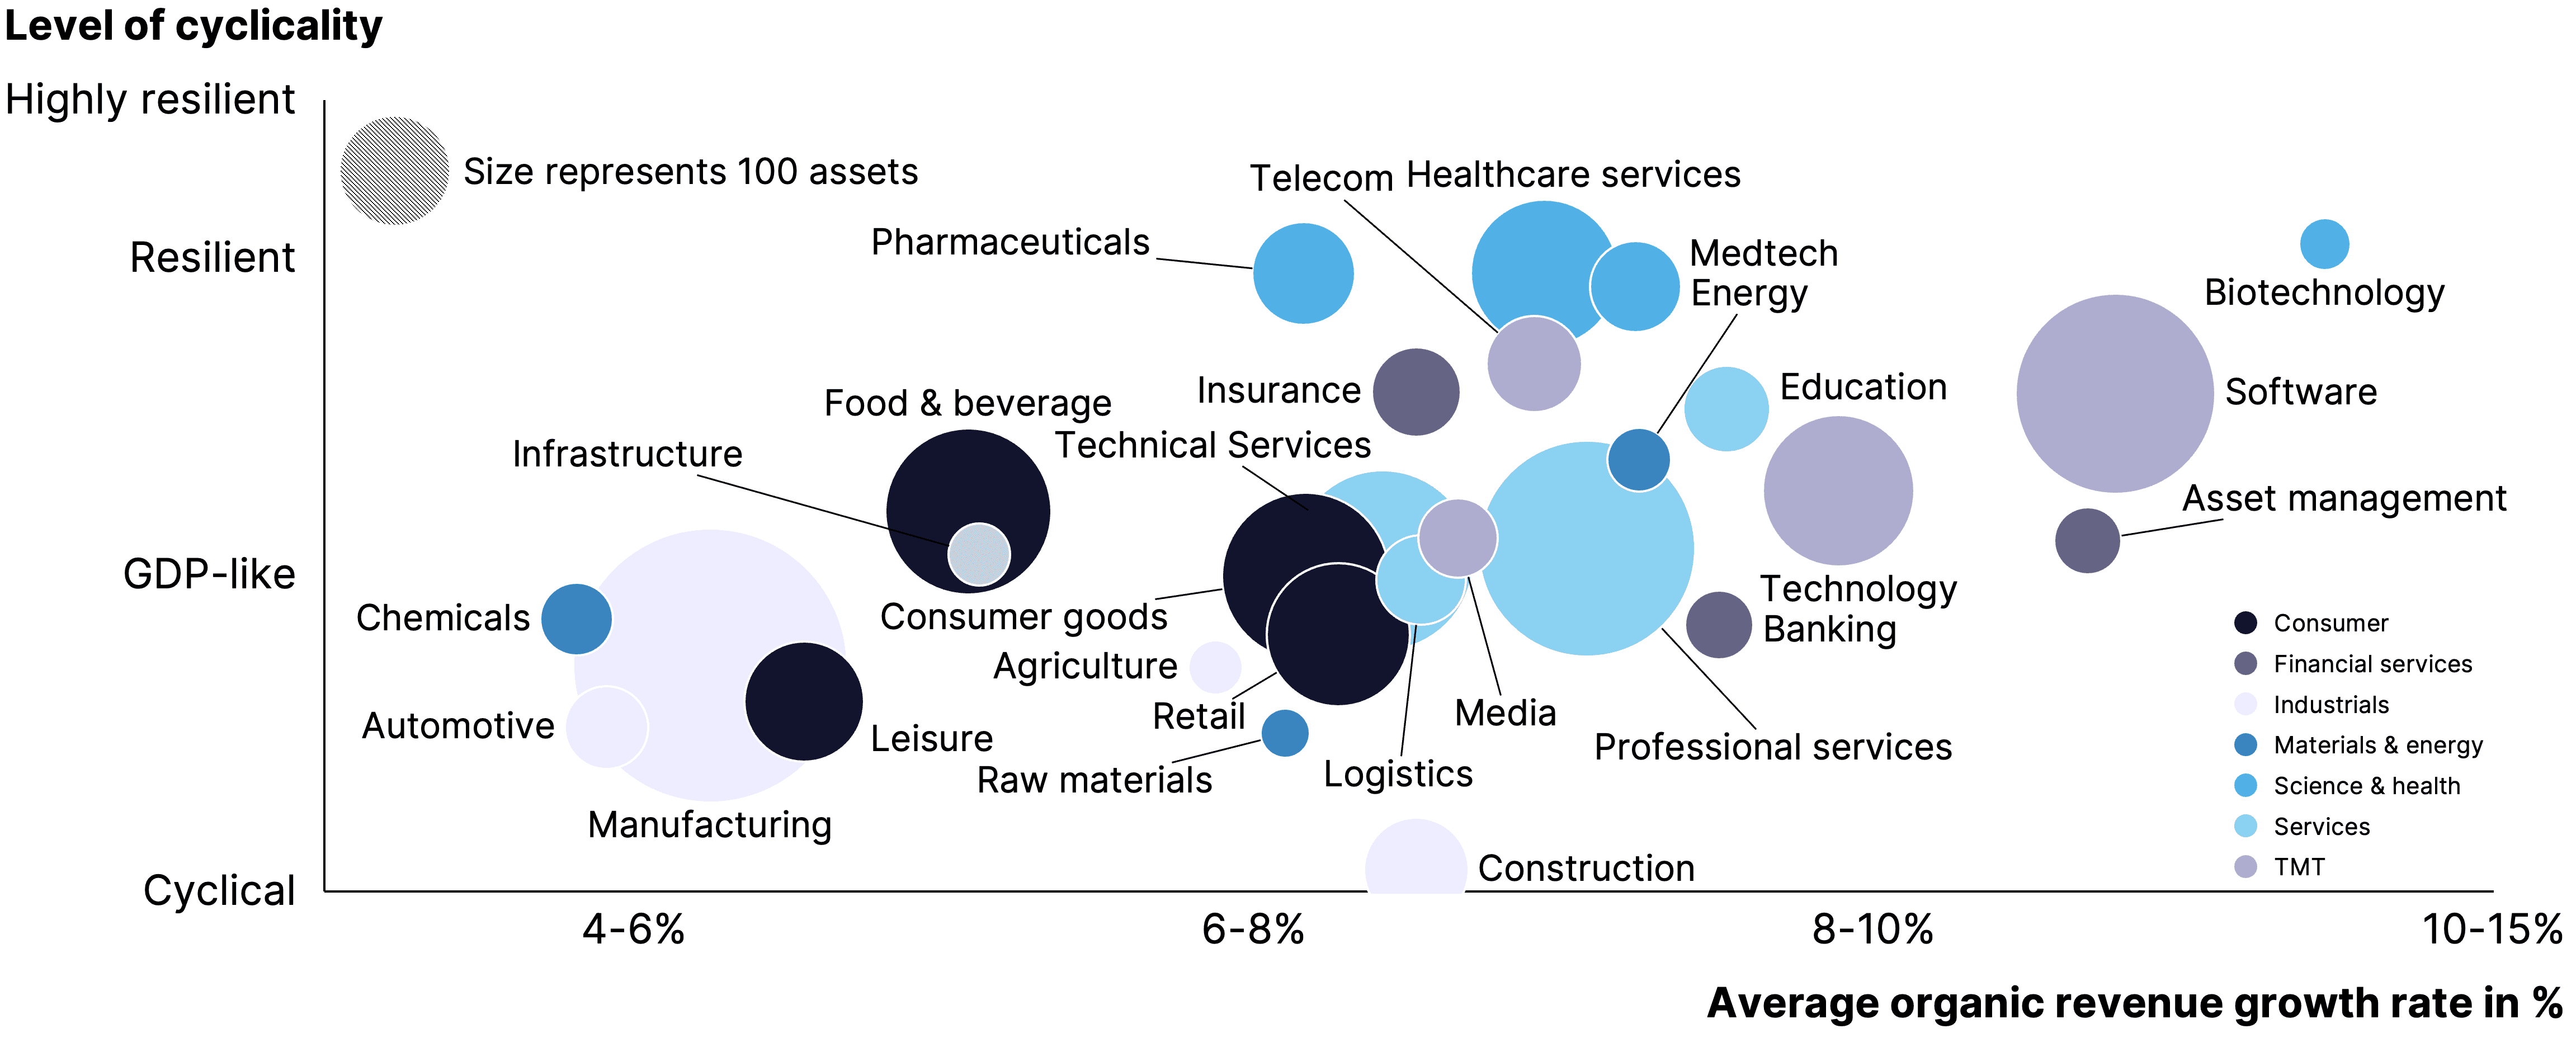
Going one layer deeper and looking at organic growth, cyclicality and profitability from a subsector perspective, the picture gets a bit more dispersed. Overall, all science & health subsectors stand out as most resilient but more diverse in organic revenue growth, with pharmaceuticals growing the slowest (6-8%) and biotechnology the fastest (10-15%). For other sectors, the more granular approach to capture organic growth reveals more diverse insights: While consumer goods demonstrates average performance in terms of organic revenue growth (6-8%) and cyclicality (GDP-like), leisure stands out in the consumer sector as slowest-growing and most cyclical. Furthermore, media is underperforming the other TMT subsectors in terms of both cyclicality and organic revenue growth. Unsurprisingly, construction stands out as the most cyclical sector but has demonstrated the highest organic growth rates in the industrials sector (6-8%) in the past.
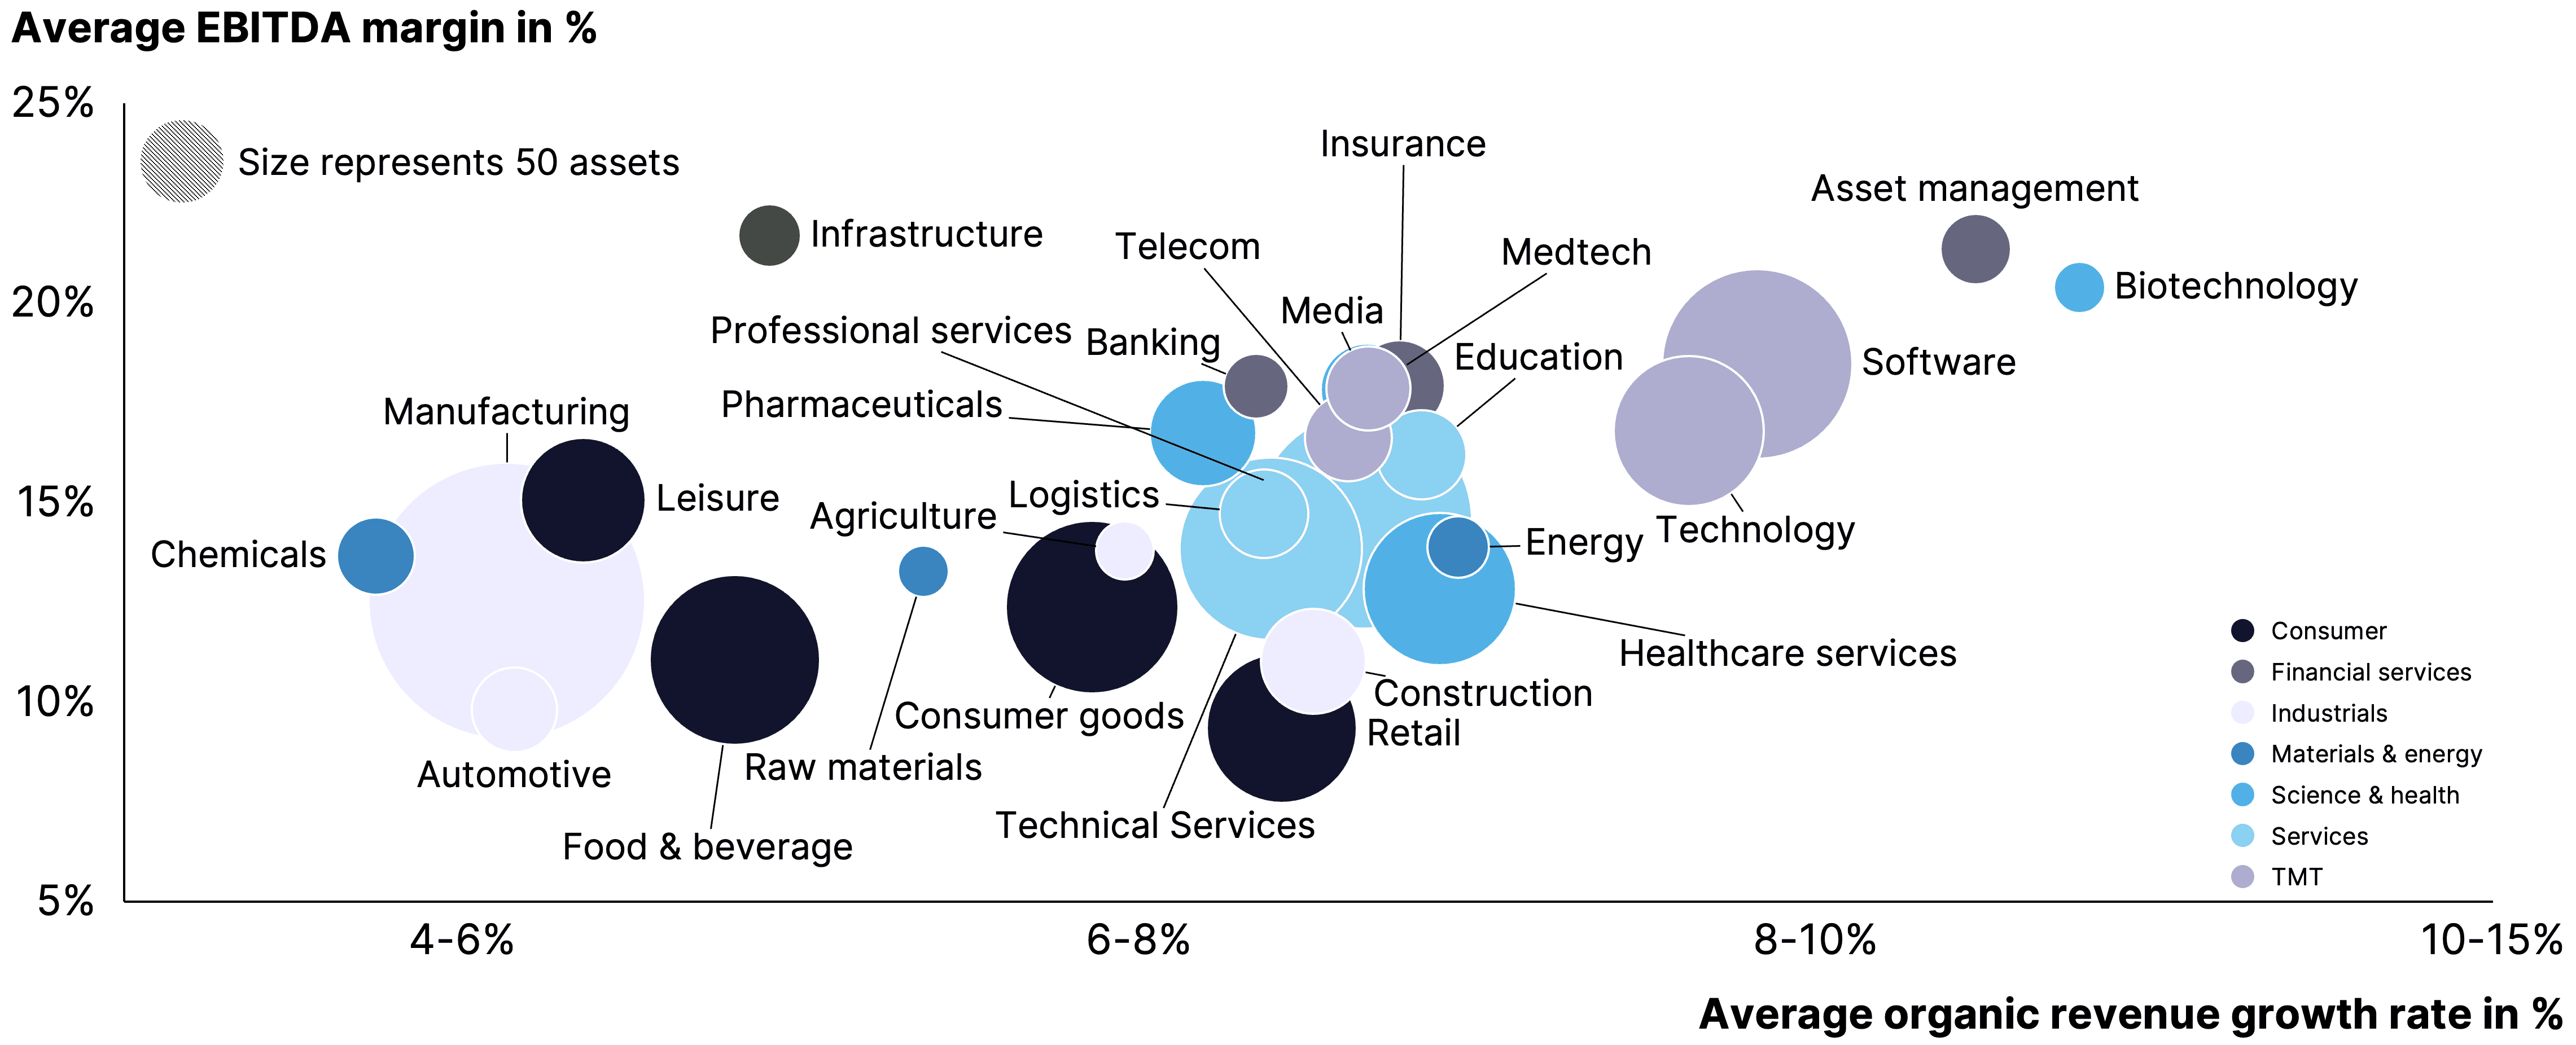
Taking profitability into account on a subsector level, the asset management and biotechnology subsectors stand out in both profitability and organic growth. In contrast, the least profitable subsectors are automotive and retail, with automotive also being one of the slowest growing subsectors (4-6%). This goes in line with the development of the automotive sector, mainly the suppliers, in recent years. Lastly, the subsectors software and technology perform well as expected in both organic revenue growth (8-10%) and profitability.
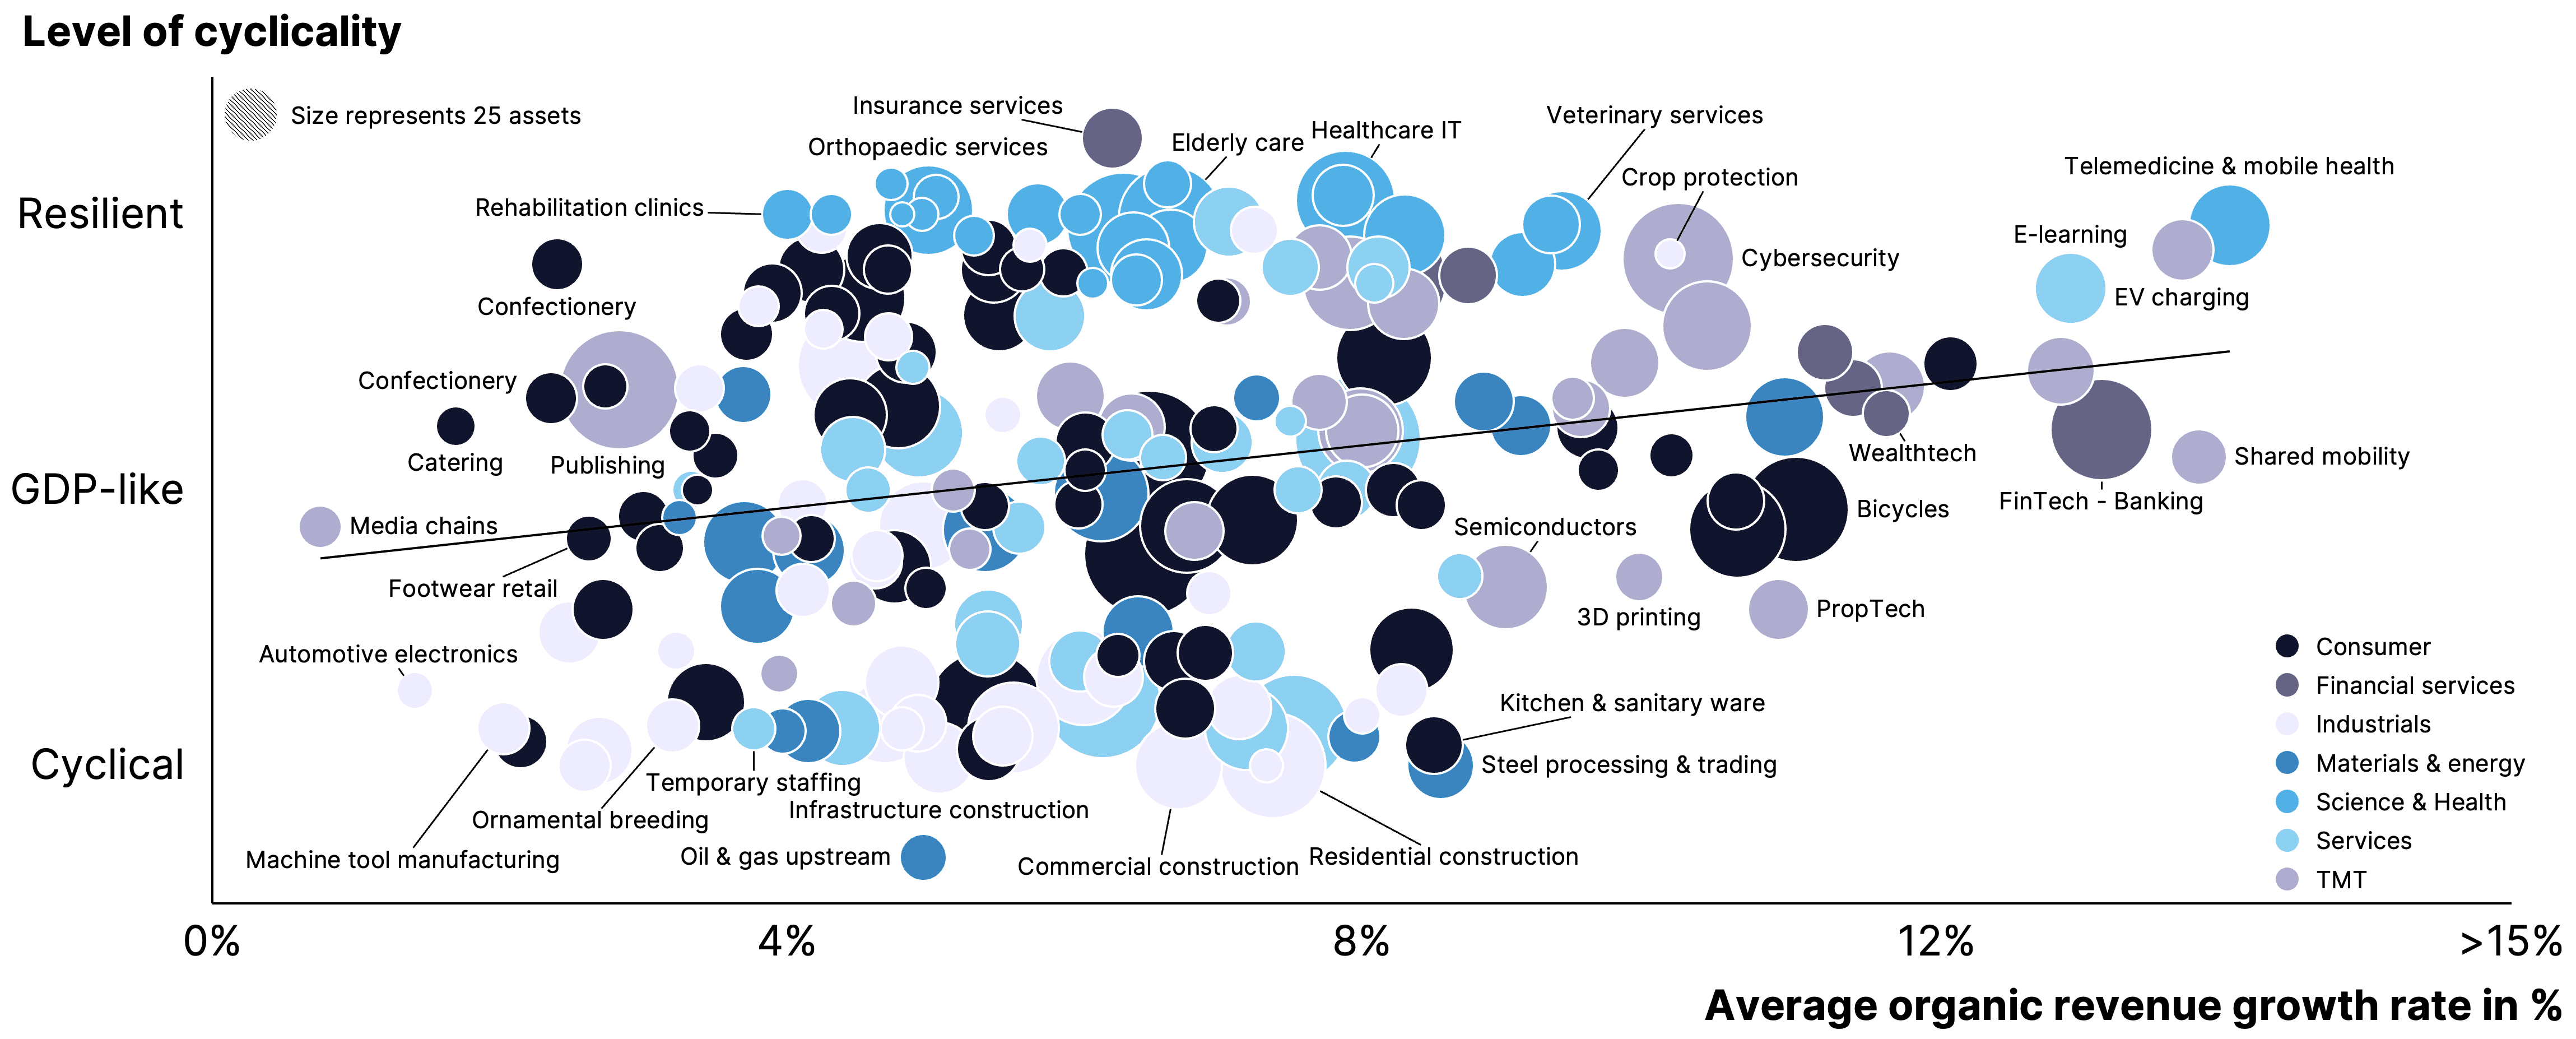
Going yet another layer deeper and looking at organic growth on an industry level, an even more dispersed picture can be drawn, which is overall still in line with the picture on the sector and subsector level. Looking at organic revenue growth on an industry level, especially new emerging and VC-backed industries, such as shared mobility, fintech-banking or telemedicine & mobile health, stand out (12-15%). Those industries not only show strong organic revenue growth but also resilience. On the lower end of the organic revenue growth scale, saturated industries mainly from the industrial and consumer sectors can be found. Examples include automotive electronics, confectionery and catering. With regard to the TMT sector, media chains stand out as a descending industry in terms of organic revenue growth. Looking at cyclicality, the vast majority of industries from the science & health sector show the highest resilience, which is in line with observations on a sector and subsector level. Furthermore, the various construction industries also stand out as being the most cyclical.
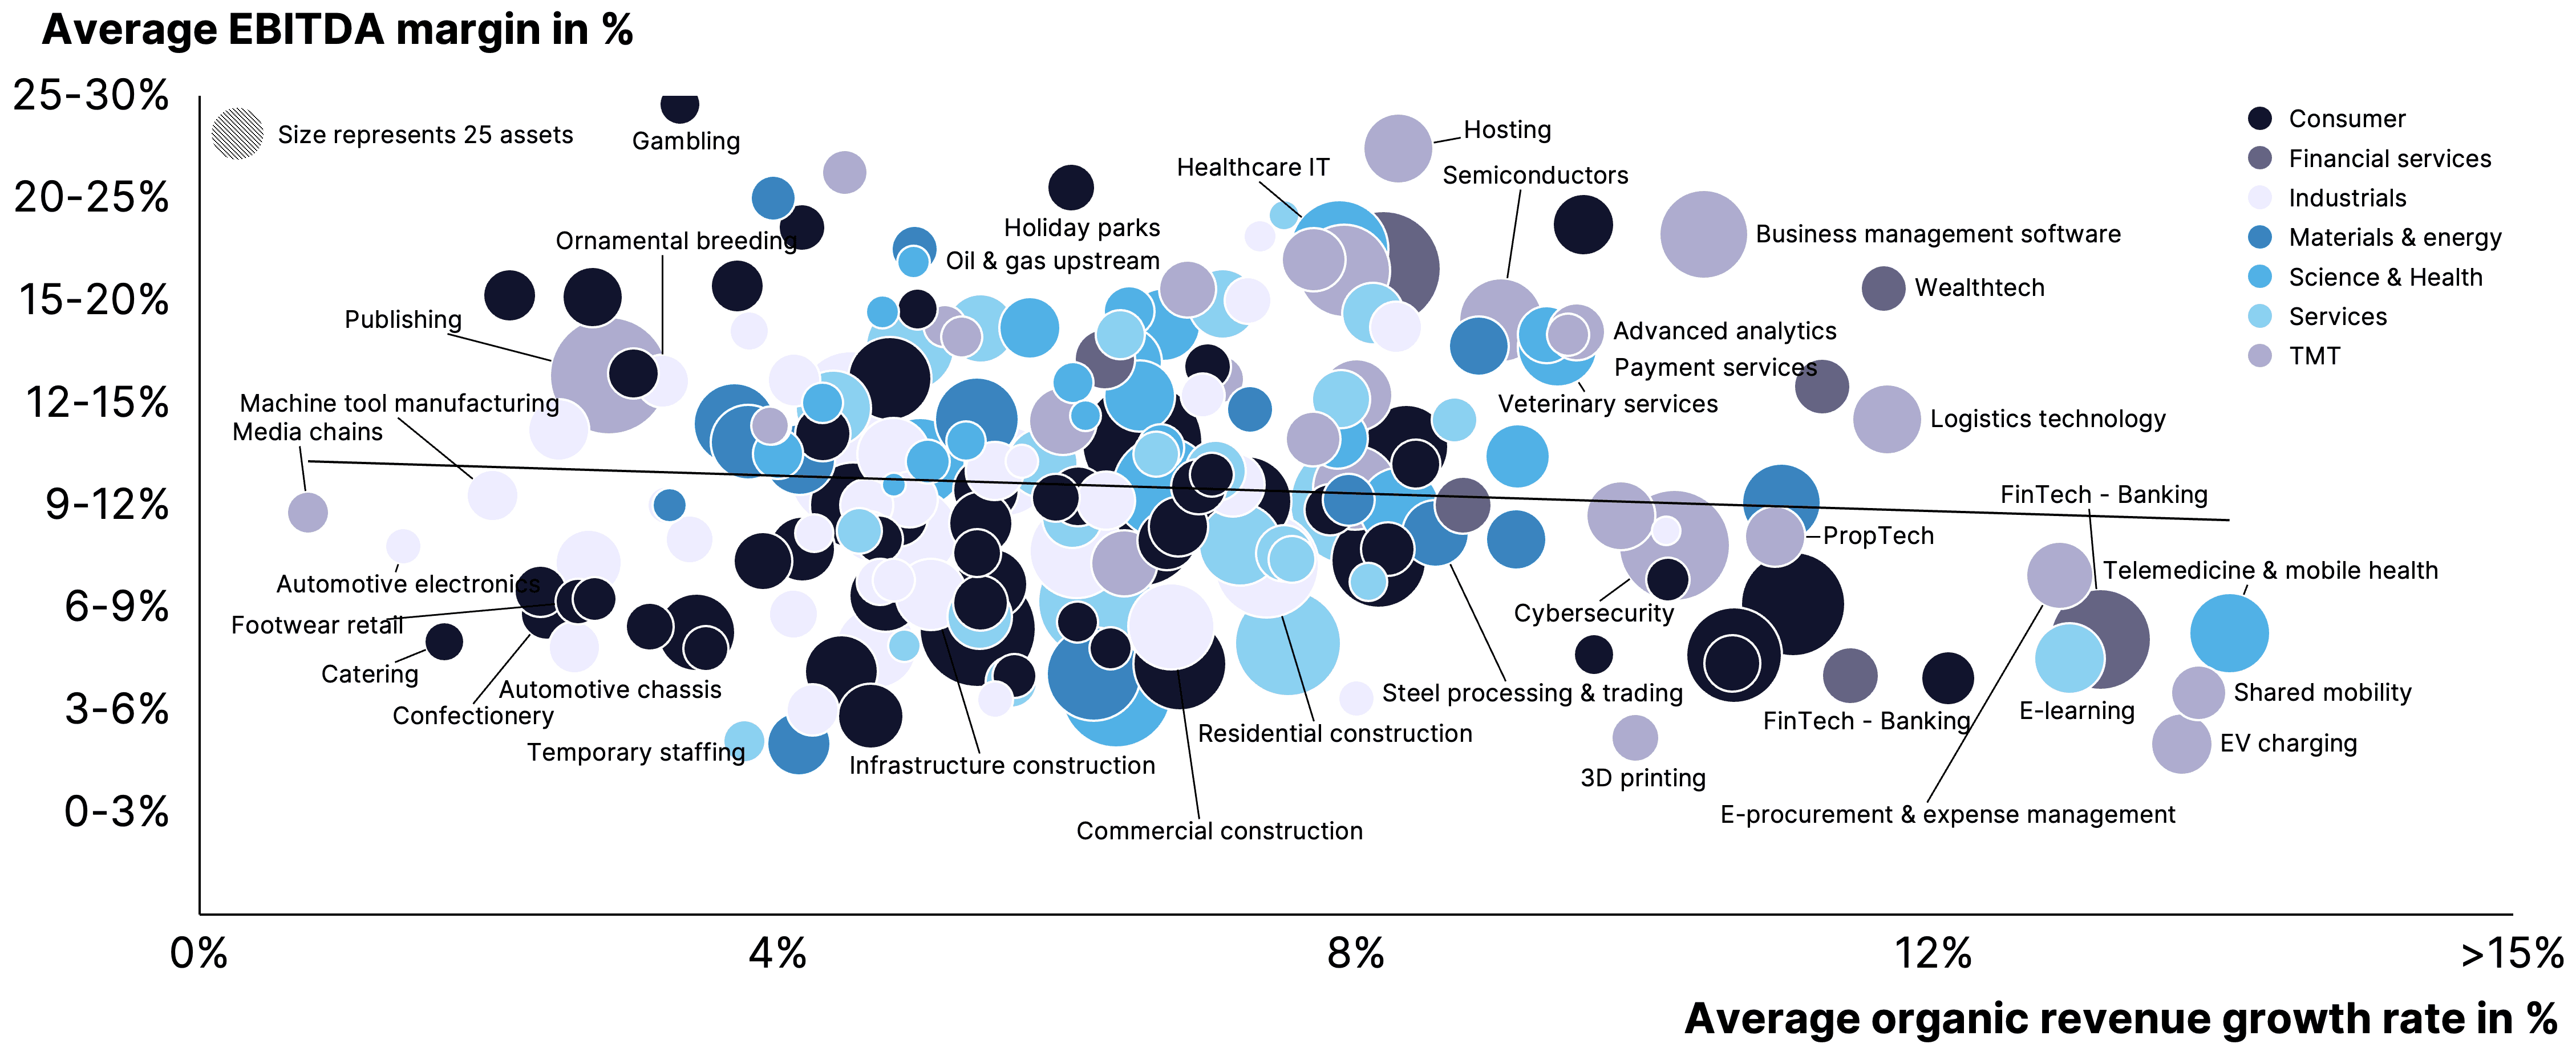
Taking into account profitability in addition to cyclicality and organic revenue growth, it becomes visible that the emerging, often VC-backed industries, show high organic revenue growth and low cyclicality but significantly lack in profitability. This observation can be made across sectors, for instance, the telemedicine & mobile health industry from the science & health sector or the shared mobility industry from the TMT sector. Besides that, profitability varies significantly across industries with all levels of profitability being found across sectors.
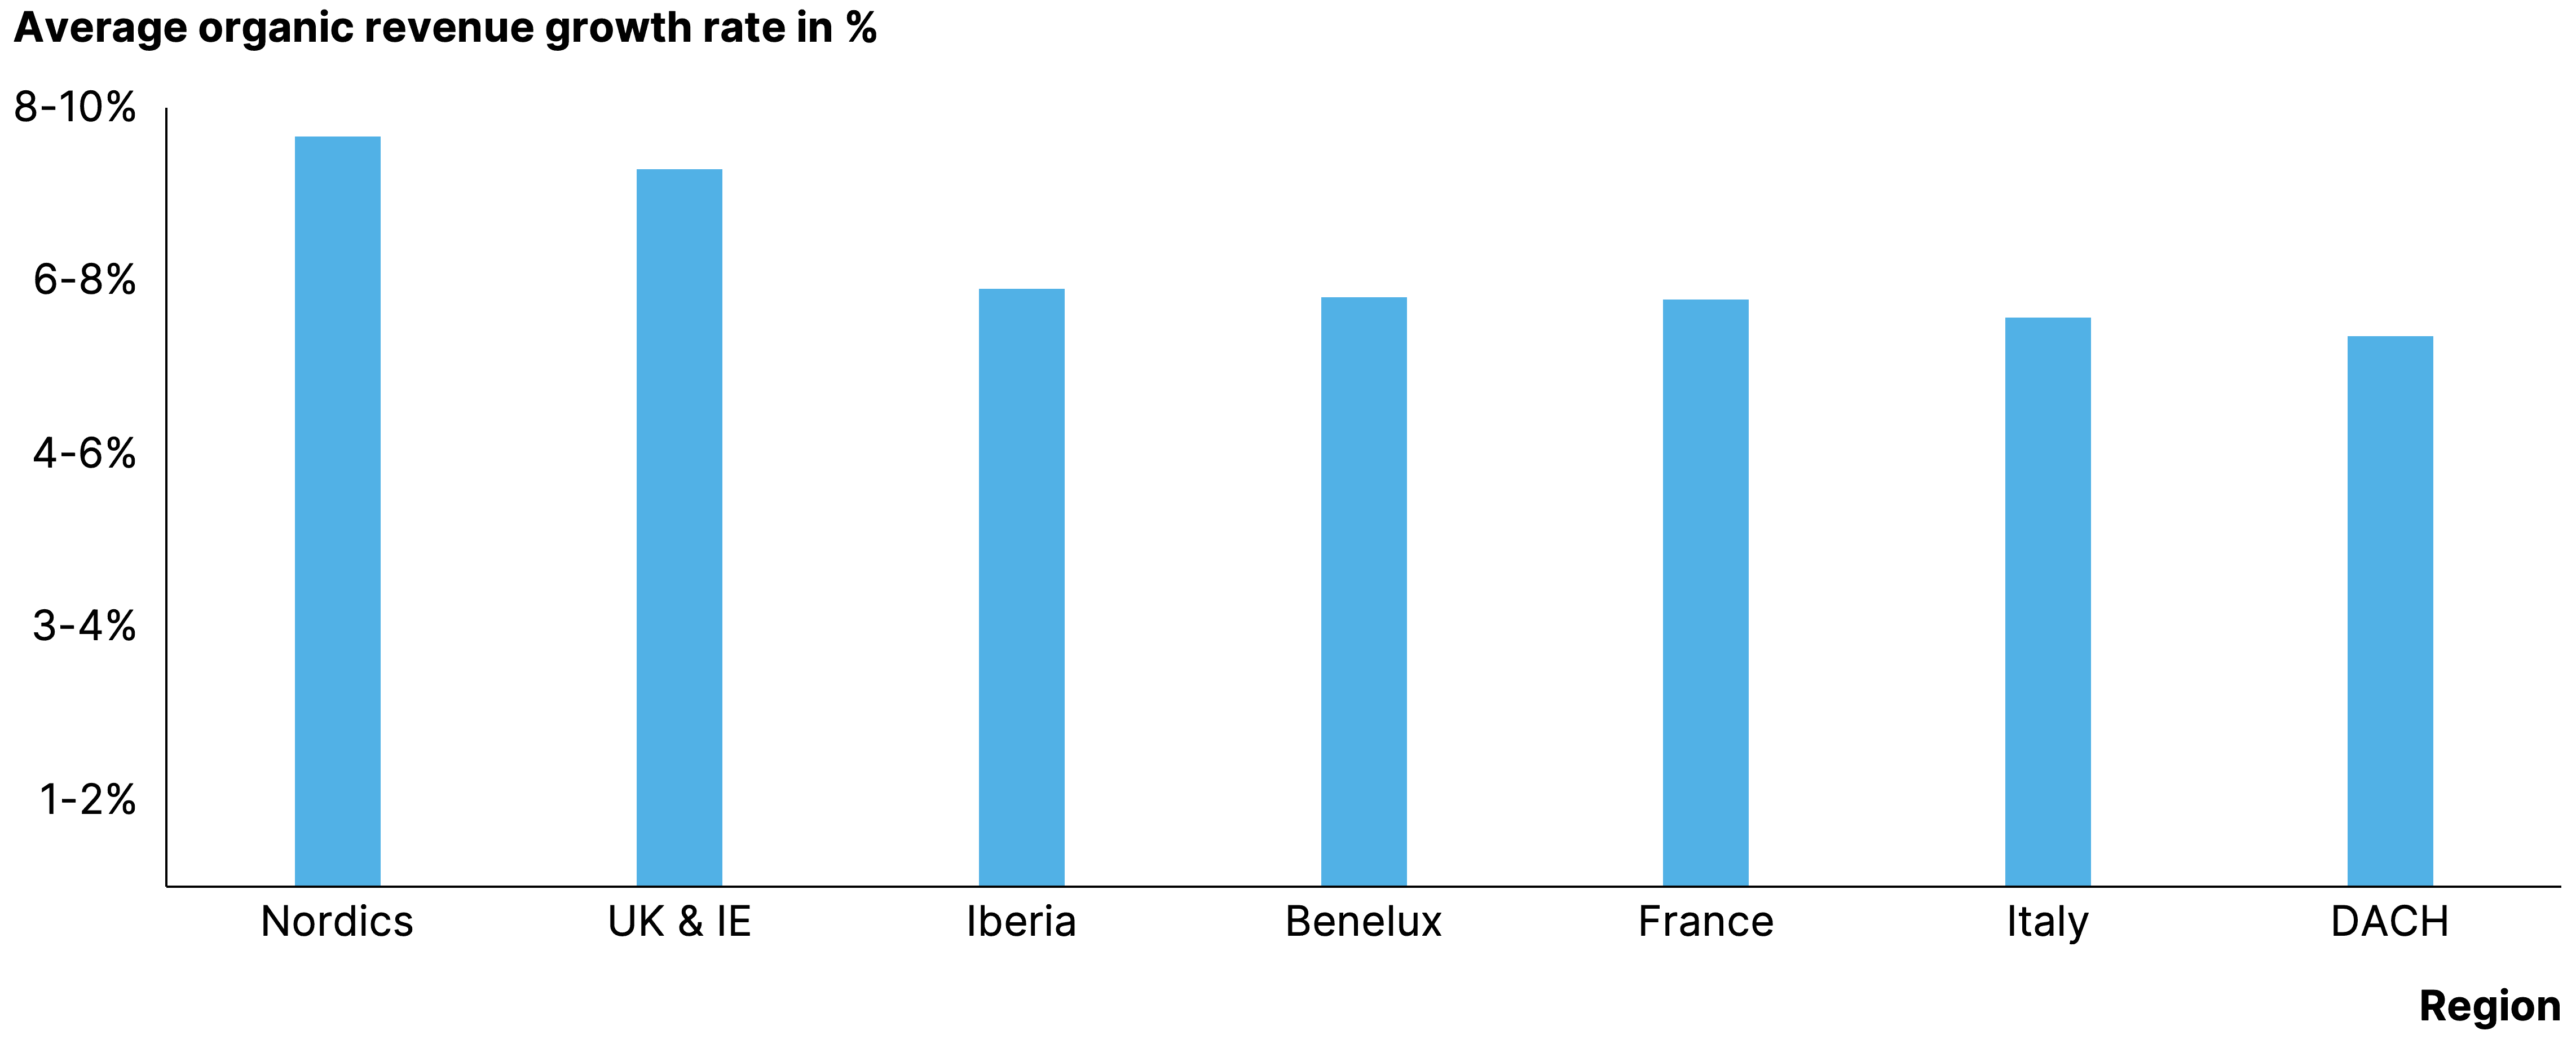
Finally, looking at organic revenue growth from a regional perspective, it can be observed that investors can find growth across all European regions. Overall, the PE-backed companies (we look at a single ownership category to make the data like-for-like) in the Nordics and the UK/IE market are performing slightly better than other regions in Europe. But what mostly stands out is that growth rates are largely quite similar.
Means can be deceiving
Thus far, we took a sector perspective to find growth. However, for investors there is a clear risk to taking this approach. To illustrate the issue, let us compare the growth distribution of the overall low-growth retail industry with the on average high-growth technology industry.
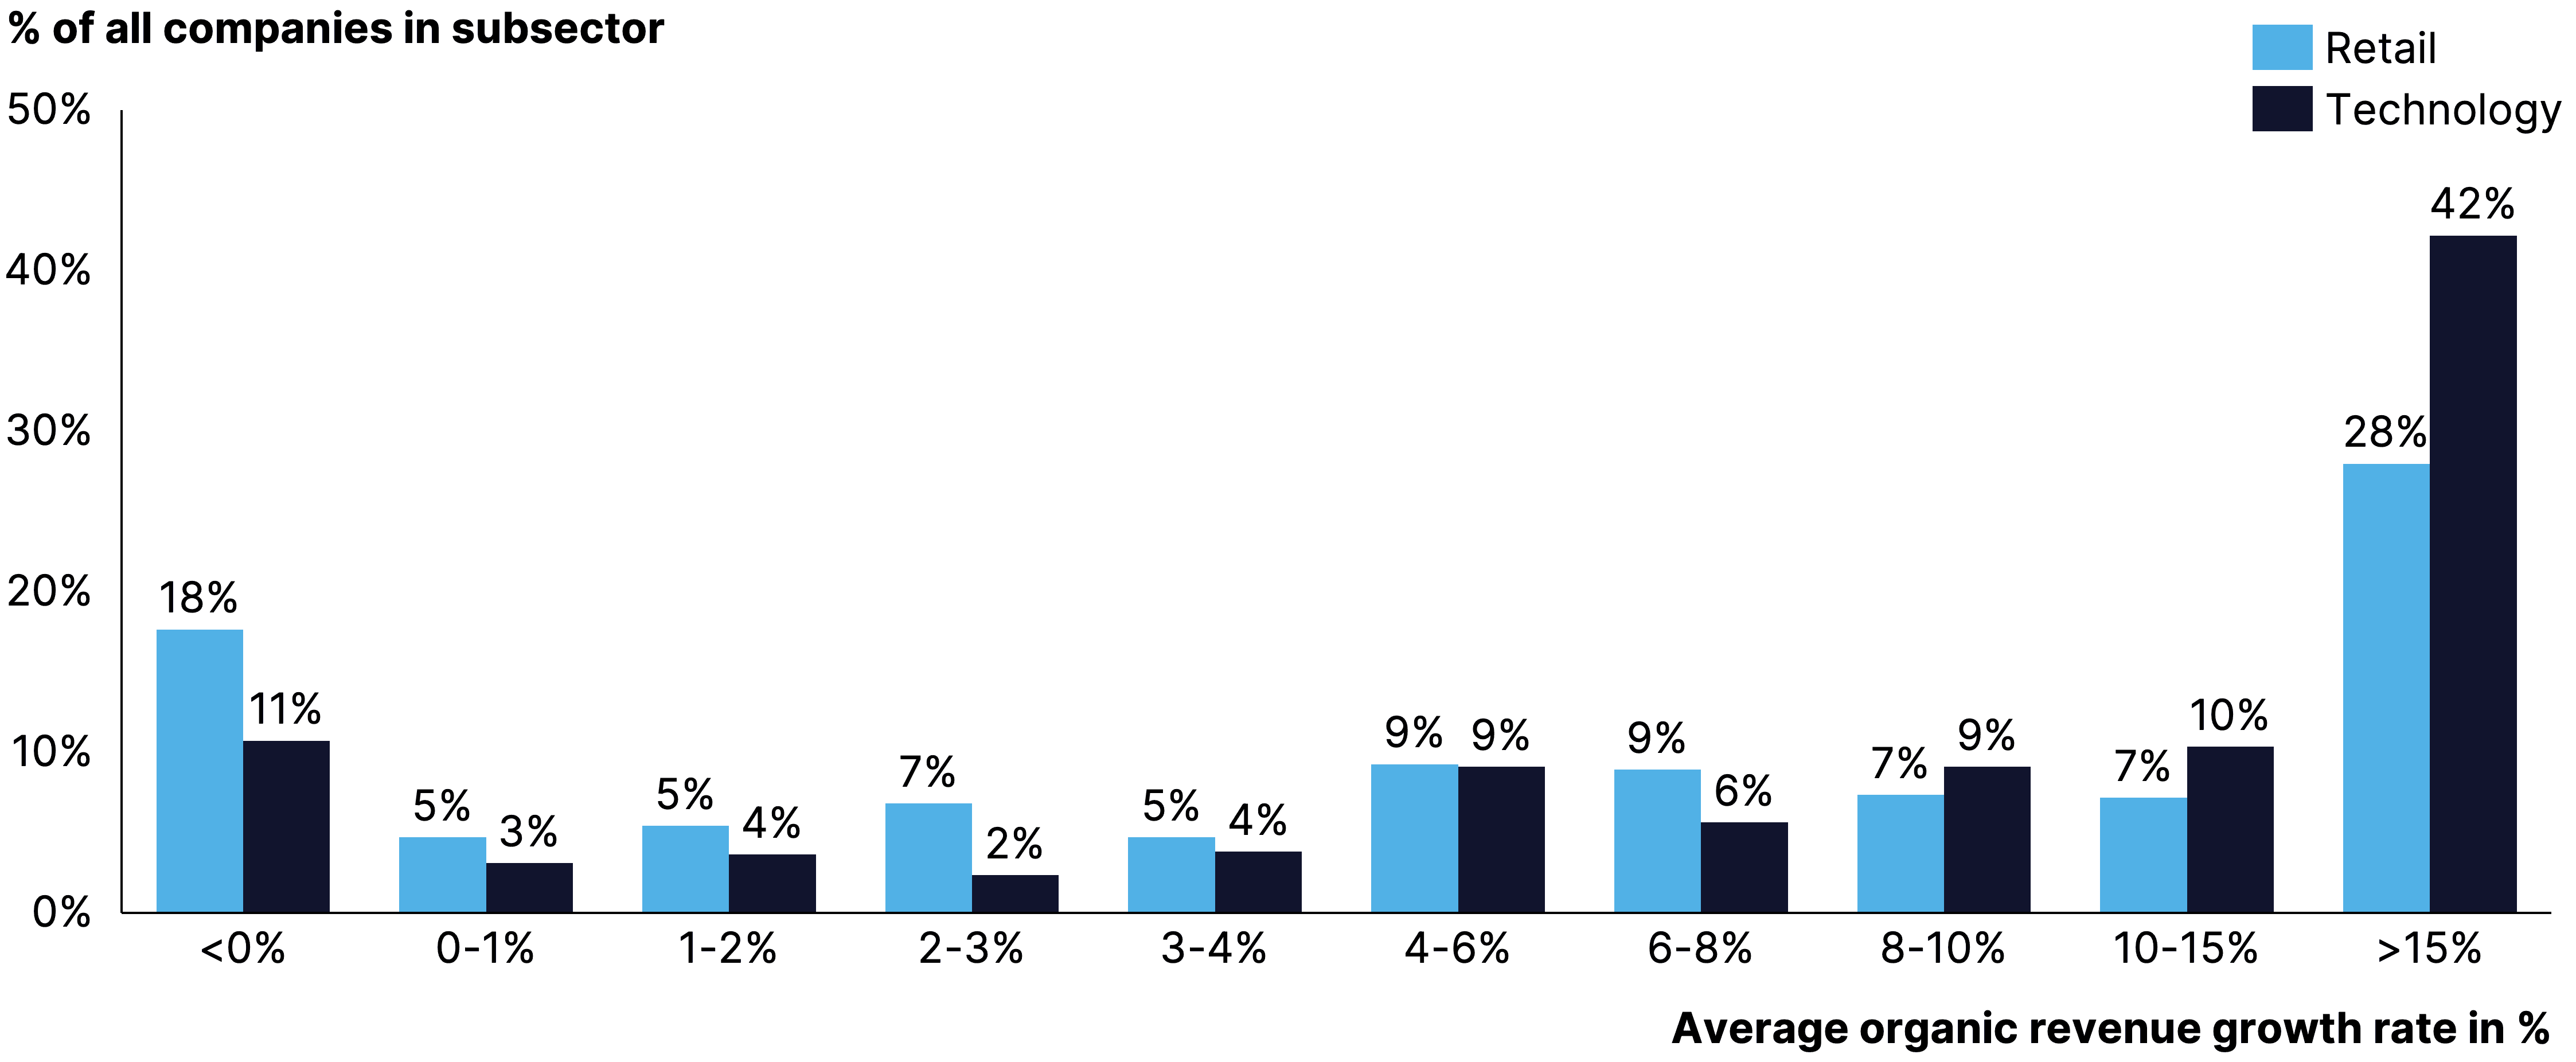
As is visible when doing so, there turns out to be many high-growth companies within the lower-growth retail sector, whereas the tech-sector actually includes a good number of sluggishly performing assets. In other words, investors miss out on many high-growth companies if they only focus on high-growth sectors.
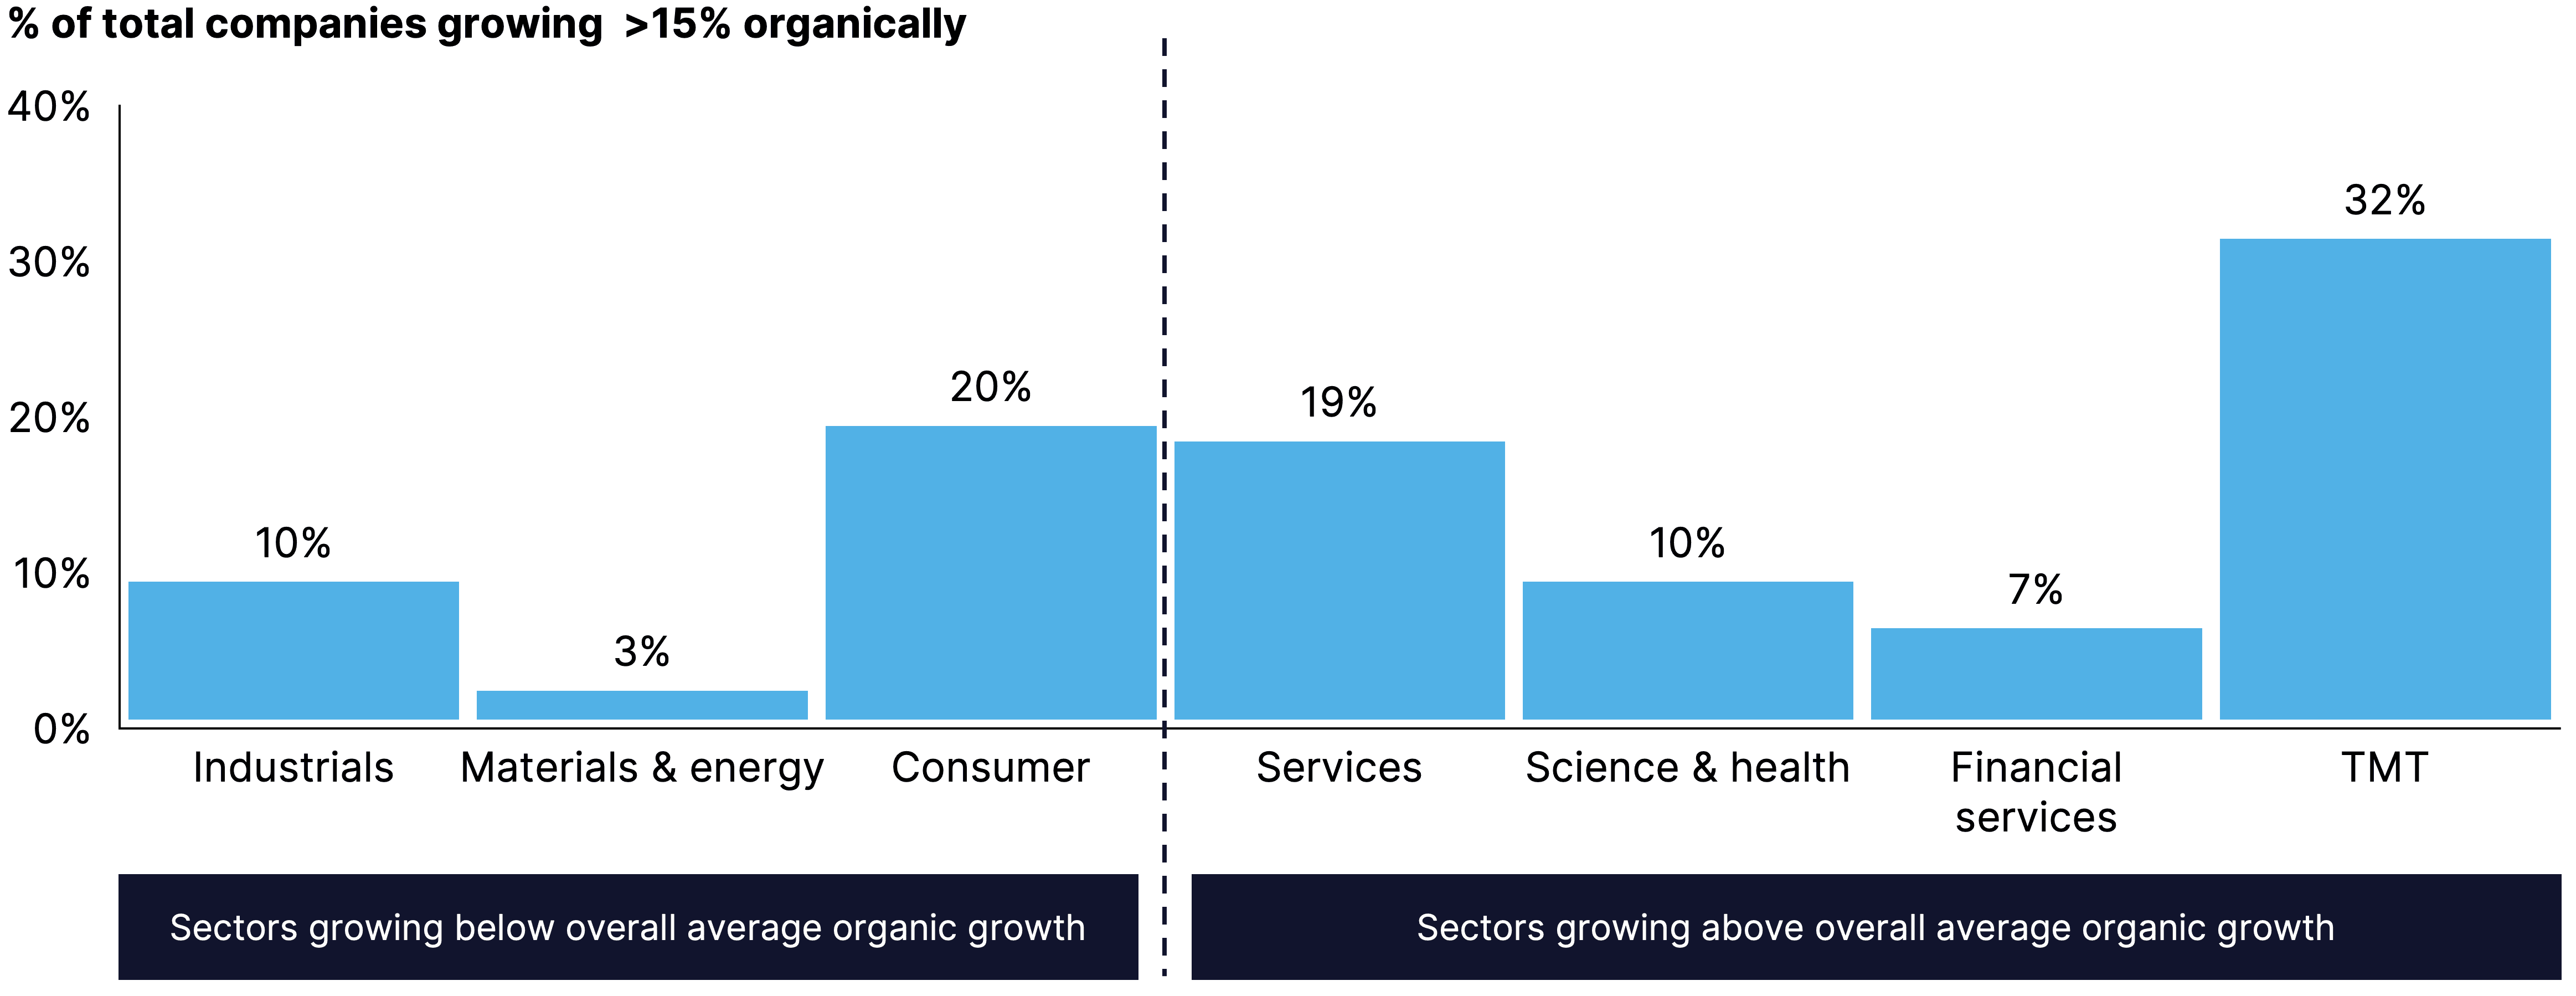
This point is made even clearer when looking at the percentage of fast-growing companies that fall into each industry. We compare the lower-growth industrials, materials & energy and consumer sectors against the above-average growth services, science & health, financial services and TMT sectors. It turns out that disregarding the three slower-growing sectors from an investment scope means excluding 33% of the fastest-growing companies (above 15% growth) that exist overall. This proves organic growth can still be achieved in slower-growing sectors. Importantly, growth assets in such industries often trade at lower transaction multiples, making for interesting investment cases. Picking winning companies is therefore much more important than just picking a sector with high organic growth rates. In the end, the growth difference between companies in a specific sector is much higher than the growth differences between sectors, so a granular search is what truly pays off.
Be ready for trade-offs
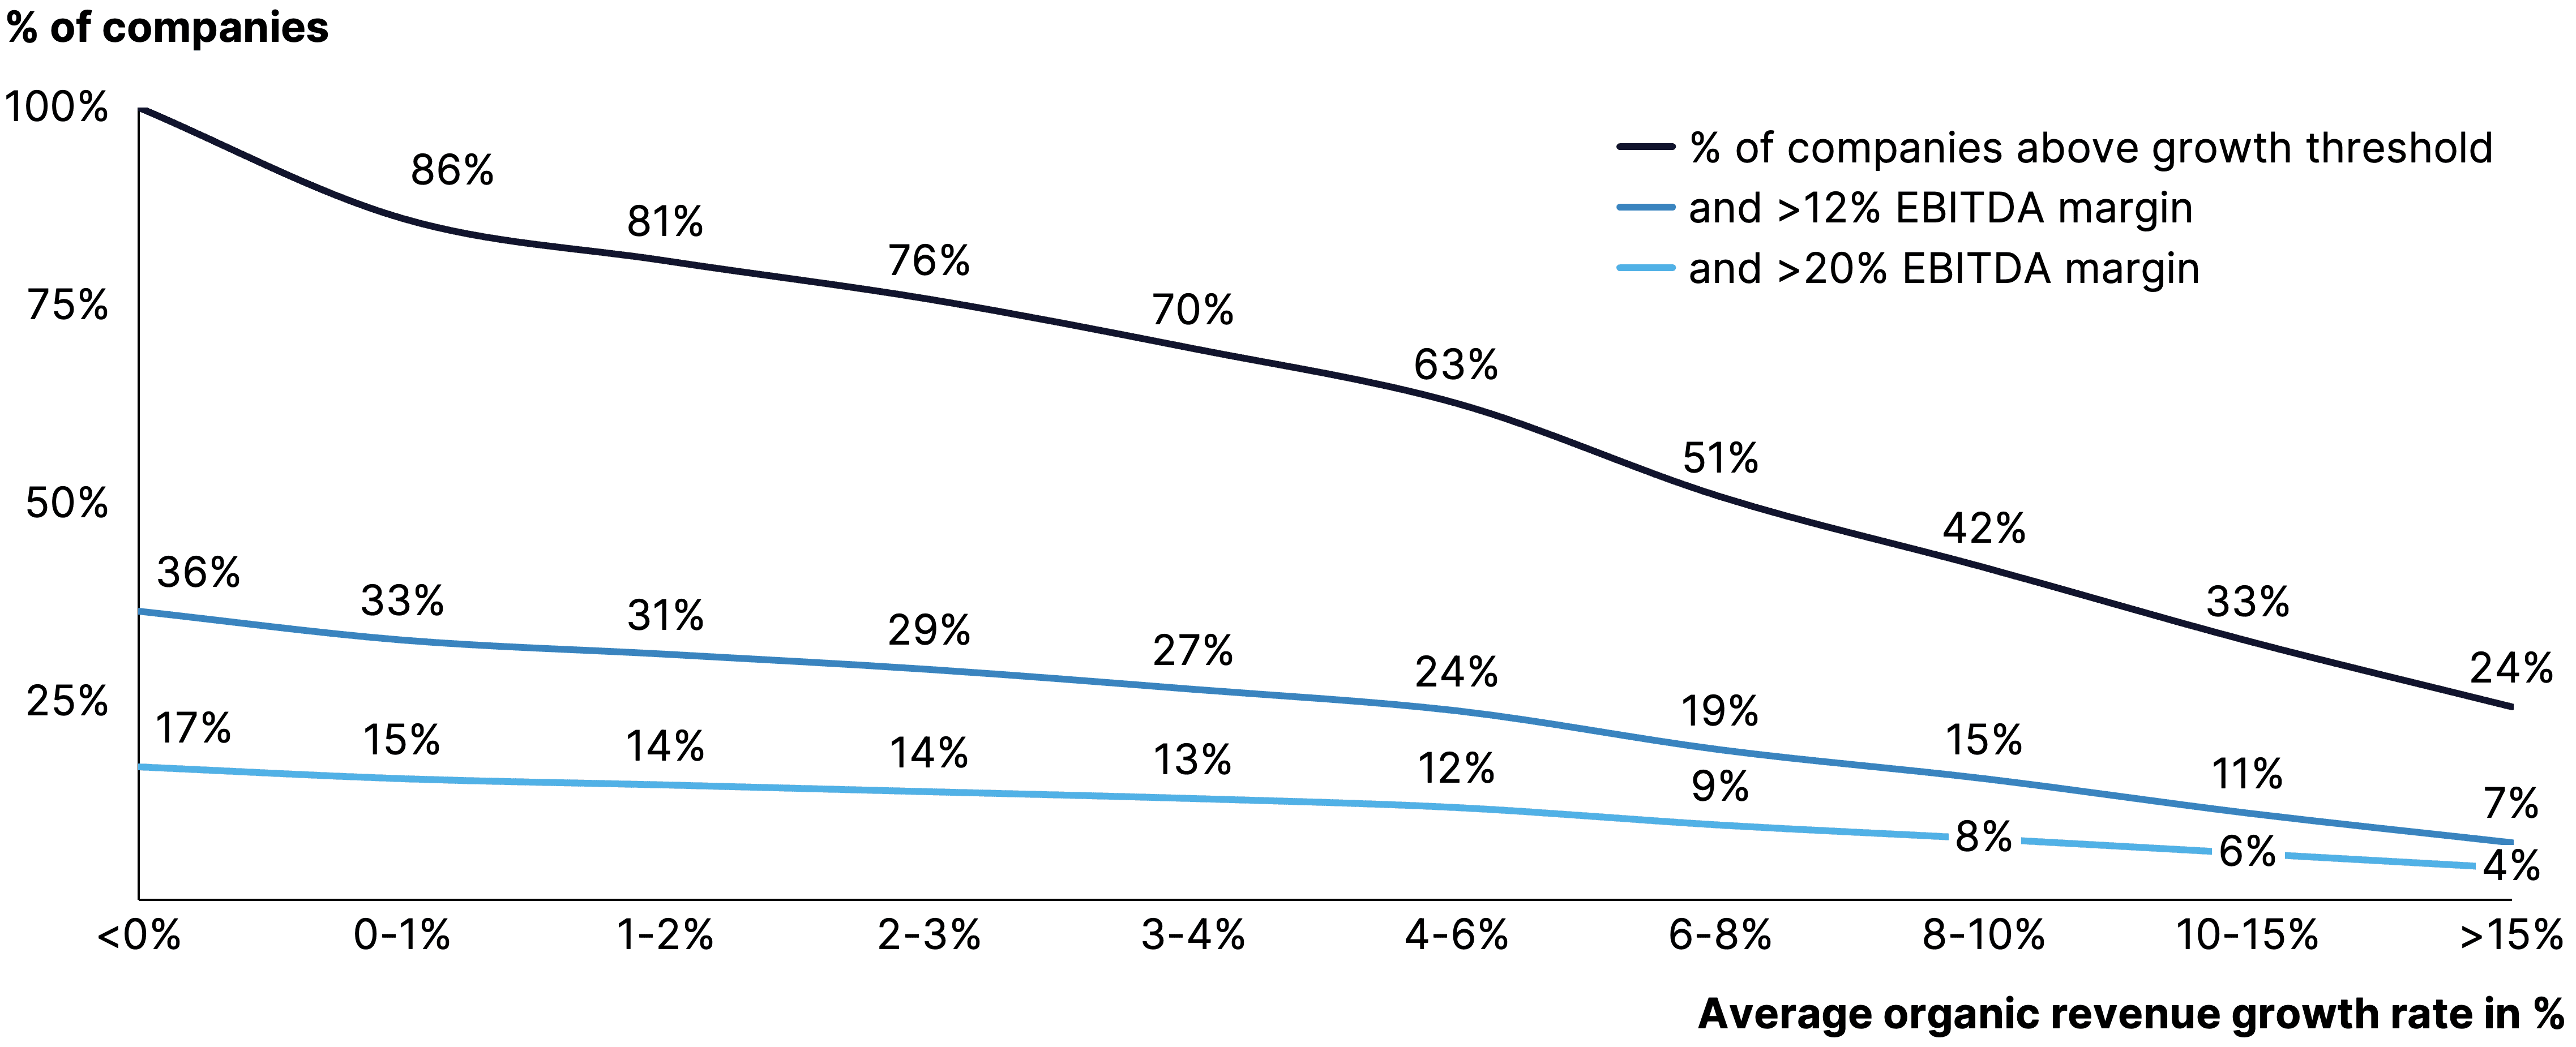
Buying growing assets is not an objective to be pursued in isolation. A first consideration is that especially strong growth is very rare. In fact, only 24% of sizable assets in Europe achieve more than 15% annual organic revenue growth. Profitable growth is even rarer. A mere 7% of companies manage to combine such a growth rate with EBITDA margins above 12%. That even drops to 4% of companies when raising the margin threshold to over 20%.
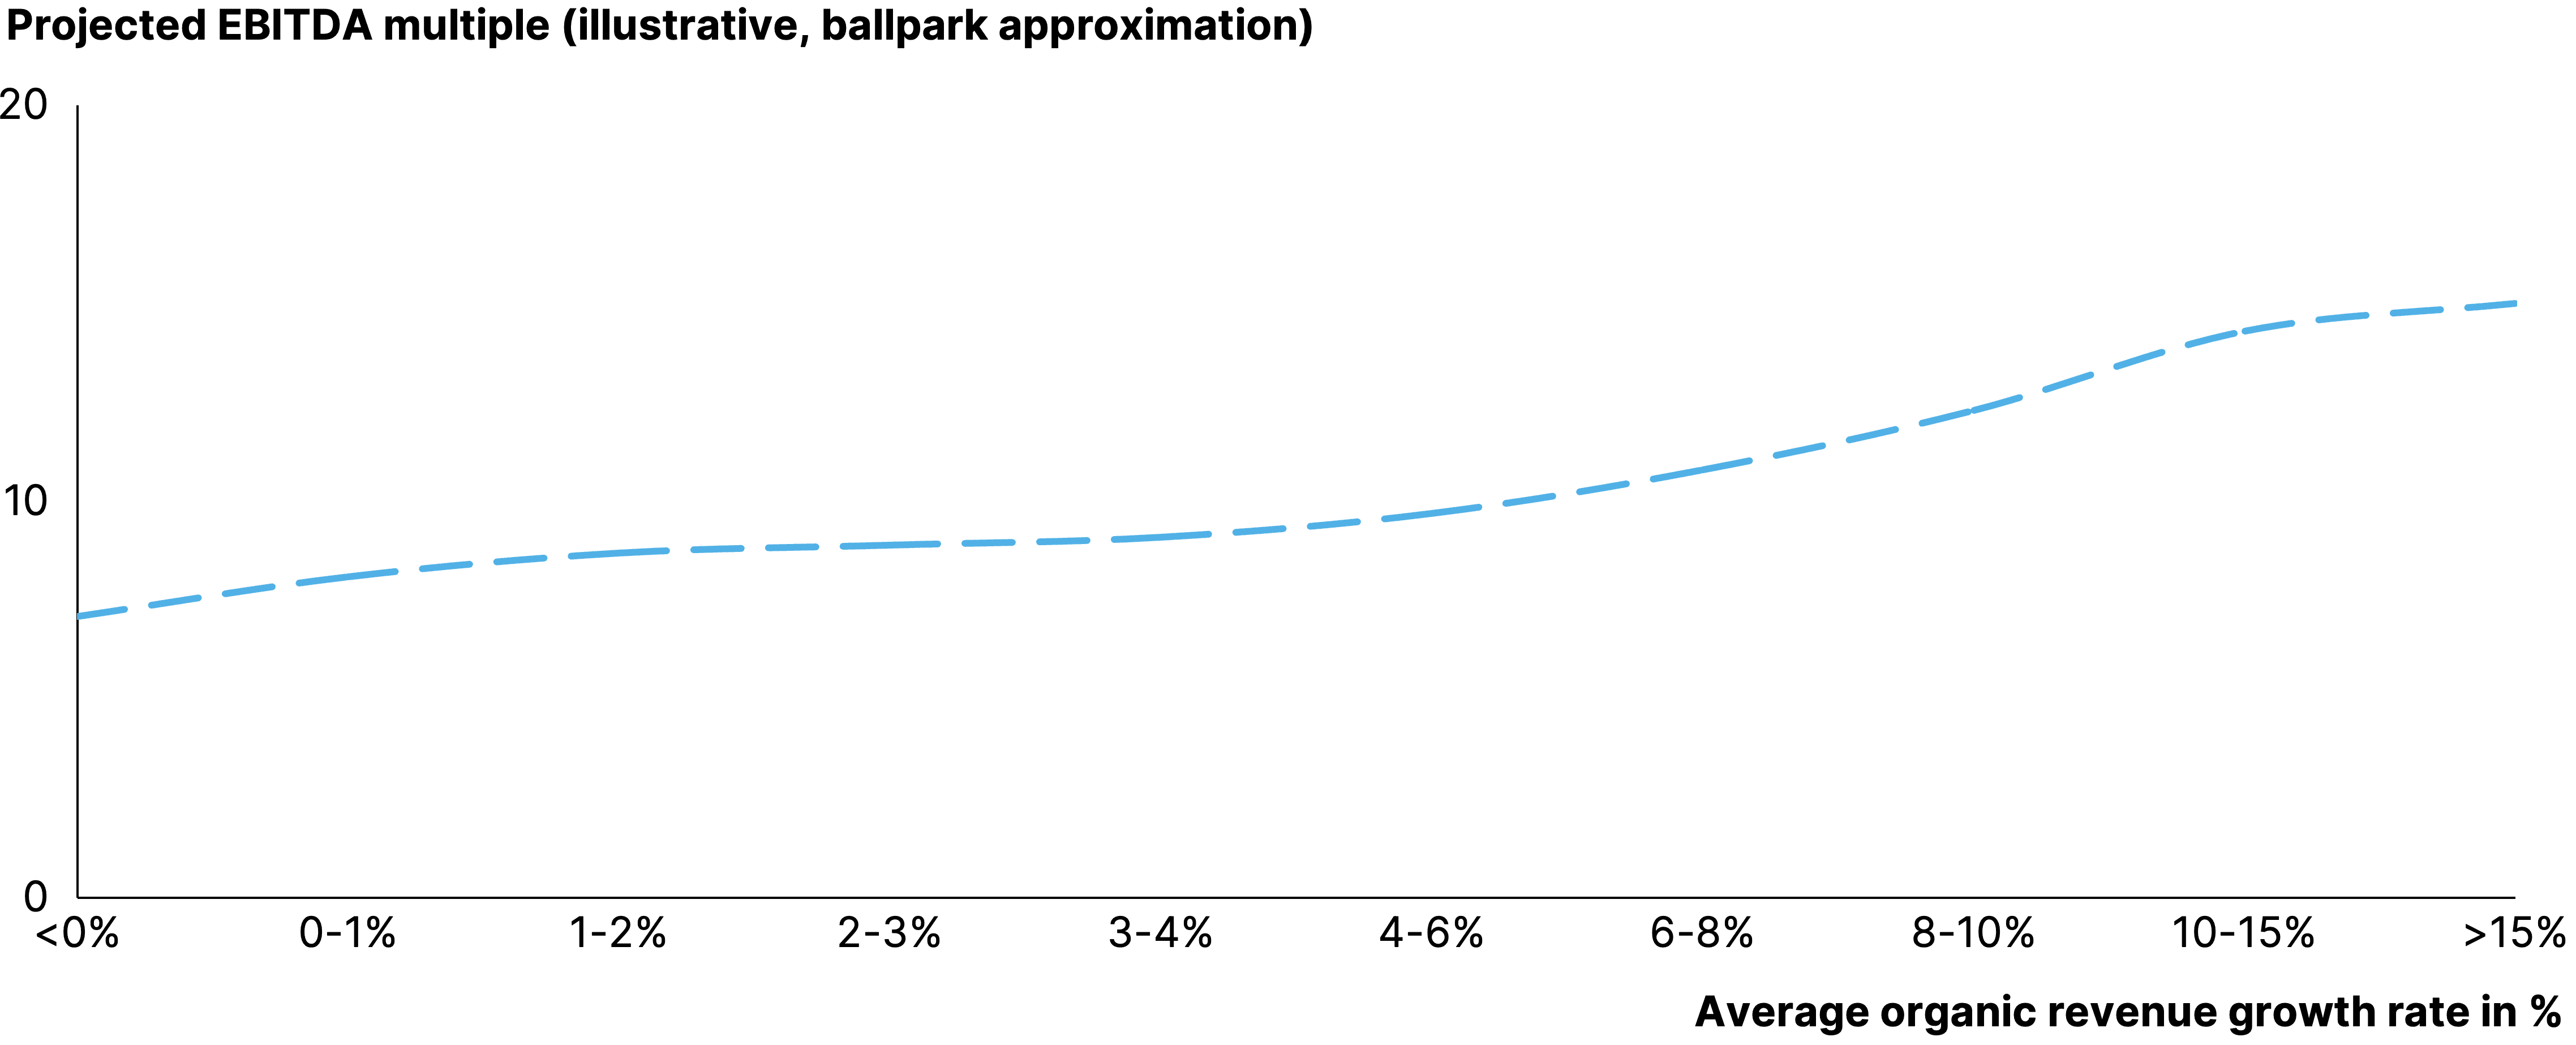
In addition to being rare, strong organic growth is also expensive. When factoring out all other elements, a steep relationship between multiples and growth is visible. Therefore, investing in high organic growth companies comes with a certain price tag, so investors have to ask themselves whether they are willing to pay up.
Additionally, growth needs to be weighted in the context of other investment criteria. The following data shows how rare strong performance is on such factors.
Figure
28
The growth profile of companies needs to be weighed against other investment criteria
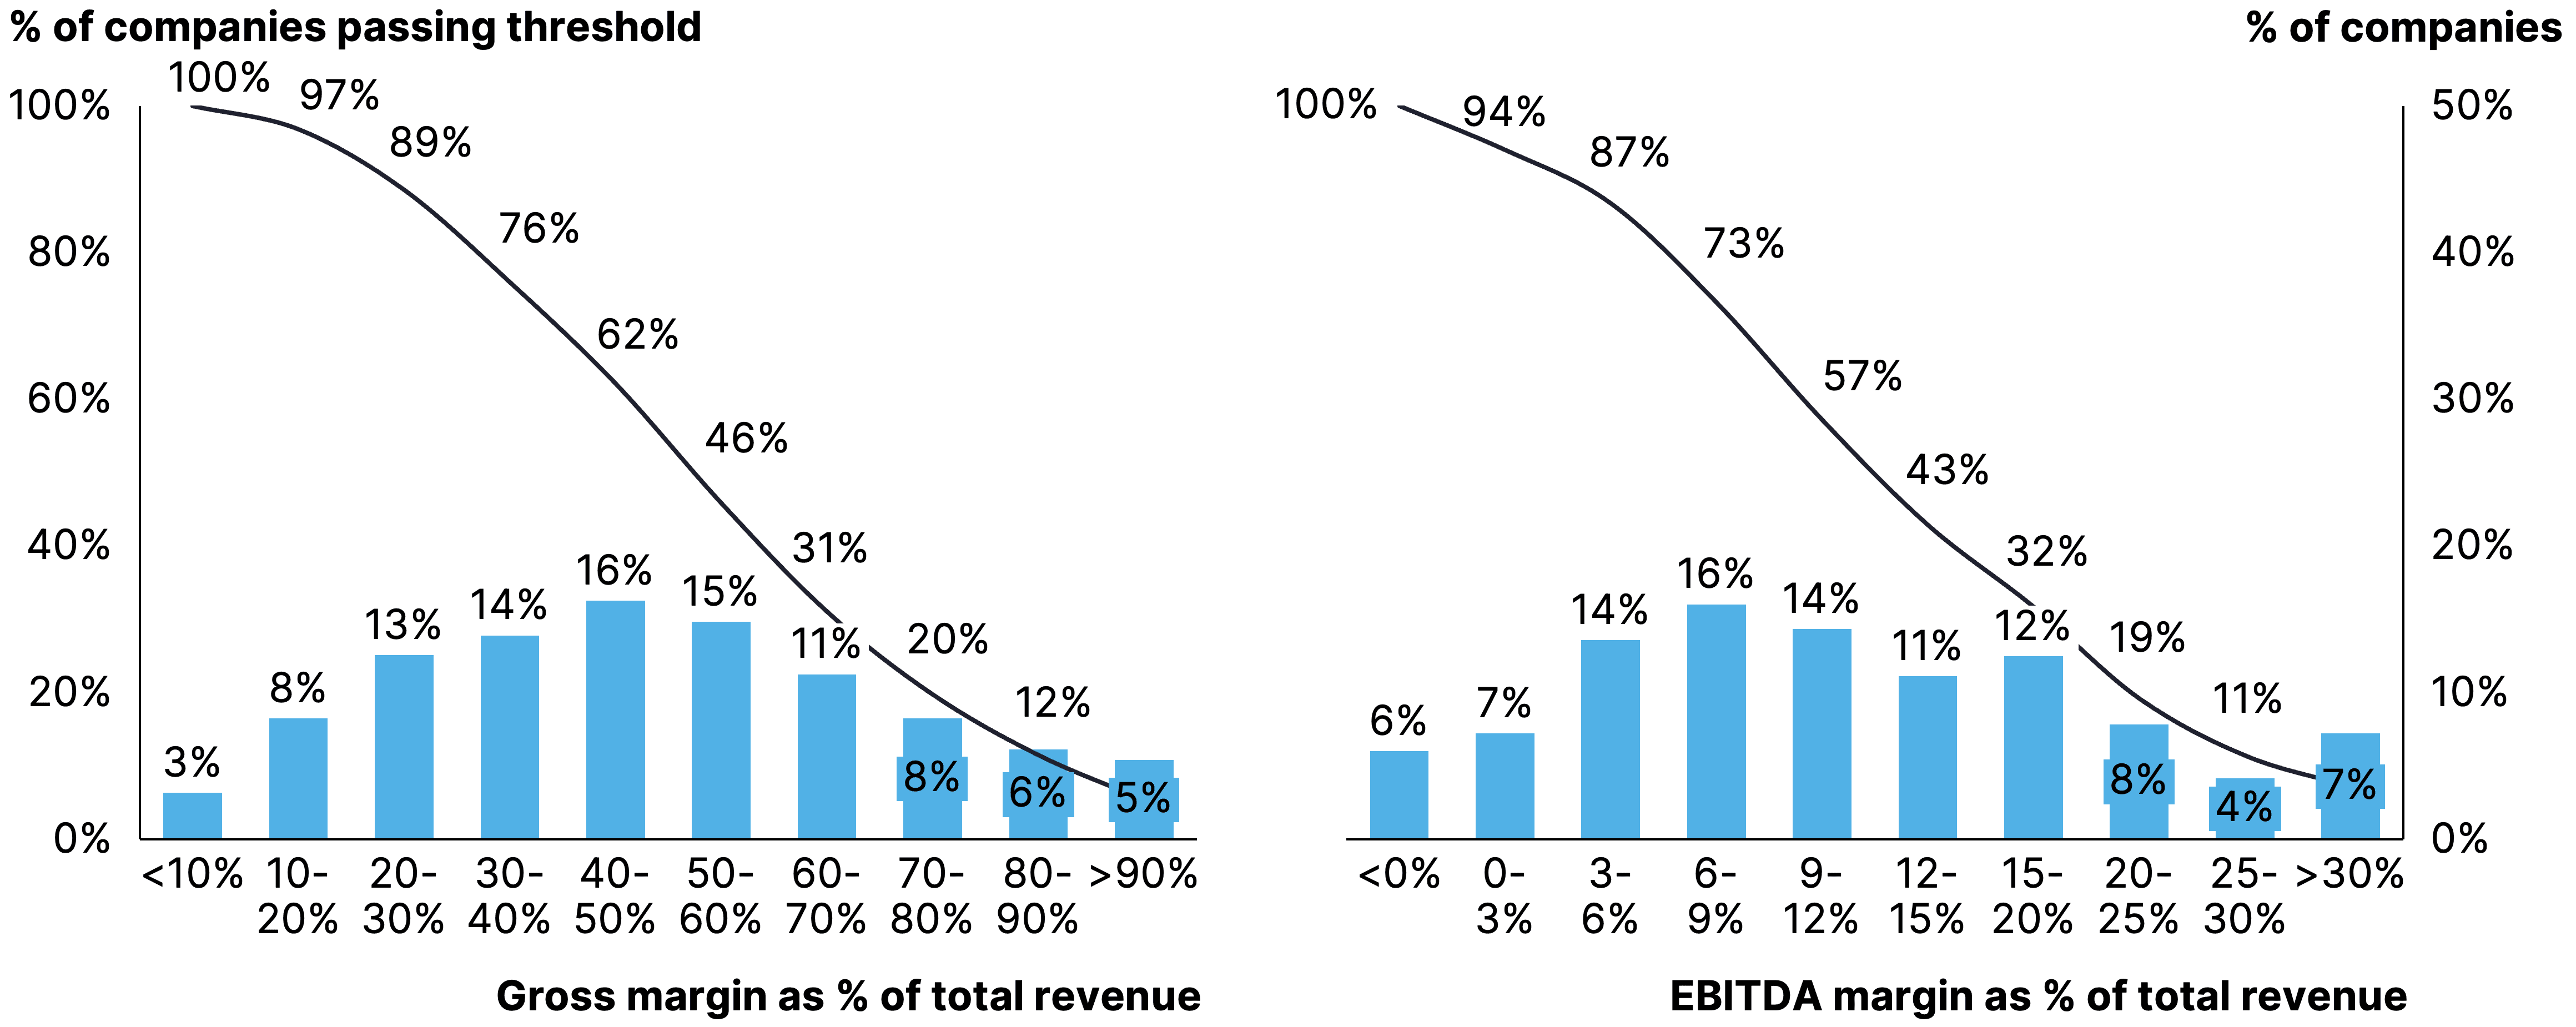
Notes: The chart refers to companies with all ownership types. Additionally, the gross margin and EBITDA margin calculation is based on the companies' last 5-year financial statements. Source: Gain.pro
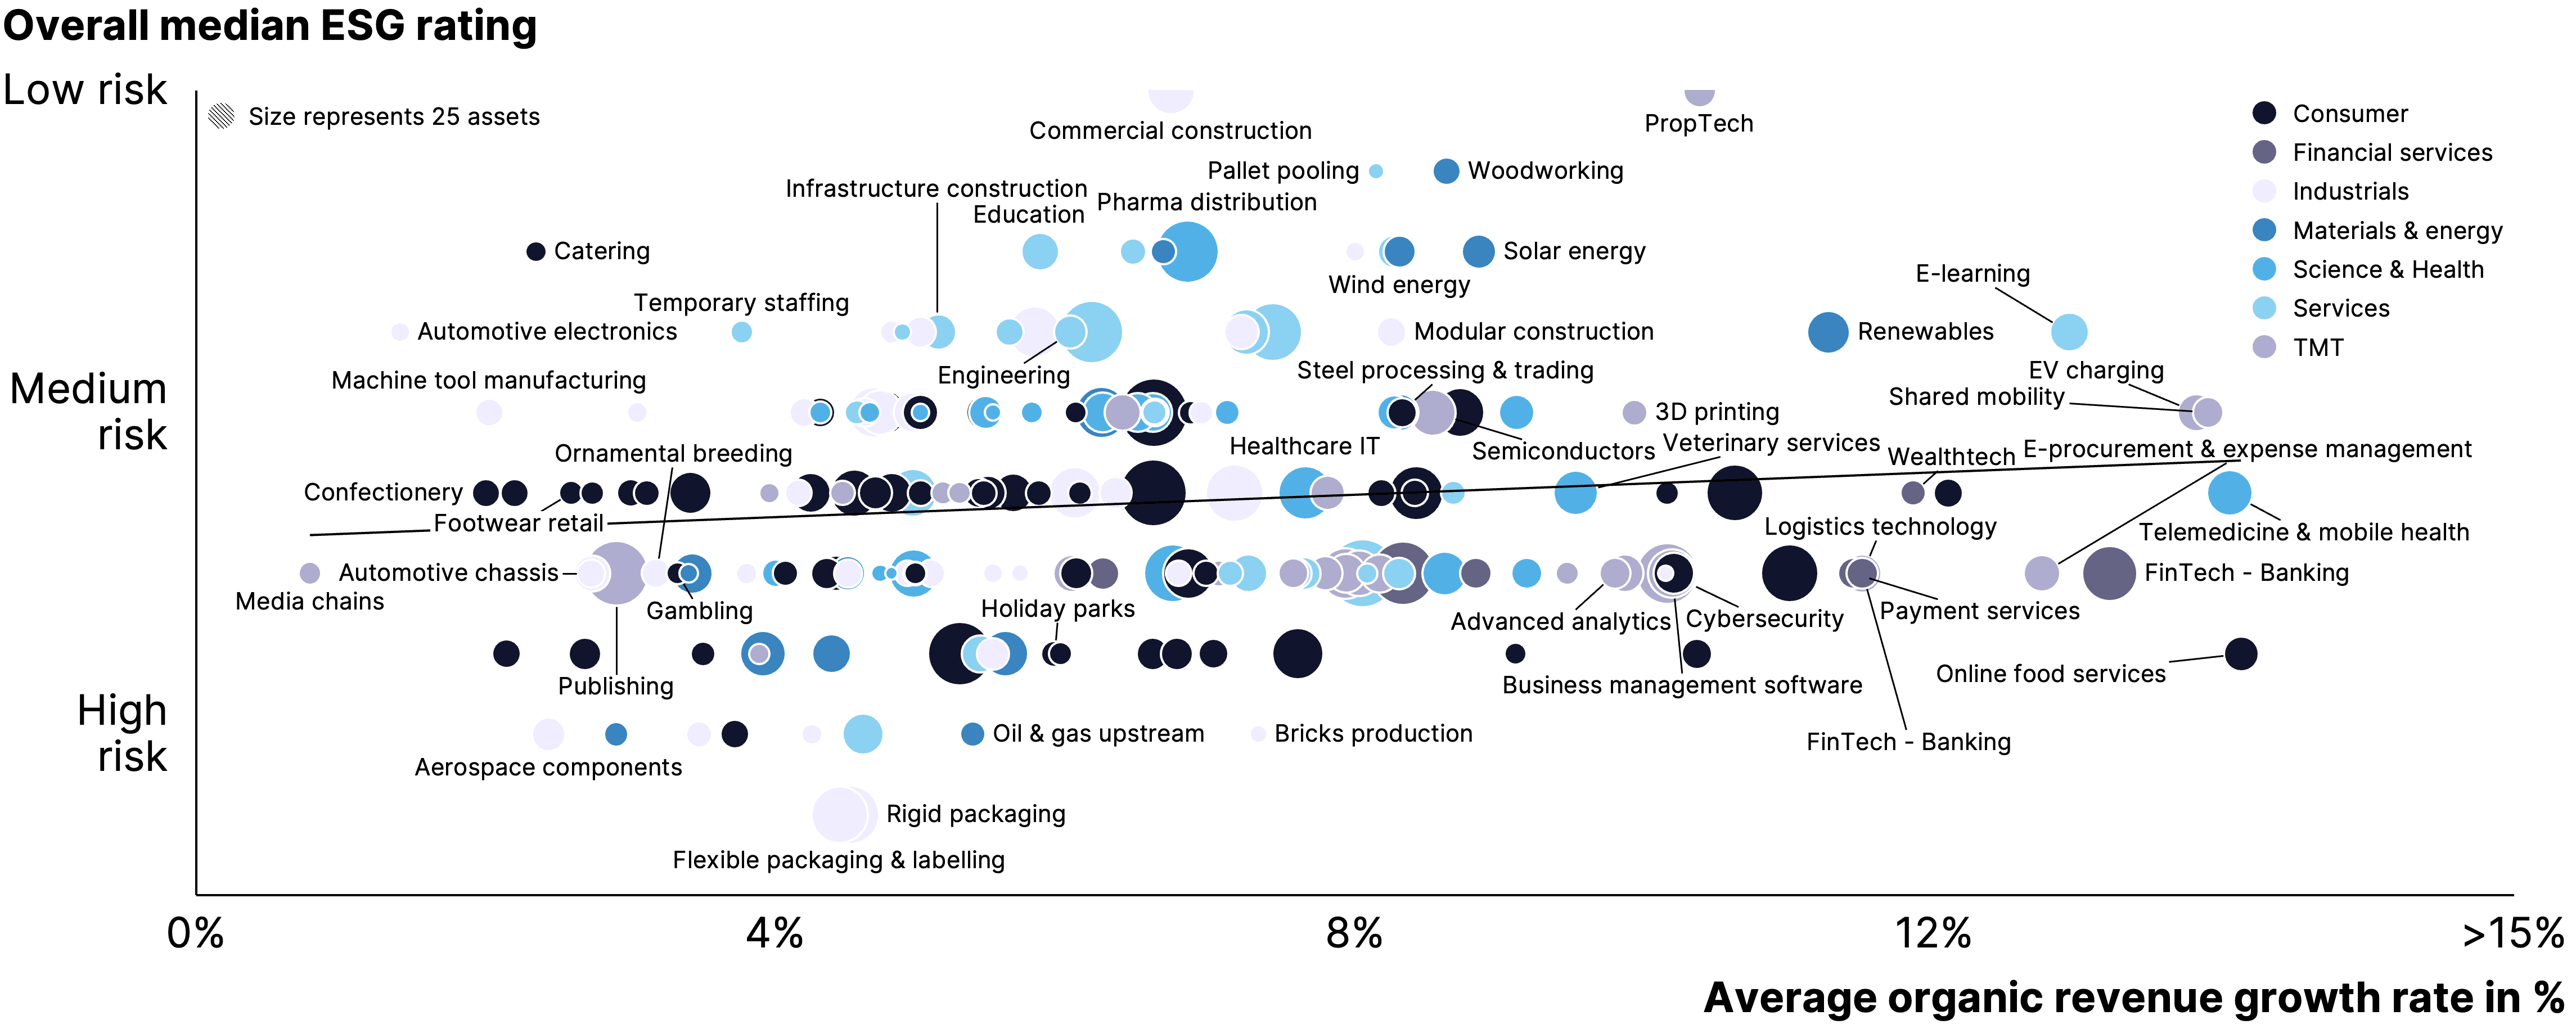
Growth and profit are not the only metrics that matter. Investors seek to “do good” through their investment choices. Positively, this does not have to entail a trade off against growth. In fact, there is a clear correlation between the organic growth rates of an industry and the ESG-risk profile of a company. This means that higher organic growth correlates with a (slightly) lower average ESG-risk. Investors can therefore still achieve strong organic growth while investing in ESG-friendly industries and in fact benefit from combining both.
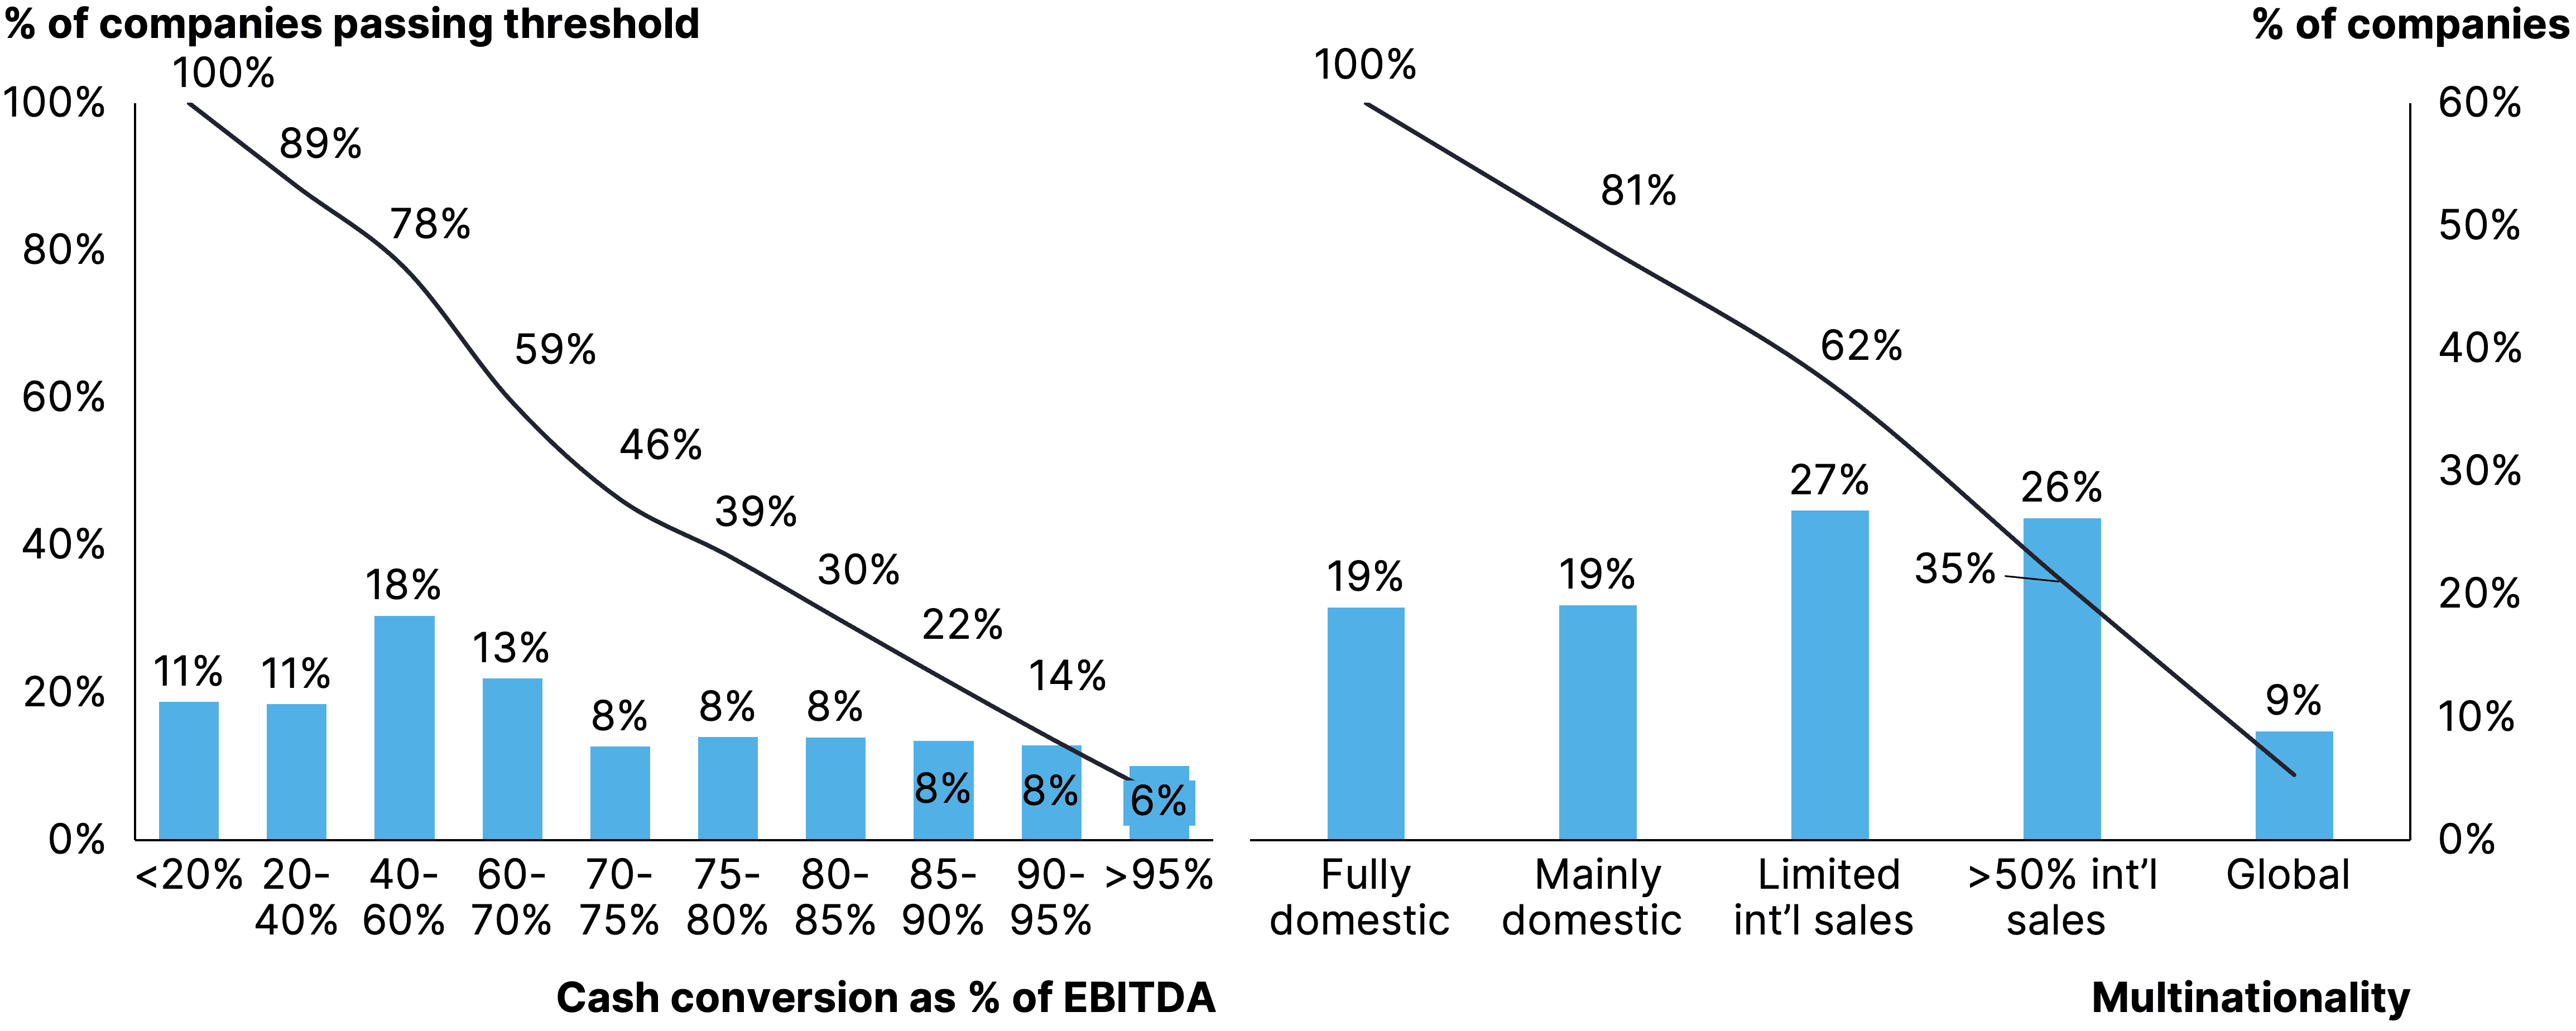
Whereas ESG performance is one trade off investors don’t have to make compromises on, a certain appetite for ‘negatives’ on other investment criteria is inevitable. There are approximately 35k sizable investable assets in Europe, meaning they are either over €5m EBITDA, €50m of sales or have received at least €10m of (venture) funding. Rooting out assets based on some (reasonable) investment criteria very quickly narrows down the pool of opportunities. We provide an example of such a weeding out exercise below.
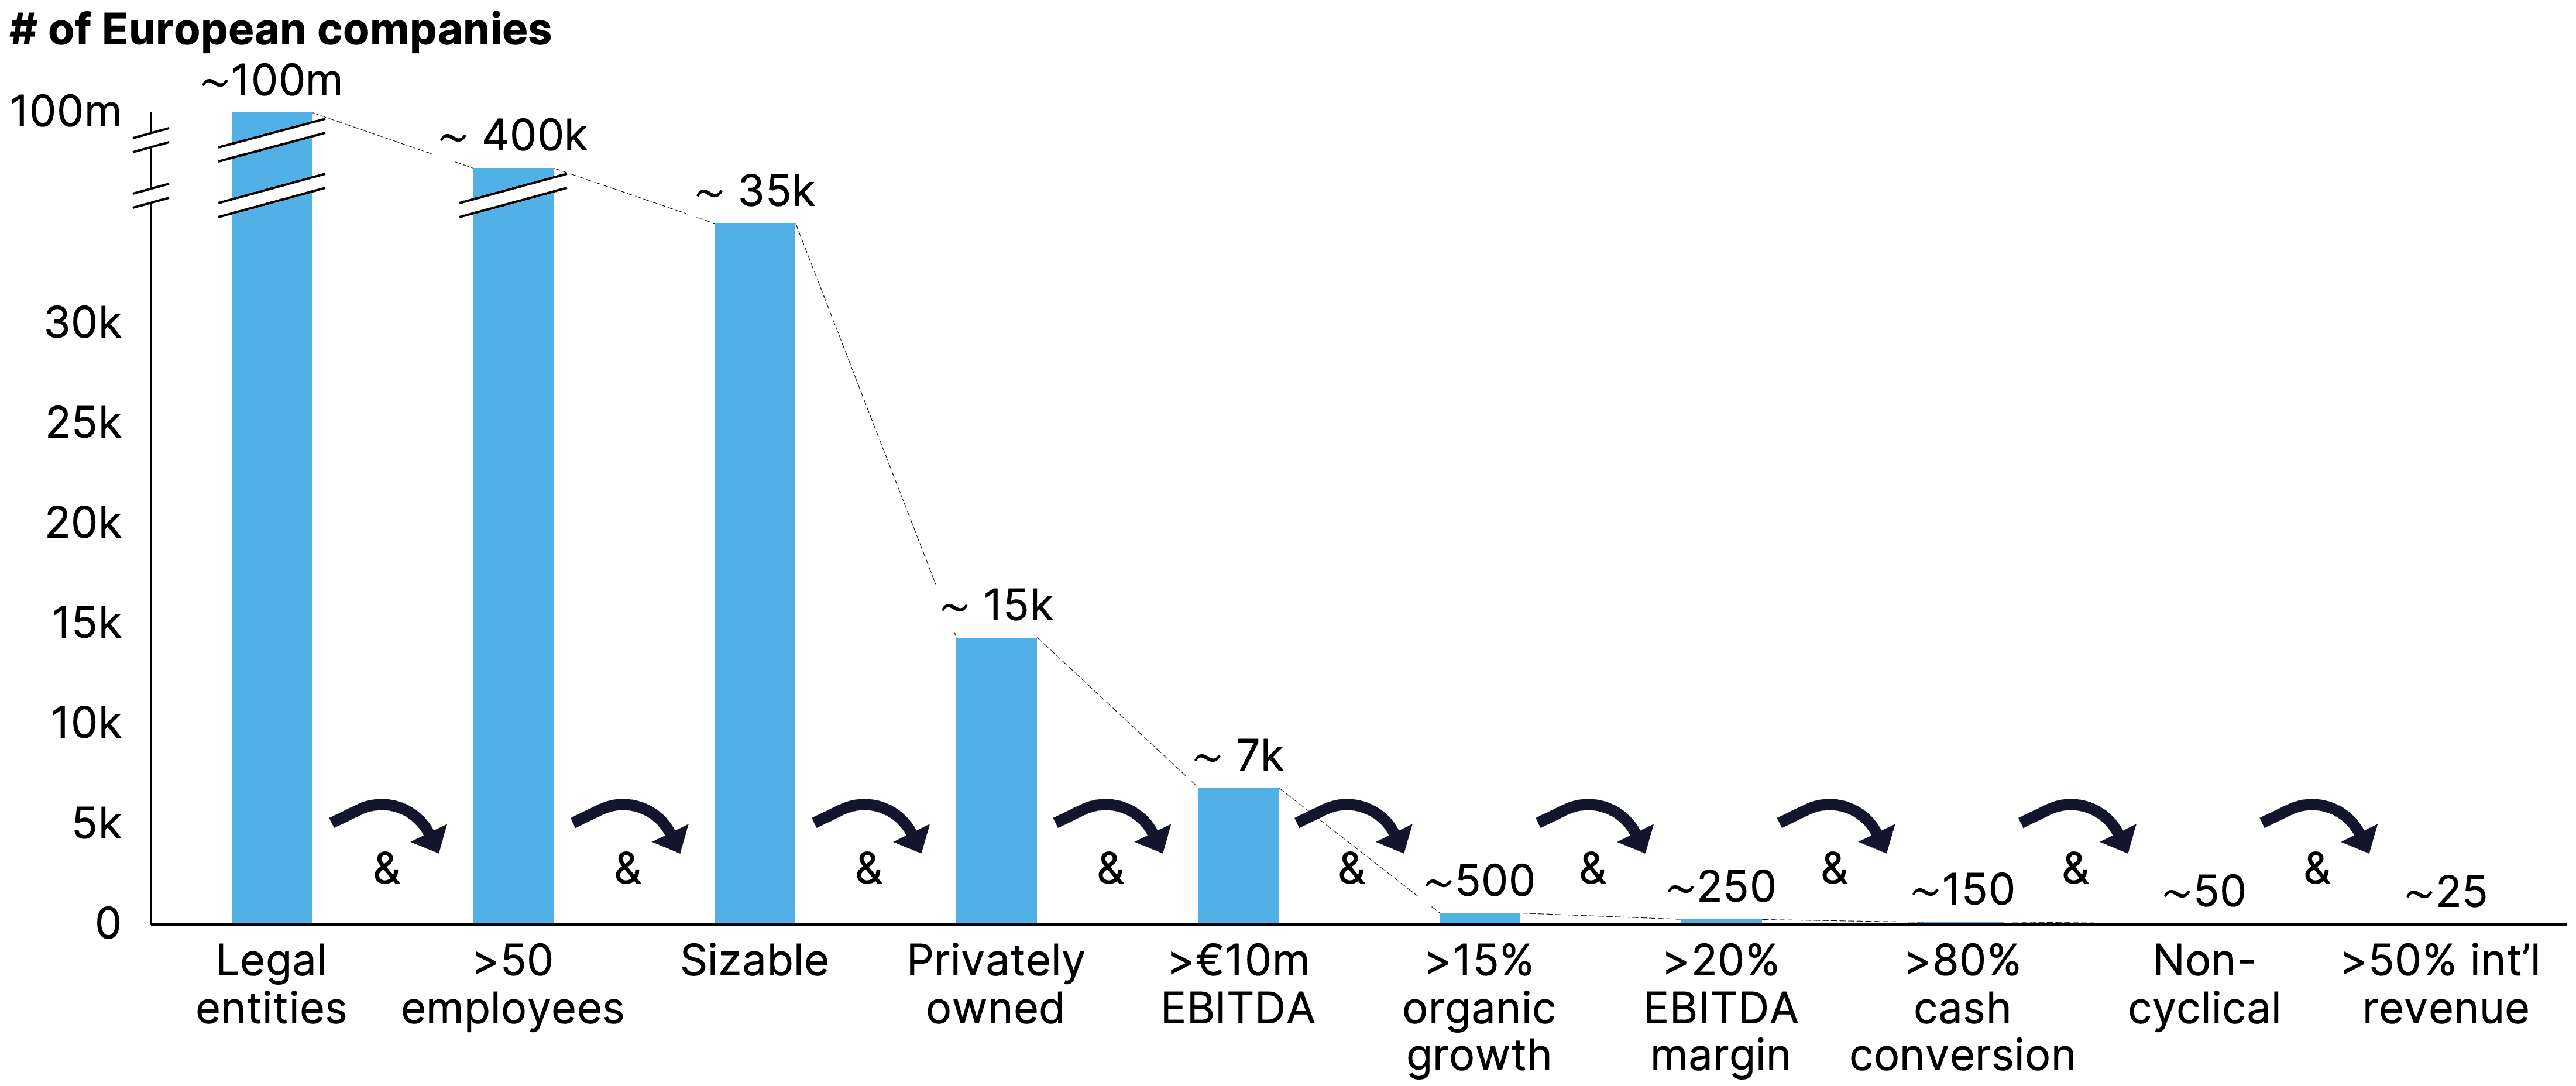
As can be seen, when narrowing the sizable companies down to those that are fully privately held (no PE/VC in the cap table) and over €10m EBITDA we are down to 7k opportunities. Some basic (but sharp) investment criteria (>15% organic growth, >20% EBITDA margin, >80% cash conversion, etc) brings our selection down to just 25(!) businesses. This is clearly too low to generate sufficient deal flow. In other words, you cannot have it all. It is important to be explicit in where you want to make trade offs if you want your sourcing efforts to deliver sufficient leads.
Investors need to define their sweet spot investment criteria as well as those elements on which they are comfortable to make trade-offs. Together, these should result in a pool of companies that is specific enough to be differentiated to build angles but broad enough to see enough deal flow. We coined this exercise the definition of the ‘Total Addressable Asset Pool (TAAP),’ and our website contains a series of resources to help PEs implement the concept
Table of Content
Chapter 3: Paths for buy-and-build
Add-ons make sense because smaller businesses are cheaper than larger ones. Importantly, this multiple arbitrage holds even when overall multiples come down. Operating synergies add further upside.
A prerequisite for a successful M&A strategy is a degree of market fragmentation. We analyze this on multiple levels of granularity and also weigh in growth and profitability to unearth the most attractive niches.
Those more ‘pristine’ industries where PE ownership is still less penetrated is of particular interest to a differentiated investment thesis. We point out exactly those niches, factoring in their overall attractiveness.
Acquisitive upside
Before we dive into the details, let us take a step back. Why does buy-and-build actually work? The easy answer is that smaller assets trade at a discount relative to larger companies. So combining multiple assets and selling the bundle means an easy gain. Our transaction data confirms as much, showing that as EBITDA increases, multiples rise on average. However, what is interesting is that this is largely only taking place in the sub-€10m EBITDA space. The effect virtually wears off completely around the €25m EBITDA mark. This is important, as it underpins that multiple arbitrage from add-ons either requires a small cap strategy or, to make a significant impact in the large cap space, a rather high volume of smaller tuck in acquisitions.

Importantly, there is another benefit to M&A. As our data shows, operating synergies are real. In fact, businesses engaged with continuous acquisitions managed to expand margins more than twice as much as companies that did not engage in M&A.

Slightly surprised by the significance of the result ourselves as well, we ran the following analyses which check whether this might be due to spurious correlations with overall performance (if you do well you do more M&A) or ownership type (PEs do more M&A). But as shown, the take-aways hold also when running such checks.


Fragmented markets
Now we know that well-executed bolt ons are lucrative, the question is where to find them. To examine this we calculate the Herfindahl–Hirschman index on the basis of our Gain.pro dataset. This data method gives a good indication of the level of concentration of a pool of companies.


Consolidation is most advanced in the FS sector whereas services, consumer and TMT are most fragmented.
Going one layer deeper and looking at the market concentration on a subsector level, the HHI index logically indicates less fragmentation. As expected, the construction, manufacturing and professional services subsectors are most fragmented, leaving more room for consolidation. In contrast, raw materials, biotechnology and insurance stand out as the most consolidated subsectors.
However, the only sensible level to analyze concentration is at the granularity of specific niches. Hence why we go yet another layer deeper. In addition, we add in the axis of organic growth to illustrate the level of market maturity

This perspective immediately makes some interesting niches visible, such as insurance services which shows a fair bit of growth in combination with low levels of market concentration. But growth is not all that matters – industry profitability levels are equally interesting. When plotting this against fragmentation, less fragmented markets with higher profitability (e.g. business management software) and more fragmented markets with lower profitability (e.g. alternative proteins) become visible. Combining all three metrics (which goes beyond a 2-by-2 depiction of the data) enables investors to find industries that combine traits of growth, profitability and fragmentation. An interesting example showing these characteristics is the healthcare IT industry. Opposed to that, many VC-backed niches such as EV charging, show low market concentration and high growth but today often still lack profitability. Overall, the very differently performing industries across sectors and subsectors outline the need for an in-depth target analysis at the most granular level possible since fragmented industries with comparably high organic growth and profitability can be found across all sectors.

Uncharted territories
Finding a fragmented space is one thing, but if there is already a strong presence of other PE houses, then it may not be that hidden gem that was hoped for. That is why we check for the level of private equity penetration on the same 3 levels of granularity as analyzed earlier. In addition, we check for the average number of add-ons per company within those industries. This serves as a proxy for the degree of maturity of already ongoing buy-and-build plays.
A first observation is that the degree of PE ownership heavily correlates with the level of buy-and-build activity that can be observed on a sector level. For instance, the services sector leads the curve with the highest PE penetration (roughly 35% of all companies) and also has the highest bolt-on volume with on average circa 3 add-ons per company. Materials & energy can be found on the lower end of the curve with the lowest PE penetration (around 20% of companies) and 1-2 add-ons per company on average.
Overall, the level of sector penetration is largely linked to the performance strength on previous analyses when we compared organic growth with cyclicality and EBITDA margins. Services, financial services, science & health and TMT lead the curve whereas materials & energy, industrials and consumer are on the lower end of the curve. One could think that those sectors are less popular among PE investors. However, industrials and consumer sectors demonstrate a very similar attractiveness to PE investors as services and TMT when looking at the number of PE investments.


The correlation remains unchanged on a subsector level where we see many services subsectors on the top right versus materials & energy and industrial subsectors on the bottom left. The subsectors show very similar PE penetration and buy-and-build activity as the sectors they are part of. However, a few outliers can be observed, for example biotechnology with roughly 15% penetration and around 1 add-on on average.

Lastly, on an industry level the picture becomes even more dispersed. We can find a lot of industries in the low PE penetration (below 30%) as well as the low buy-and-build activity (below 2 add-ons) quartile. There are also more outliers with a few industries showing very high PE penetration (50-60%) such as wealthtech, exhibition management and security systems. Also with regards to buy-and-build activity, some outliers can be found with high buy-and-build activity (more than 5 add-ons on average) such as ERP software development or media chains. In all, the true value is in the detail here, as some niches certainly look underpenetrated in relation to their relative attractiveness.
Chapter 4: Investor takeaways and reccomendations
Based on the insights from this study we recommend the following actions to European investors:
Chapter 5: Report Methodology
The dataset for this study is retrieved from the Gain.pro platform. Our data is built up as follows: as a starting point we track all (>100m legal entities) in Europe to detect sizable companies. As a result, our platform contains a profile on every business with >50 employees (totalling approximately 400k companies). We subsequently analyze those we consider ‘investable assets’ in even more depth. This includes all companies that exceed either €5m EBITDA, €50m revenue, €10m funding raised or >250 FTEs, which results in ~35k companies. This study heavily draws on 2 unique elements of our dataset for those assets. The first is that we track an approximation of organic growth for every company based on an in-depth outside-in analysis of their financials (i.e. when normalizing for any M&A, switching topcos etc). The second is that our platform clearly distinguishes platform deals from add-on M&A, resulting in a much clearer view on levels of dealmaking including buy-and-build activity. This enables us to generate insights on the private asset pool you simply cannot create with any other database.
Certain limitations of the analysis should be mentioned. The analyzed companies for which sufficient data is available contains a skew towards institutional ownership. To be precise, for the analyzed companies at a detailed level, 11% were VC-backed, 32% were PE-backed, 10% were minority PE-backed, 2% were longhold and 45% were private companies. Where appropriate we aimed to reduce this sample bias by for instance only analyzing PE-held assets. This is disclosed in the footnotes where applicable. In addition, our focus on ‘investable assets’ inevitably skews towards sizable companies and also leads to a degree of survivor bias. In addition, companies in the dataset have different reporting standards and timings. For instance, some companies have not published annual reports for the years 2021 or 2022 yet. This also leads to the inclusion of different time frames when calculating e.g. 5-years figures averages or CAGRs. Lastly, the inherent low data availability in private markets means that metrics such as organic growth estimates are made that can be incorrect in individual cases. However, it is likely that most of these limitations are normalized at the aggregate level that this study presents our insights at.
Acknowledgements
This report was prepared by Frister Haveman, Co-Founder and Co-CEO; Helen Westermann, Head of Private Equity Intelligence Europe; Brian Leenen, Head of Data Engineering; and Philipp Wank, Head of Private Equity Intelligence DACH.


