
The Europe
50
Industrials Edition: Ranking the most active investors in the European industrial sector
In our inaugural report, “The Europe 250,” we ranked the most active investors on the continent. For a more granular look, we take this one level deeper, assessing investors from a sectoral and geographical perspective. We kick this off by analyzing and ranking the largest and most active investors in the European Industrials sector. Our ranking is based on the size of the underlying portfolio and is calculated with the help of our proprietary algorithm.
Compared to some existing global investor rankings based on recent fundraising activity, we have chosen a novel approach in order to capture the geographical element as well as the investor specific (fund-related) technicalities. Given we at Gain.pro track investor portfolios on an asset level with the most complete and high quality information available on the market, we are well-positioned to construct a more accurate ranking. This ranking is determined by the total managed EV of each investor, calculated by multiplying the number of European Industrials portfolio companies by the median portfolio EBITDA and a predicted EBITDA multiple derived from a proprietary valuation algorithm developed by Gain.pro.


Download the full report
Leverage our insights to analyze the largest and most active investors in the European Industrials sector.
Highlighted insight
The Europe 50: Industrials Edition
#
Investor
01
CVC
02
EQT
03
Triton
04
KKR
05
Waterland
06
Permira
07
Bpifrance
08
Groupe HLD
09
Apax Partners
10
OMERS
HQ
European portfolio
Managed EV, €
Entries/Exits since '18
Median EBITDA, €
Fundraising since '18, €
GB
10 companies
14.3bn
8/1
170.7m
69.3bn
SE
14 companies
13.1bn
10/9
170.3m
112.5bn
GB
18 companies
6.5bn
11/2
50.3m
8.4bn
US
9 companies
5.8bn
7/3
90.6m
107.0bn
NL
30 companies
4.0bn
29/6
14.2m
6.5bn
GB
8 companies
3.6bn
8/0
53.9m
33.1bn
FR
98 companies
3.5bn
92/19
13.1m
6.2bn
LU
7 companies
3.4bn
5/0
60.0m
-
GB
5 companies
3.4bn
4/3
60.2m
13.1bn
CA
8 companies
3.4bn
4/2
77.2m
-

See all Top 50 Industrial leaders
Leverage our insights to analyze the largest and most active investors in the European Industrials sector
Methodology
The ranking is determined by the total managed EV of each investor, calculated by multiplying the number of European Industrials portfolio companies by the median portfolio EBITDA and a predicted EBITDA multiple derived from a proprietary valuation algorithm developed by Gain.pro. Moreover, the managed EV is adjusted when the investor primarily engages in minority investments.
Investors who have executed less than 3 investments in Europe between January 2018 and September 2023 are excluded from the ranking. The median portfolio EBITDA calculation only includes companies with a positive EBITDA, and the ranking only includes investors with more than 4 EBITDA positive investments in Europe. Therefore, this ranking is focused on traditional buyout investments vs. growth investments.
Fundraising data, investor entries and exits refer to a timeframe from January 2018 to September 2023. Fundraising data includes investors’ global strategies and is not restricted to Europe only.
Download the full report
Leverage our insights to analyze the largest and most active investors in the European Industrials sector.
Get faster, smarter insights on private companies
One platform to find, assess and act on every opportunity.

© 2025 Gain.pro, all rights reserved
Gain.pro is SOC 2 Type 2 Certified


The Europe
50
Industrials Edition: Ranking the most active investors in the European industrial sector
In our inaugural report, “The Europe 250,” we ranked the most active investors on the continent. For a more granular look, we take this one level deeper, assessing investors from a sectoral and geographical perspective. We kick this off by analyzing and ranking the largest and most active investors in the European Industrials sector. Our ranking is based on the size of the underlying portfolio and is calculated with the help of our proprietary algorithm.
Compared to some existing global investor rankings based on recent fundraising activity, we have chosen a novel approach in order to capture the geographical element as well as the investor specific (fund-related) technicalities. Given we at Gain.pro track investor portfolios on an asset level with the most complete and high quality information available on the market, we are well-positioned to construct a more accurate ranking. This ranking is determined by the total managed EV of each investor, calculated by multiplying the number of European Industrials portfolio companies by the median portfolio EBITDA and a predicted EBITDA multiple derived from a proprietary valuation algorithm developed by Gain.pro.
Download the full report
Leverage our insights to analyze the largest and most active investors in the European Industrials sector.
Highlighted insight
The Europe 50: Industrials Edition
#
Investor
01
CVC
02
Blackstone
03
Triton
04
Carlyle
05
PAI Partners
06
KKR
07
ICG
08
Equistone
09
One Equity Partners
10
KPS Capital Partners
HQ
European portfolio
Managed EV, €
Entries/Exits since '18
Median EBITDA, €
Fundraising since '18, €
GB
8 companies
4,8bn
9/5
113.6m
69.3bn
US
7 companies
4,7bn
6/1
76.8m
112.5bn
GB
17 companies
4,6bn
9/7
108.7m
107.0bn
US
15 companies
3,4bn
12/5
320.4m
-
FR
6 companies
3,0bn
7/1
253.1m
21.5bn
US
6 companies
2,5bn
5/4
99.9m
33.1bn
GB
35 companies
2.0bn
3/5
117.2m
197.2bn
GB
20 companies
1,9bn
12/7
132.4m
38.2bn
US
9 companies
1,4bn
8/2
95.2m
22.9bn
US
5 companies
1,4bn
6/1
432.0m
38.5bn
See all Top 50 Industrial leaders
Leverage our insights to analyze the largest and most active investors in the European Industrials sector
See all Top 50 Industrial leaders
Leverage our insights to analyze the largest and most active investors in the European Industrials sector
Methodology
The ranking is determined by the total managed EV of each investor, calculated by multiplying the number of European Industrials portfolio companies by the median portfolio EBITDA and a predicted EBITDA multiple derived from a proprietary valuation algorithm developed by Gain.pro. Moreover, the managed EV is adjusted when the investor primarily engages in minority investments.
Investors who have executed less than 3 investments in Europe between January 2018 and September 2023 are excluded from the ranking. The median portfolio EBITDA calculation only includes companies with a positive EBITDA, and the ranking only includes investors with more than 4 EBITDA positive investments in Europe. Therefore, this ranking is focused on traditional buyout investments vs. growth investments.
Fundraising data, investor entries and exits refer to a timeframe from January 2018 to September 2023. Fundraising data includes investors’ global strategies and is not restricted to Europe only.
Download the full report
Leverage our insights to analyze the largest and most active investors in the European Industrials sector.

Author:
Frister Haveman
Co-Founder & Co-CEO, Gain.pro
Frister founded Gain.pro in 2018. Today, he leads the company as CEO with a mission to build it out into a global market leader. Prior to Gain.pro, Frister spent his career in consulting and private equity with Bain, Gilde and Bridgepoint. He combines this experience with a deep passion for technology. Frister lived and worked predominantly in Amsterdam, Munich and London. He holds a master's degree in Finance from the University of St. Gallen in Switzerland.

Author:
Jessie Peitsch
Content Marketing Manager, Gain.pro
Jessie joined Gain.pro in 2022 and currently works as the Content Marketing Manager. She is responsible for Gain.pro’s messaging across all channels, including social media, website and blog. She also helps edit the platform’s deep dive reports. Previously, Jessie worked in PropTech where she gained experience in content marketing. She holds a Bachelor’s degree in English and Creative Writing from the University of British Columbia in Canada.
Get faster, smarter insights on private companies
Get faster, smarter insights on private companies
One platform to find, assess and act on every opportunity.
Resources
© 2025 Gain.pro, all rights reserved
Gain.pro is SOC 2 Type 2 Certified
One platform to find, assess and act on every opportunity.
Resources
© 2025 Gain.pro, all rights reserved
Gain.pro is SOC 2 Type 2 Certified
The Europe
50
Industrials Edition: Ranking the most active investors in the European industrial sector
In our inaugural report, “The Europe 250,” we ranked the most active investors on the continent. For a more granular look, we take this one level deeper, assessing investors from a sectoral and geographical perspective. We kick this off by analyzing and ranking the largest and most active investors in the European Industrials sector. Our ranking is based on the size of the underlying portfolio and is calculated with the help of our proprietary algorithm.
Compared to some existing global investor rankings based on recent fundraising activity, we have chosen a novel approach in order to capture the geographical element as well as the investor specific (fund-related) technicalities. Given we at Gain.pro track investor portfolios on an asset level with the most complete and high quality information available on the market, we are well-positioned to construct a more accurate ranking. This ranking is determined by the total managed EV of each investor, calculated by multiplying the number of European Industrials portfolio companies by the median portfolio EBITDA and a predicted EBITDA multiple derived from a proprietary valuation algorithm developed by Gain.pro.
Download the full report
Leverage our insights to analyze the largest and most active investors in the European Industrials sector.
Highlighted insight
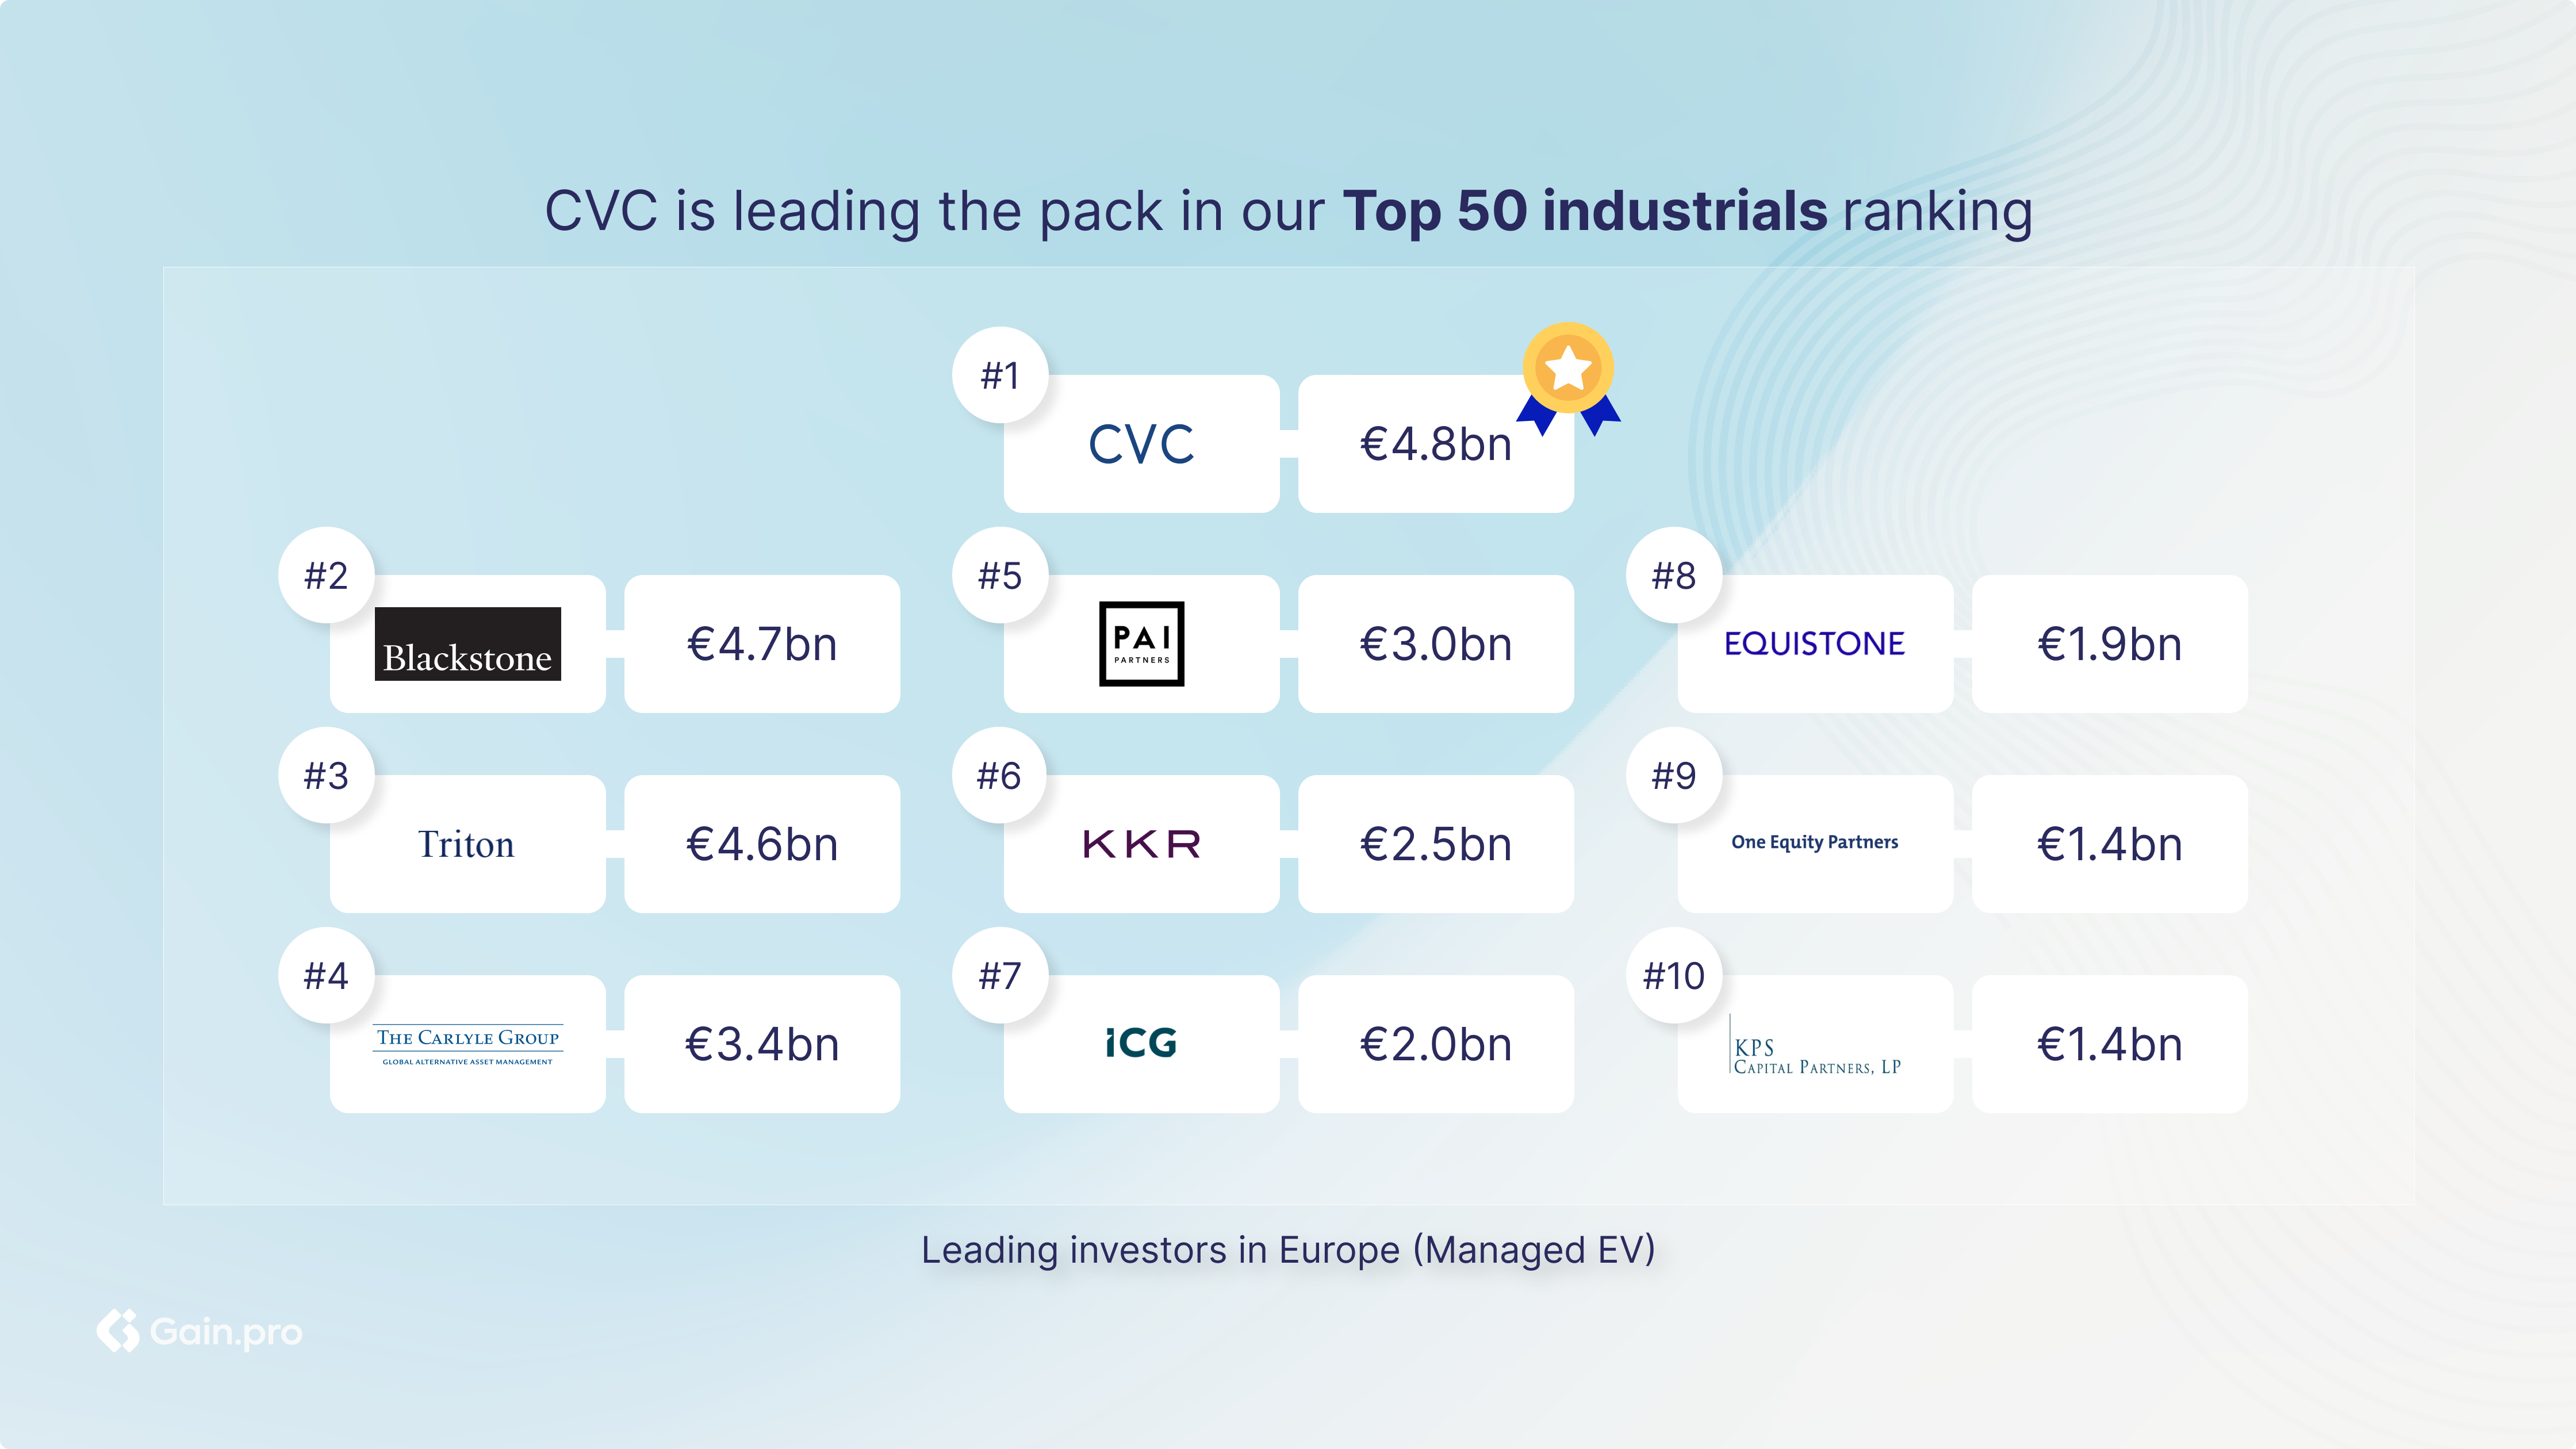
The Europe 50: Industrials Edition
#
Investor
01
CVC
02
Blackstone
03
Triton
04
Carlyle
05
PAI Partners
06
KKR
07
ICG
08
Equistone
09
One Equity Partners
10
KPS Capital Partners
HQ
European portfolio
Managed EV, €
Entries/Exits since '18
Median EBITDA, €
Fundraising since '18, €
GB
8 companies
4.8bn
9/5
106.1
69.3bn
US
7 companies
4.7bn
6/1
117.2m
197.2bn
GB
17 companies
4.6bn
9/7
53.9m
8.4bn
US
15 companies
3.4bn
12/5
35.0m
80.2
FR
6 companies
3.0bn
7/1
74.5m
8.7bn
US
6 companies
2.5bn
5/4
99.3m
107.0bn
GB
5 companies
2.0bn
3/5
55.0m
31.3bn
GB
20 companies
1.9bn
12/7
17.3m
2.8bn
US
9 companies
1.4bn
8/2
34.0m
5.2bn
US
5 companies
1.4b n
6/1
45.0m
8.1bn
See all Top 50 Industrial leaders
Leverage our insights to analyze the largest and most active investors in the European Industrials sector
See all Top 50 Industrial leaders
Leverage our insights to analyze the largest and most active investors in the European Industrials sector
Methodology
The ranking is determined by the total managed EV of each investor, calculated by multiplying the number of European Industrials portfolio companies by the median portfolio EBITDA and a predicted EBITDA multiple derived from a proprietary valuation algorithm developed by Gain.pro. Moreover, the managed EV is adjusted when the investor primarily engages in minority investments.
Investors who have executed less than 3 investments in Europe between January 2018 and September 2023 are excluded from the ranking. The median portfolio EBITDA calculation only includes companies with a positive EBITDA, and the ranking only includes investors with more than 4 EBITDA positive investments in Europe. Therefore, this ranking is focused on traditional buyout investments vs. growth investments.
Fundraising data, investor entries and exits refer to a timeframe from January 2018 to September 2023. Fundraising data includes investors’ global strategies and is not restricted to Europe only.
Download the full report
Leverage our insights to analyze the largest and most active investors in the European Industrials sector.

Author:
Philipp Wank
Head of PEI DACH, Gain.pro
Philipp joined Gain.pro in 2022 as an Associate to support the expansion of the Company’s Private Equity Intelligence division in the DACH region. After leveraging the platform data via the Finding Growth in Europe research and developing additional content around ESG, he stepped up to lead the DACH team. Philipp brings previous experience from venture capital at coparion and strategy consulting at Capgemini Invent.
Get faster, smarter insights on private companies
Get faster, smarter insights on private companies
One platform to find, assess and act on every opportunity.
© 2025 Gain.pro, all rights reserved
Gain.pro is SOC 2 Type 2 Certified
One platform to find, assess and act on every opportunity.
© 2025 Gain.pro, all rights reserved
Gain.pro is SOC 2 Type 2 Certified